Implications
Leptin is an adipokine that regulates energetic metabolism, appetite and food intake in mammals. The effect of exercise on plasma leptin concentration in horses is still not clear. The results of the present study indicate that some kinds of exercise increase the plasma leptin level in horses. Better understanding of the regulation of leptin release during exercise could contribute towards improving the performance and state of health of exercising horses; it is thus clear that detailed knowledge of improving the performance of trained horses will have an economic importance. The data presented in this study have never been published elsewhere.
Introduction
In horses, as in other mammals, leptin is an adipokine secreted mainly by the adipose tissue. Generally, plasma leptin level correlates positively with body fat mass (Gentry et al., Reference Gentry, Thompson, Gentry, Davis, Godke and Cartmill2002; Kearns et al., Reference Kearns, McKeever, Roegner, Brady and Malinowski2006) and plasma triacylglycerol (TG) concentration (Kędzierski and Kapica, Reference Kędzierski and Kapica2008) as well as with the age of horses (Buff et al., Reference Buff, Morrison, Ganjam and Keisler2005; Gordon et al., Reference Gordon, McKeever, Betros and Manso Filho2007a; Čebulj-Kadunc et al., Reference Čebulj-Kadunc, Kosec and Cestnik2009). The synthesis of leptin is stimulated by insulin and corticosteroids, whereas catecholamines play an inhibiting role in the leptin synthesis (Meier and Gressner, Reference Meier and Gressner2004). Leptin informs the central nervous system not only about nutritional status but also about energy balance and it regulates appetite suppression and food intake (Buff et al., Reference Buff, Dodds, Morrison, Whitley, McFadin, Daniel, Djiane and Keisler2002; Meier and Gressner, Reference Meier and Gressner2004). Low plasma leptin level in horses is associated with some behavioural disorders, such as crib-biting (Hemmann et al., Reference Hemmann, Koho, Vainio and Raekallio2013), as well as with mortality in foals (Barsnick et al., Reference Barsnick, Hurcombe, Smith, Slovis, Sprayberry, Saville and Toribio2011). High level of this adipokine was stated in horses predisposed to insulin resistance (Frank et al., Reference Frank, Elliott, Brandt and Keisler2006; Carter et al., Reference Carter, McCutcheon, George, Smith, Frank and Geor2009; Pleasant et al., Reference Pleasant, Suagee, Thatcher, Elvinger and Geor2013). Plasma concentration of leptin in horses shows the diurnal variation attributed to the feeding regimen (Buff et al., Reference Buff, Morrison, Ganjam and Keisler2005; Gordon and McKeever, Reference Gordon and McKeever2005; Steelman et al., Reference Steelman, Michael-Eller, Gibbs and Potter2006). Food deprivation or other states of energy imbalance induce a short-time decrease in plasma leptin level (Kędzierski et al., Reference Kędzierski, Kapica, Kolstrung and Pluta2008; Gastal et al., Reference Gastal, Gastal, Beg and Ginther2010). High-energy diet, however, leads to an increased leptin secretion (Van Weyenberg et al., Reference Van Weyenberg, Hesta, Buyse, Papadopoulos and Janssens2008). Changes in plasma leptin concentration in response to an existing energy status are connected to the other hormones, which regulate energy metabolism: insulin, corticosteroids and catecholamines (Meier and Gressner, Reference Meier and Gressner2004).
However, the effect of exercise is still not clear. Corticosteroids and catecholamine secretions increase during exercise, whereas insulin level decreases. The ratio of changes in these hormones levels depends, however, on the intensity and duration of the performed exercise (Snow et al., Reference Snow, Harris, MacDonald, Forster and Marlin1992; Desmecht et al., Reference Desmecht, Linden, Amory, Art and Lekeux1996; Gordon et al., Reference Gordon, McKeever, Betros and Manso Filho2007b). In exercised horses, all variations (increase, decrease or any change) in plasma leptin values have been described (Gordon et al., Reference Gordon, McKeever, Bokman, Betros, Manso Filho, Liburt and Streltsova2006 and Reference Gordon, McKeever, Betros and Manso Filho2007b; Kędzierski and Kapica, Reference Kędzierski and Kapica2008). Leptin secretion during exercise is an especially interesting aspect of research because this hormone is involved in the processes of energy production and expenditure. In mammals, leptin can increase both the lipolysis rate in the adipose tissue and fatty-acid oxidation in the liver (Ramsay, Reference Ramsay2001; Dotsch et al., Reference Dotsch, Meissner and Rascher2003). In athletic horses, for example, efficiency of the lipolysis rate and fatty-acid oxidation helps determine good racing results (Pösö et al., Reference Pösö, Viljanen-Tarifa, Soveri and Oksanen1989; Kędzierski et al., Reference Kędzierski, Bergero and Assenza2009). The aim of this study was to evaluate the influence of exercise intensity and duration on the concentration of plasma leptin in working horses.
Material and methods
Horses
A total number of 38 horses were prospectively included in the study. All horses were studied while they were performing routine exercises. The routine was either a part of the horses’ training or typical work schedule. They were: six dressage stallions aged 6 to 16 years (group D); 12 jumping stallions aged 5 to 10 years – warm-blooded horses of mixed breeds (group J); 12 Thoroughbred horses involved in race training – six stallions and six mares – aged 2 to 3 years (group R); and eight stallions of Polish Małopolska breed aged between 4 and 13 years (group H). The studied horses of the Małopolska breed were used for light draught in agritourism farms and were examined during their work in a harness. Athletic and race horses were examined twice in 1 year, in 4-weekly intervals during the summer; there are, therefore, twice as many results from the exercise tests (n) than there were individual horses in the groups. Four draught horses from group H were studied twice and four only once (n=12). The studied horses were trained and treated in a manner characteristic for their use in sport, races or agricultural work. During the study, the horses did not show clinical symptoms of any illness. For each horse, the body condition score (BCS) was determined by a veterinarian with the use of the rating system of Henneke et al. (Reference Henneke, Potter, Kreider and Yeates1983), ranging from 1 to 9.
The study was conducted according to the European Community regulations concerning the protection of experimental animals. The study was accepted by the Local Ethics Review Committee for Animal Experimentation.
Exercise test protocol
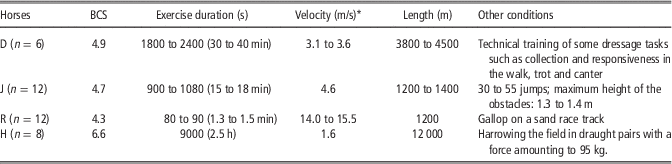
Detailed data concerning the exercise type, intensity and duration that horses were submitted to are shown in Table 1. All horses were studied during training sessions or agricultural work, which were always performed in the morning. The exercise events were not competitive. Horses from groups D and J were exercised inside a riding arena. During the study, each jumping horse (group J) overcame 40 to 55 obstacles of maximum height of 1.3 m during the first studied training session, and 30 to 35 obstacles, with each obstacle of maximum height of 1.4 m during the second training session. The race horses (group R) were studied during their routine training sessions, which were performed on the Sluzewiec race track (Warsaw, Poland). During the days of the study, the track was wet and ‘heavy’ because of the rain. The draught horses (group H) were studied while they were working on the farm. They were examined during the harrowing of the field while using traditional harrows. The horses used during harrowing were harnessed in teams. The force necessary to pull the harrows was measured by a dynamometer. The horses worked in the harness for about 2.5 h. They received 5 min rest periods for every 45 min of work. All studied draught horses were examined in comparable weather conditions. For each horse, four jugular venous blood samples were collected. The blood was taken at rest, immediately after the end of an exercise period, as well as 30 min and 24 h after the end of the exercise period. Test tubes containing tri-potassium EDTA were used to collect the blood samples. The samples were immediately centrifuged for plasma separation. The plasma samples were then frozen at −20°C for at most 3 months before analysis.
Technical conditions of the exercise performed by the studied groups of horses and the horses’ body condition score (BCS)

D=dressage; J=show jumping; R=race; H=draught.
*Mean velocity during working: D, J and H horses had some technical rests during the studied exercise period.
Blood analysis
Blood lactic acid (LA) concentration was determined immediately in the field using an enzymatic diagnostic kit (Dr Lange, Berlin, Germany). Concentrations of plasma TG and uric acid (UA) were determined using Cormay kits (Lublin, Poland). Plasma glycerol level was measured using the Boehringer Mannheim (Darmstadt, Germany) enzymatic test. Free fatty-acid (FFA) levels were measured using the Roche (Manheim, Germany) enzymatic test. All samples were analysed twice. Plasma leptin concentration was determined using a radioimmunoassay leptin RIA multi-species kit (Millipore/Linco Research, St. Charles, USA), previously validated for use in horses (McManus and Fitzgerald, Reference McManus and Fitzgerald2000). Samples were counted for 1 min using a gamma counter (Packard Instruments Company, Ramsey, USA). Antibodies used in the kit were raised against the human leptin. Therefore, the leptin concentration was expressed as ng/ml human equivalent. Sensitivity of the assay was 1 ng/ml human equivalent. The inter-assay CV calculated from two runs was 10%. The median of CVs was 8.5%. The intra-assay CV calculated from duplicate samples was 14%. Median of all CVs calculated from duplicate samples was 11%. For plasma cortisol determination, the CORTISOL ELISA kit (DRG International Inc., Mountainside, NJ, USA) was used. The range of the assay is between 0 and 800 ng/ml. The absorbance was measured by Multiscan reader (Labsystem, Helsinki, Finland) using the GENESIS V 3.00 software. The intra-assay and inter-assay CV for plasma cortisol concentration determined in the laboratory amounted to 5% and 8%, respectively. The values of biochemical parameters are expressed as mmol/l, and hormones as ng/ml.
Statistical analysis
The results are presented as the medians with the ranges. The data were compared with the use of multifactorial ANOVA (GLM; SAS software), regarding the effect of the time of blood sampling (at rest, immediately after the end of an exercise period, 30 min after the end of the exercise period and 24 h after the end of the exercise period) and group of horses (D, J, R and H). The significance of the differences in the data obtained in the analysed groups was estimated using Tukey’s test. The coefficient correlation was also performed to compare the exercise-induced changes in the values of the studied parameters using Pearson’s correlation coefficient (r) test. Statistical significance was accepted at the level of P<0.05.
Results
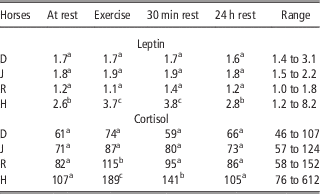
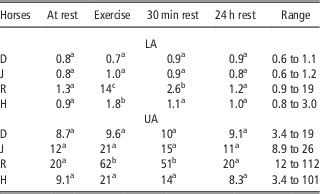
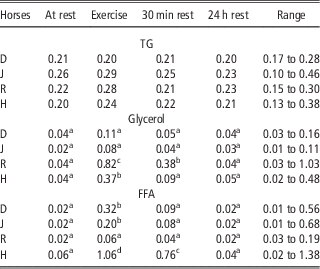
The results of plasma leptin and cortisol concentrations measured during the study are presented in Table 2. The only statistically significant increase in the plasma leptin concentration was observed in group H in samples taken immediately after exercising and 30 min after exercising, when compared with the values obtained at rest. In groups R and H, a significantly increased plasma cortisol concentration was shown immediately after exercising. Blood LA concentrations determined immediately after exercising in horses from groups D and J were not influenced by the performed effort (Table 3). In group H, blood LA measured immediately after exercise increased significantly in comparison with the resting values. The highest concentrations of blood LA were stated in group R. Plasma UA level significantly increased after exercise only in group R (Table 3). Performed exercise increased plasma glycerol and FFA concentrations in all studied groups of horses (Table 4). Post-exercise values of glycerol were particularly high in group R. However, the highest plasma FFA concentration determined immediately after exercise was stated in group H. Exercise-induced changes in all the studied parameters were also calculated; they were expressed as the ratio of values obtained immediately after exercising to values obtained at rest (exercise-to-rest ratio). Statistically significant correlation coefficient was found only for the leptin exercise-to-rest ratio and cortisol exercise-to-rest ratio (r=0.64; P<0.001), and leptin exercise-to-rest ratio and glycerol exercise-to-rest ratio (n=−0.41; P<0.01), whereas the results achieved from all horses were analysed.
Plasma leptin and cortisol concentrations (ng/ml) in the studied horses during the exercise tests (median and range)

D=dressage; J=show jumping; R=race; H=draught.
a,b,cValues market with different letters differ significantly at P<0.05; the samples were taken: At rest – in the morning, before exercising, Exercise – immediately after the exercise period, 30 min rest-30 min after exercising, 24 h rest-24 h after the exercise period.
Blood lactic acid (LA) and plasma uric acid (UA) concentrations (mmol/l) in the studied horses during the exercise tests (median and range)

D=dressage; J=show jumping; R=race; H=draught.
a,b,cValues market with different letters differ significantly at P<0.05; the samples were taken: At rest – in the morning, before exercising, Exercise – immediately after the exercise period, 30 min rest-30 min after exercising, 24 h rest-24 h after the exercise period.
Plasma triacylglycerols (TG), glycerol and free fatty-acid (FFA) concentrations (mmol/l) in the studied horses during the exercise tests (median and range)

D=dressage; J=show jumping; R=race; H=draught.
a,b,c,dValues market with different letters differ significantly at P<0.01; the samples were taken: At rest – in the morning, before exercising, Exercise – immediately after the exercise period, 30 min rest-30 min after exercising, 24 h rest-24 h after the exercise period.
Discussion
In the studied horses, short-time, transient increase in plasma leptin concentration was only stated in harnessing horses. The other studied kinds of exercises did not influence leptin synthesis and release. This observation is consistent with the previous reports. Cartmill et al. (Reference Cartmill, Thompson, Storer, Gentry and Huff2003) and Piccione et al. (Reference Piccione, Bertolucci, Foa and Caola2004) did not find any change in the leptin level of exercised horses. Gordon et al. (Reference Gordon, McKeever, Betros and Manso Filho2007b) only noted a decrease in the plasma leptin concentration 24 h after Standardbred mares had been exercised. Gordon et al. (Reference Gordon, McKeever, Bokman, Betros, Manso Filho, Liburt and Streltsova2006) and Kędzierski and Kapica (Reference Kędzierski and Kapica2008), however, have reported an increase in plasma leptin concentration observed just after Standardbred horses had been exercised. The reason for this diversity in the exercise-induced response of the plasma leptin concentration is still not explained.
In fact, horses in group H had higher BCS than other groups. It is known that BCS positively correlates with the plasma leptin level (Buff et al., Reference Buff, Dodds, Morrison, Whitley, McFadin, Daniel, Djiane and Keisler2002; Gordon et al., Reference Gordon, McKeever, Betros and Manso Filho2007a). Therefore, harnessing horses studied here also had higher plasma leptin concentration determined at rest than other horses. On the contrary, the work by Cartmill et al. (Reference Cartmill, Thompson, Storer, Gentry and Huff2003) showed that horses with similar BCS could have various levels of leptin in the blood. However, higher plasma leptin concentration at rest in horses from group H cannot be the reason of post-exercise increase of about 60% observed in this adipokine during this study. The studied horses were subjected to different types of exercises. The write-up of the performed-exercise type, intensity and duration (Table 1) indicates that the race training session was the most intensive type of effort (group R). The least intensive exercise was applied during the dressage training (group D). The relative intensity of exercise in horses can also be estimated on the basis of changes in some biochemical parameters, for example, LA and UA levels (Desmecht et al., Reference Desmecht, Linden, Amory, Art and Lekeux1996; Escribano et al., Reference Escribano, Molina, Valera, Tovar, Agüera, Santisteban, Vivo, Agüera and Rubio2013). Generally, the post-exercise values of LA and UA correlate positively with the intensity of exercise (Desmecht et al., Reference Desmecht, Linden, Amory, Art and Lekeux1996; Castejón et al., Reference Castejón, Trigo, Muñoz and Riber2006). The LA is produced in working muscles in effect of anaerobic glycolysis. Intense exercise also leads to adenine nucleotide degradation, and therefore the level of plasma UA is a good marker of muscle ATP loss (Castejón et al., Reference Castejón, Trigo, Muñoz and Riber2006). Analysis of LA and UA values shows that exercising was most intensive in group R, less intensive in groups H and J, and the least intensive in horses from group D. The blood LA concentrations in group R was higher than those reported in race horses during training sessions (Kędzierski and Bergero, Reference Kędzierski and Bergero2006; Kędzierski et al., Reference Kędzierski, Bergero and Assenza2009 and Reference Kędzierski, Cywińska, Strzelec and Kowalik2014). It is likely that the significant increase in blood LA in group R was the result of the horses being submitted to gallop on the wet and heavy track. On the contrary, horses from groups D and J performed technical training at slow speed and had rests between subsequent jumps or other heavy elements of dressage, which constitutes aerobic type of exercise and induces low post-exercise blood LA levels in these horses. Results of other studies indicated that show-jumping led to increase in blood LA level in horses, but these results were obtained in competitive conditions (Desmecht et al., Reference Desmecht, Linden, Amory, Art and Lekeux1996). Exercise duration was also different in particular groups in our study. However, exercise intensity or duration, or changes in blood LA and plasma UA levels, did not correlate with the observed changes in plasma leptin concentration. Cortisol exercise-to-rest ratio was the only factor that positively correlated with the changes in plasma leptin concentration; in this case, it correlated positively with the leptin exercise-to-rest ratio calculated for all studied horses. This result suggests that the increase in plasma leptin concentration, which was stated in this study in group H, was associated with changes in cortisol release during exercise. It is known that the degree of the exercise-induced increase in the cortisol level depends on both the intensity and duration of exercise (Desmecht et al., Reference Desmecht, Linden, Amory, Art and Lekeux1996). Moreover, it was reported that endurance exercises involved a higher increase in plasma cortisol concentration than short-term bouts of exercise (Desmecht et al., Reference Desmecht, Linden, Amory, Art and Lekeux1996). The highest increase in plasma cortisol level was described in endurance horses; however, race training session also involved a significant rise in the level of this hormone level (Desmecht et al., Reference Desmecht, Linden, Amory, Art and Lekeux1996; Kędzierski et al., Reference Kędzierski, Cywińska, Strzelec and Kowalik2014). Cortisol is known as the factor that increases the synthesis and release rate of leptin from the adipose tissue (Meier and Gressner, Reference Meier and Gressner2004). Therefore, the exercise-induced increase in the cortisol release rate was the most probable reason for the observed increase in the plasma leptin level in exercised horses. In the present study, the increase in the plasma cortisol concentration was also stated in race horses. However, it is known that high-intensity exercise also involves the release of extensive amounts of catecholamines (Snow et al., Reference Snow, Harris, MacDonald, Forster and Marlin1992; Baragli et al., Reference Baragli, Pacchini, Gatta, Ducci and Sighieri2010). Catecholamines play an inhibitory role in the regulation of leptin synthesis (Meier and Gressner, Reference Meier and Gressner2004). It can be assumed that lack of changes in the plasma leptin concentration in race horses is a result of the simultaneous increase in both cortisol and adrenaline. These two hormones have an opposing influence on leptin synthesis.
Some reports indicate that high plasma leptin concentration exists together with elevated plasma lipids content (Frank et al., Reference Frank, Elliott, Brandt and Keisler2006; Kędzierski et al., Reference Kędzierski, Kusy and Kowalik2011; Pleasant et al., Reference Pleasant, Suagee, Thatcher, Elvinger and Geor2013). This is the reason for the analysis of changes in plasma leptin in relation to TG, glycerol and FFA concentrations in this study; however, no important relationship was found. In the author’s opinion, the stated correlation between glycerol and leptin exercise-to-rest ratios (r=−0.41) is coincidental. Admittedly, negative correlation between these two parameters is probable. It is known that glycerol is released from the adipose tissue as the product of lipolysis, and lipolysis rate is stimulated by catecholamines, which inhibit the leptin synthesis. Nevertheless, plasma glycerol concentration was only described as a useful indicator of the lipolysis rate in the case of high-intensity exercise (Pösö et al., Reference Pösö, Viljanen-Tarifa, Soveri and Oksanen1989). Glycerol released during low- and medium-intensity exercises can be absorbed and metabolized by the liver (Kędzierski and Bergero, Reference Kędzierski and Bergero2006). In the case of horses from groups D and H, plasma glycerol concentration determined immediately after exercising only reflected the balance between the lipolysis rate in the adipose tissue and the absorption of the liver. The author supposes the lipolysis rate in the horses from groups D and H was higher than indicated by the achieved values of the plasma glycerol concentration only. This is particularly true because the increase in plasma FFA in those groups was significant. Moreover, the possible influence of TG and glycerol on plasma leptin release from the adipose tissue is unknown and the role of FFA in the regulation of the leptin level is not clear (Cammisotto et al., Reference Cammisotto, Gélinas, Deshaies and Bukowiecki2003). In other studies, the reported connections between plasma leptin and lipid concentrations are more likely to be the effect of the existing energy status of the examined horses (Frank et al., Reference Frank, Elliott, Brandt and Keisler2006; Pleasant et al., Reference Pleasant, Suagee, Thatcher, Elvinger and Geor2013; Suagee et al., Reference Suagee, Corl, Crisman, Pleasant, Thatcher and Geor2013).
In conclusion, the increase in plasma leptin concentration in exercised horses was related to the increased plasma cortisol concentration and took place only during long-lasting, low-intensity exercise. Short-term, intensive effort or aerobic and technical exercise did not influence leptin release in horses.