I. INTRODUCTION
Phased array antennas have become essential for many emerging millimeter-wave/sub-THz applications, such as wireless high-definition video streaming, satellite communications, 5 G mobile communications, imaging, and sensing. Phased arrays commonly consist of four discrete building blocks: the active elements, RF manifold (feed network), phase shifters, and antennas. Low-cost compact integrated phase shifters with low-insertion loss and low-power consumption are highly desirable for the aforementioned applications. In addition, minimal insertion loss variation for the full range of phase shift over a wide-frequency band is a crucial requirement.
Various types of microwave phase shifters have been developed for a wide range of applications [Reference Li and Chang1, Reference Erker2]. Some practical issues such as the insertion loss characteristics and bandwidth have not yet been fully resolved for phase shifters especially in the millimeter-wave/sub-THz frequency range [Reference Franc, Karabey, Rehder, Pistono, Jakoby and Ferrari3, Reference Jing4]. The design of phase shifters (as well as all other passive and active components) in the millimeter-wave/sub-THz band requires careful consideration of two main factors. The first factor is reducing the fabrication process cost and complexity. The second is minimizing the power loss in the guiding structure. High resistivity silicon (HRS) dielectric waveguide satisfies the aforementioned requirements [Reference Abdellatif, Basha and Safavi-Naeini5, Reference Zandieh, Abdellatif, Taeb and Safavi-Naeini6]. In addition, it can form a fully homogeneous low-cost/low-loss platform suitable for millimeter-wave/sub-THz antenna system that can be easily integrated with active devices in this range of frequencies [Reference Biglarbegian, Basha, Taeb, Gigoyan and Safavi-Naeini7].
In this work, a new phase-shifting structure based on HRS dielectric image waveguide is presented. The proposed structure changes the phase shift of the propagating mode by varying the image guide propagation constant using a high-dielectric constant slab of barium lanthanide tetratitanates (BLT) ceramic made of BaO–Ln2O3–TiO2 (where Ln = La, Ce, Pr, Nd, Sm, or Eu). BLT compositions are well known as commercial dielectrics for RF applications due to high permittivity (ε r can go up to 170), low-temperature coefficient, and low-dielectric losses over a wide range of temperatures and frequencies [Reference Nenashevaa and Kartenko8]. The used BLT samples have accurate measured dielectric constants with ±0.3% tolerance. The high-dielectric constant leads to a significant size reduction, which is highly desirable in many practical applications. A microwave phase-shifting structure based on a BLT ceramic loaded coplanar waveguide (CPW) line is presented in [Reference Abdellatif, Ranjkesh, Fahimnia, Taeb, Gigoyan and Safavi-Naeini9]. However, the CPW-based phase shifter is not practical in the millimeter-wave/sub-THz range due to the loss and the fabrication limitations; therefore, here we present a new phase shifter concept based on HRS image guide.
II. DESIGN
As shown in Fig. 1, the proposed concept uses a dielectric image guide based on an HRS (>2 kΩ cm) substrate. The propagation constant of the dielectric image waveguide is perturbed by placing a high-dielectric constant BLT material on top of it at a small distance (few microns). A large variation of the phase shift is obtained by changing the air gap. To prove the concept, phase shifters with different types of BLT materials with dielectric constants up to ε r = 165 have been simulated, fabricated and successfully tested. The resulting tunable phase shifter has minimal insertion loss variation over the full range of phase shift.
The proposed HRS image guide phase shifter test structure.

The design procedure of this phase shifter test structure is summarized in the following steps:
A. Step 1: Design of HRS image guide at W-band
The HRS rectangular cross-section dielectric image guide is designed to ensure single-mode operation E y11 across the W-band (75 to 110 GHz). For the particular design example reported in this work, the image guide has a width of 700 µm and a height of 500 µm. The total length of the waveguide is 10 mm. A cross-section of the image guide showing the E-field distribution at 100 GHz is depicted in Fig. 2.
Cross-section in the image guide shows the E-field magnitude distribution at 100 GHz.
B) Step 2: Design of HRS image guide to WR10 metallic waveguide transition
The metallic waveguide WR10 is the standard input/output port of the W-band Agilent PNAX extender OML head. Therefore, to test the proposed phase shifter, a transition from HRS image guide to WR10 waveguide ports has been designed. A HRS dielectric linear tapered section is added to the rectangular image waveguide. The tapered transition is a simple technique used to match the dominant mode of the dielectric waveguide to that of the metallic one [Reference Basu and Itoh10]. The total length of the matching section (5.7 mm) has been chosen to provide a low-reflection transition. Figure 3 shows the S-parameters results for the simulation that includes the image guide, the transition and the metallic waveguide. The ripples in S 11 are due to small mismatches at both ends (Fabry–Perot resonances). Fig. 4 shows the three-dimensional (3D) of model in high frequency structural simulator (HFSS) for the whole test structure along with E-field distribution at 100 GHz.
Simulated S 21 and S 11 magnitudes versus frequency.
(a) HFSS model of the whole-test structure, (b) E-field distribution at 100 GHz.
Although the transition plays important role in testing the phase shifter, it is not a part of the phase shifter itself. For example, the phase shifter can be part of homogeneous image guide-based phased array antenna system or integrated directly to flip-chip-based active components through image guide to CPW transition [Reference Biglarbegian, Basha, Taeb, Gigoyan and Safavi-Naeini7] without the tapered transition. Hence, the phase shifter actual size should not include the tapered transition length.
C) Step 3: High-dielectric constant slab design and air gap calculation
The effect of the high-dielectric constant slab top loading on the image guide dominant mode propagation with a small air gap in between has been studied by simulations. Different dielectric materials with different lengths have been fixed at different distances from the image guide. An example is given here for a BLT sample with a relative permittivity of 165 and a length of 5 mm. When the spacing between the BLT slab and the image guide is 5 µm, the S 21 magnitude and phase are −2 dB and 113°, respectively and the field distribution is given by Fig. 5. When we increase the air gap by 20 µm the S 21 magnitude and phase change to −1.97 dB and −157°, respectively and the field distribution is given by Fig. 6. The difference in phase between the two cases is almost 90° and this can be visually checked in Figs 5 and 6.
E-field distribution at 100 GHz longitudinal cut at air gap = 5 µm.
E-field distribution at 100 GHz longitudinal cut at air gap = 25 µm.
In our case, we used a BLT slab with a thickness of 250 µm and width of 2 mm. However, the width and thickness of the BLT slab (as long as it is much larger than the air gap) does not have any appreciable effect on the performance. Three different high-dielectric constant slabs (samples) have been studied for the proposed phase shifter application. Figure 7 shows a comparison between the three samples at 100 GHz. The first sample has a dielectric constant of 42 and a length of 5 mm. Sample 2 has a dielectric constant of 80 and a length of 3 mm. Sample 3 has a dielectric constant of 165 and a length of 5 mm.
Phase-shift variation versus air gap at 100 GHz for the studied samples.
III. FABRICATION PROCESS
A) Optical lithography and dry etching
First fabrication method is a single-mask fabrication process with standard steps and recipes. This method has low production cost and a high level of reproducibility. The chosen substrate wafer is double-side polished and has an orientation of [1 0 0] with a diameter and thickness of 4 inch and 500 µm, respectively. The process steps can be summarized as shown in Fig. 8. In Step (a), the HRS wafer is cleaned in RCA solution. In Step (b), an aluminum layer with thickness of 0.5 µm is sputtered on each side of the silicon substrate. Then [Step (c)] the wafer is coated with a thin layer of photo resist (Shibly 1811) with a thickness of ~1.3 µm on one side (above the aluminum layer).
Optical lithography fabrication process for the proposed structure.
In Step (d), an optical lithography with a 5 inch Chrome mask (5 µm resolution) is performed. Then [Step (e)] the aluminum is patterned using the wet-etching process. In Step (f), deep reactive-ion-etching (DRIE) [Reference Marty11] (Standard Bosch process) is performed for the thickness of 500 µm (a carrier wafer is used during the through wafer etching). Then [Step (g)] the aluminum hard mask is stripped with the aluminum wet etchant again.
One of the main advantages of this technique is its high-dimensional accuracy obtained from the photolithography and DRIE processes. With photolithography, depending on the quality of the Chrome mask, very small tolerances up to ±0.3 µm are realizable. The DRIE process is able to provide almost vertical sidewalls with a very small roughness.
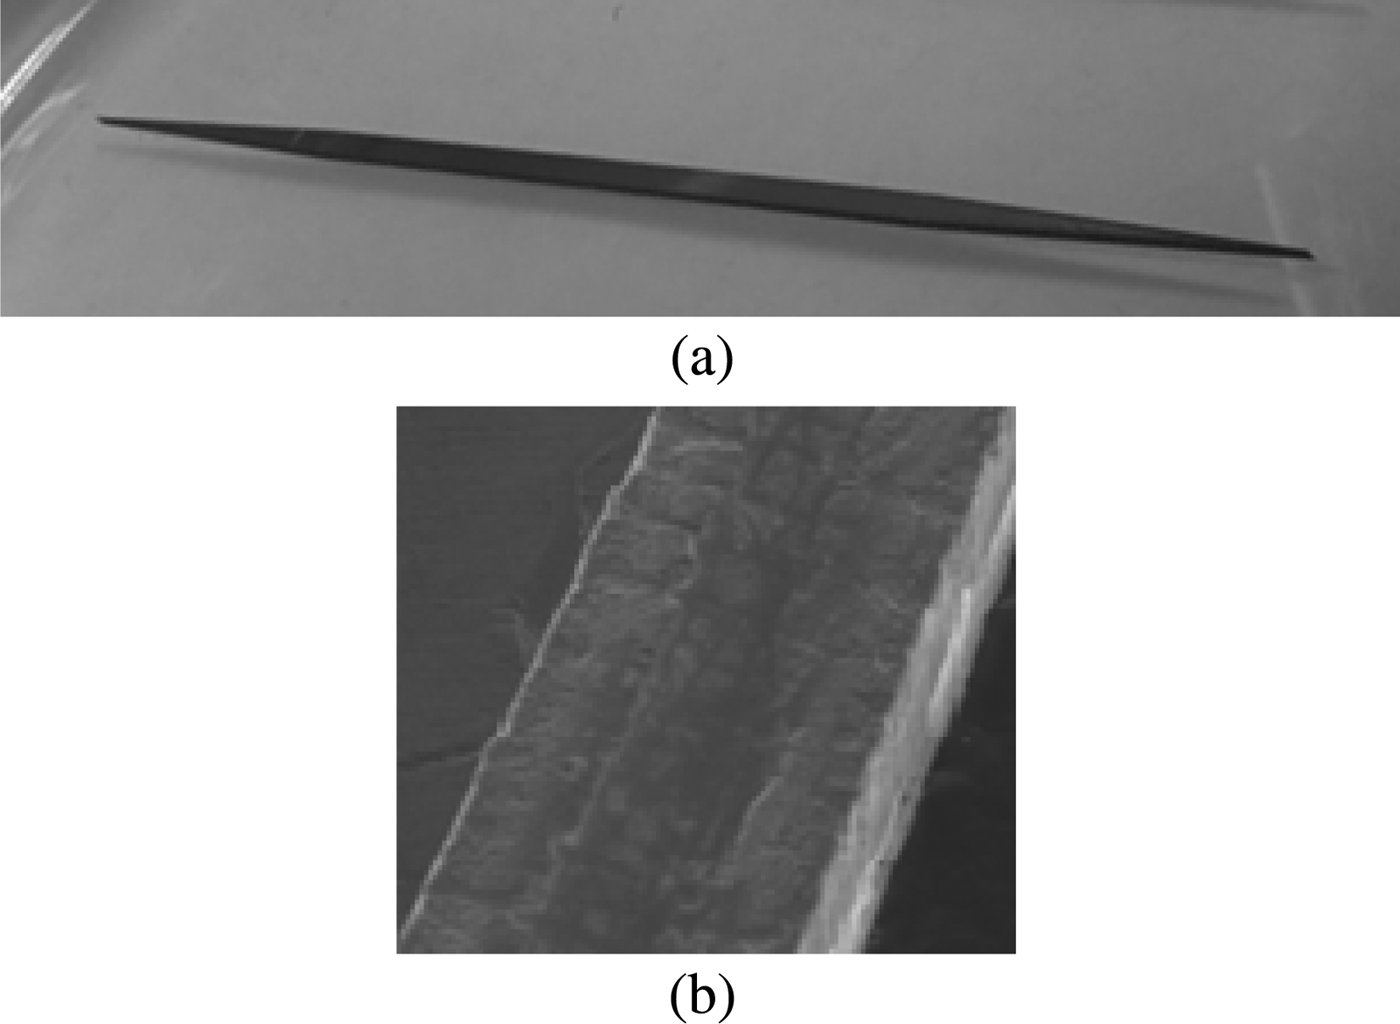
Figure 9 shows the picture and scanning electron microscopy (SEM) scans of the fabricated waveguide sample. HFSS simulations show that the effect of roughness on the propagation constant of the waveguide is negligible. The measured width of the fabricated waveguide is 700 ± 2 µm.
Fabricated sample: (a) picture of the waveguide, (b) SEM scan of the waveguide.
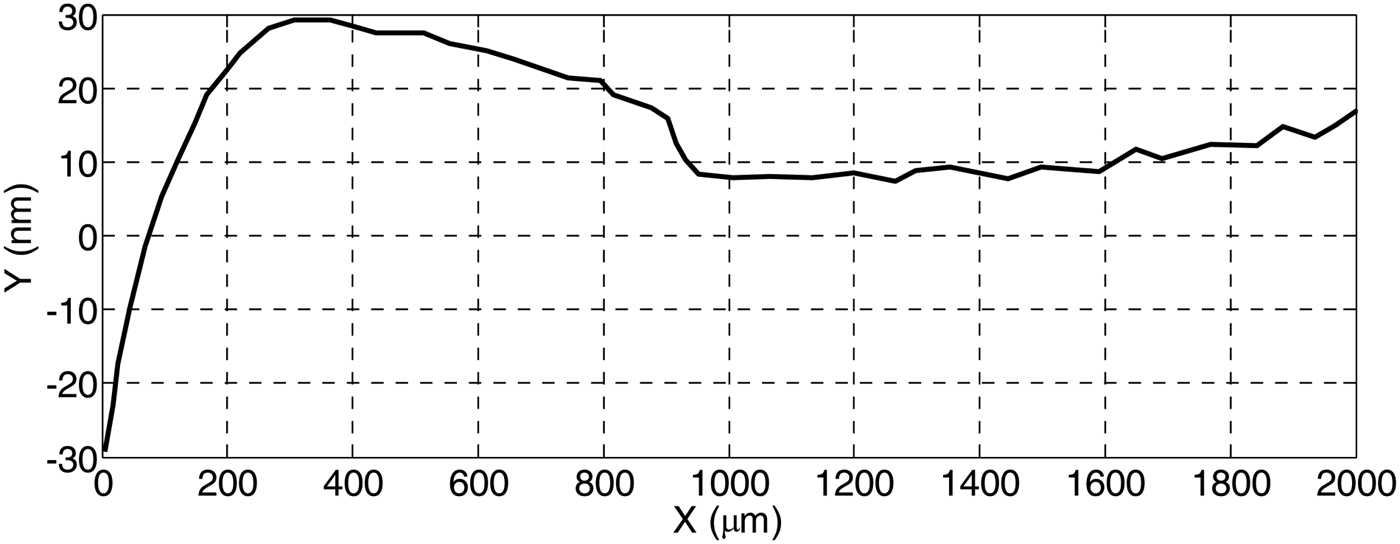
The roughness of the silicon surface was measured by a profiler. The standard deviation value of the surface roughness is 13 nm (see Fig. 10).
Silicon surface roughness profile.
B) Laser micro-machining
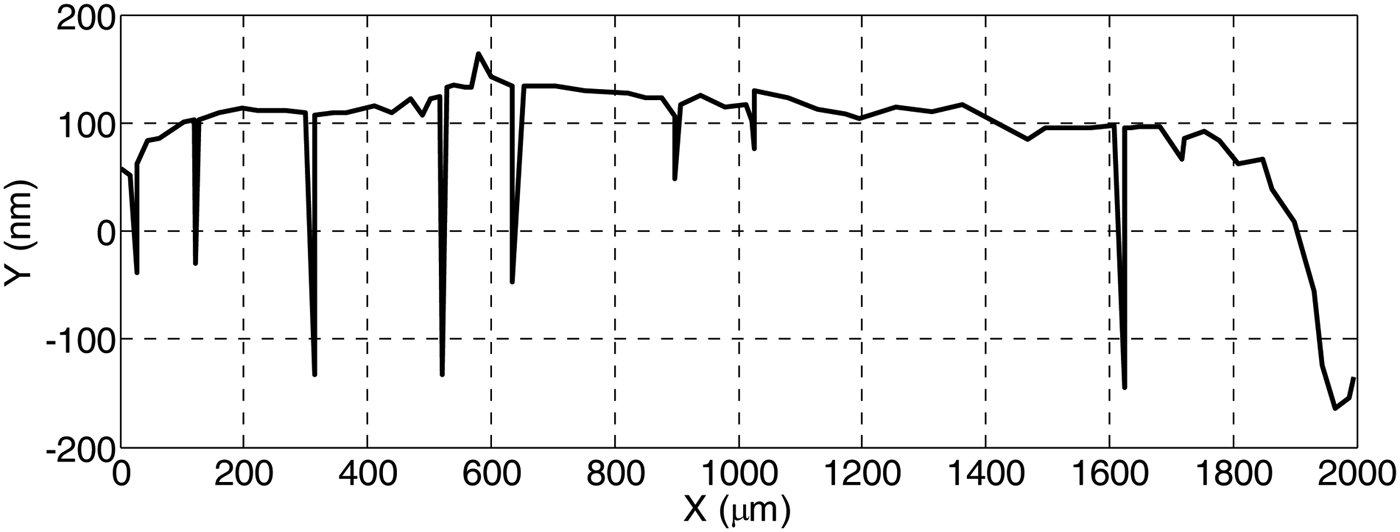
The second fabrication method is based on laser machining. Laser machining is an accurate, chemical-free, and fast process (no mask preparation is needed), which can be used as an alternative solution to etching technique in many emerging applications. The laser machine, which is used for cutting the BLT samples, is the ProtoLaser U3 UV system from LPKF. The laser wavelength is 355 nm. Since the 200-μm-thick BLT material is very fragile, it can be easily broken with excessive laser power. Therefore all the laser parameters are optimized to achieve a clean edge cut without cracking the sample. Figure 11 shows the surface roughness of the BLT slab after polishing. The standard deviation value of the surface roughness is 79 nm.
BLT slab surface roughness profile after polishing.
As can be seen from the graph, the BLT slab has (as well as many of ceramic-based material) some surface cracks. Since the width of these discontinuities in the order of few microns, the effect is negligible on the dielectric constant over the frequency range of interest in this paper. This has been verified with the good agreement between simulations (where the BLT slab model does not have these sharp discontinuities) and measurements as will be shown later.
IV. MEASUREMENT RESULTS
In this section, we present the complete test setup and measurement results, using a micro-positioner with a probe end attached to the topside BLT sample. The attachment is done using a 10 µm drop of silver paste. The paste has insignificant effect on the operation as the E-field is highly concentrated inside the air-gap region (under the BLT slab). The measurement is performed using Agilent PNAX connected to OML millimeter-wave WR10 extenders. The micro-positioner setup is used to move the BLT slab up and down and vary the air gap with micron accuracy. The measurement setup along with the test structure is shown in Fig. 12. The surface roughness limits the minimum air gap between the HRS image guide and the BLT slab. The calibration and initial measurement are done for the HRS image guide in the absence of BLT slab and the results are shown in Fig. 13.
(a) Picture of the experimental setup, (b) schematic of the micro-positioner setup.
Measured and simulated magnitudes of S 11 and S 21 versus frequency for the image guide in the absence of the BLT slab.
The measurement results presented in this section are obtained for the following three different high-dielectric constant slab samples:
A) Sample 1
The high-dielectric constant slab for Sample 1 has a dielectric constant of 42 and a length of 5 mm. Figure 14 shows the S 21 and S 11 magnitudes variation versus frequency for different air gaps. The S 21 relative phase variation versus frequency is shown in Fig. 15. In all the following graphs, each micro-positioner step is considered 10 µm.
Measured S 21 and S 11 magnitude variation versus frequency for different air gaps.
Measured relative phase variation versus frequency for different air gaps.
B) Sample 2
The high-dielectric constant slab for Sample 2 has a dielectric constant of 80 and a length of 3 mm. Figure 16 shows the S 21 and S 11 magnitudes variation versus frequency for different air gaps. The S 21 relative phase variation versus frequency is shown in Fig. 17.
Measured S 21 and S 11 magnitude variation versus frequency for different air gaps.
Measured relative phase variation versus frequency for different air gaps.
C) Sample 3
The high-dielectric constant slab for Sample 3 has a dielectric constant of 165 and a length of 5 mm. Figure 18 shows the S 21 and S 11 magnitudes variation versus frequency for different air gaps. The S 21 relative phase variation versus frequency is shown in Fig. 19. The main phase change occurs in the first two steps (20 µm), which are suitable for practical application.
Measured S 21 and S 11 magnitude variation versus frequency for different air gaps.
Measured relative phase variation versus frequency for different air gaps.
D) Summary of measurements
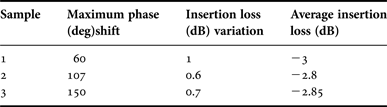
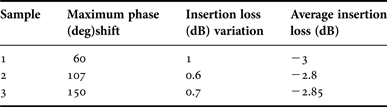
Three different high-dielectric constant slabs have been tested. Summary of the measurements results at 100 GHz for different dielectric samples are shown in Table 1. Figure 20 shows a comparison between the simulations and measurements of the obtained phase shifts for the three tested samples at 100 GHz.
Phase-shift variation simulations (solid line) and measurements (circles) versus air gap at 100 GHz for the studied samples.
Summary of measurements at 100 GHz.
V. CONCLUSION
This paper presents a new high-performance phase shifter for millimeter-wave/sub-THz phased array antenna applications. The proposed phase shifter is a BLT-loaded dielectric image waveguide. In order to prove the concept, three test samples are designed and measured. A phase shift of 150° at 100 GHz with a maximum insertion loss variation of 0.7 dB is obtained, using a device with a length of 5 mm.
To achieve 360° phase shift, either a longer BLT slab or a BLT with higher dielectric constant should be used. Electrically controlled version of the proposed phase shifter is feasible by using a piezoelectric transducer to vary the air gap with micron accuracy.
ACKNOWLEDGEMENTS
This work was supported by the National Science and Engineering Research Council (NSERC) of Canada, Ontario Centres of Excellence (OCE) and C-COM Satellite Systems Inc. The fabrication was conducted at the Quantum NanoFab supported by Canada Foundation for Innovation, Ontario Ministry of Research & Innovation and Industry Canada.
 Ahmed Shehata Abdellatif was born in Giza, Egypt, in 1985. He received the B.Sc. and M.Sc. degrees both in Electronics and Communications Engineering from Cairo University, Giza, Egypt, in 2007 and 2009, respectively. He is currently a Ph.D. candidate in ECE Department at the University of Waterloo, Waterloo, Canada. From April 2009 to December 2009, He has been with NMI (acquired by Atmel in July, 2014). Since 2010, he has been with the Centre for Intelligent Antenna and Radio Systems (CIARS) group, University of Waterloo as a research assistant. His research interests include beam-steering techniques, microwave and millimeter-wave passive components, phased array antenna systems, automotive Radar, and complex environment RF modeling.
Aidin Taeb was born in Tehran, Iran, in 1980. He received the B.Sc. degree in Electrical Engineering from Tabriz University, Tabriz, Iran in 2003, and the M.Sc. degree in Electromagnetic and Antennas from Amirkabir University of Technology (Tehran Polytechnique), Tehran, Iran, in 2006. He then joined Fanamoj Co., Tehran, where he was a Microwave Engineer in designing RF/microwave radio systems. In 2009, he started his Ph.D. program in the Department of Electrical Engineering, University of Waterloo, Waterloo, ON, Canada, as a Ph.D. student. He is also a member of the Centre for Intelligent Antenna and Radio Systems (CIARS) group, University of Waterloo, Waterloo, ON, Canada. He is currently investigating new generation of sub-millimeter-wave and terahertz components. His main interest lies in the area of THz bio-sensors. Other areas in which he has worked are design of satellite antennas, millimeter-wave cancer detector, and millimeter-wave on-chip circuits.
 Nazy Ranjkesh was born in Tehran, Iran in 1981. She received the B.Sc. and M.Sc. degrees in Electrical Engineering, majored in “fields and waves”, from the University of Tehran, Tehran, Iran, in 2003 and 2006, respectively. She is currently a Ph.D. candidate in the Department of Electrical and Computer Engineering at the University of Waterloo, Waterloo, Canada. She is a member of Centre for Intelligent Antenna and Radio Systems (CIARS) group, University of Waterloo, Waterloo, Canada. Her research interests include THz integrated circuits design, fabrication, and technology, novel waveguide structures for the realization of high Q-factor passive components, electromagnetic wave theory, and numerical methods in electromagnetics.
 Suren Gigoyan received his M.S. degree from Physics Department, Yerevan State University, Armenia, in 1980, and Ph.D. degree in Electrical Engineering from the Institute Electrical Engineering in Moscow, in 1991. During 2005–2006, he was a visiting Fulbright scholar at the University of Tennessee. He is currently a visitor scientist at the Microwave and Photonics Integrated System Lab University of Waterloo, Canada. Current Research Interests: Millimeter and THz spectroscopy, Sub-MM frequency range devices and systems design, Applications of MEMS structures in THz spectroscopy, Sensing, Cancer and DNA Detection. He has published more than 60 peer-reviewed journal and conference papers.
Elizaveta Nenasheva graduated from Electro Technical University, St. Petersburg, Russia with MS in Physics in 1974 and Ph.D. degree in Physics in 1981. She is a chief of the Department of Microwave Ceramics in Giricond Research Institute of St. Petersburg and she is a recognized expert in the physics and designing of low loss microwave ceramics and ferroelectrics. Dr. Nenasheva has published more than 120 papers and has been granted with 49 national and world patents in the field of microwave ceramic compositions and ferroelectric technology development. In 2006–2007 and 2010 Dr. Nenasheva was a Visiting Professor of HEP Division of ANL and took part in researches of more than 10 grants of Department of Energy of USA.
Safieddin Safavi-Naeini (M'79) received the B.Sc. degree in E.E. from the University of Tehran, Tehran, Iran, 1974 and the M.Sc. and Ph.D. degrees in E.E. from the University of Illinois at Champaign-Urbana, in 1975 and 1979, respectively. He was a faculty member of the School of Engineering, University of Tehran, from 1980 to 1995. He joined the University of Waterloo, Waterloo, ON, Canada, in 1996, where he is now a Professor in the Department of Electrical and Computer Engineering, the holder of the NSERC-BlackBerry Industrial Research Chair in Intelligent Radio and Novel EM Media, and is also the Director of the Centre for Intelligent Antenna and Radio System (CIARS).