1. Introduction
Since 2015, the United Nations (UN) has promoted the production of electric vehicles (EVs) to combat climate change and drive sustainable development, as part of its 2030 Agenda [1]. This agenda includes goals to ensure universal access to sustainable energy (Goal 7) and to develop resilient and sustainable infrastructure (Goal 9). EVs are crucial for reducing reliance on fossil fuels and fostering the use of renewable energy. They also help modernize transportation, reduce emissions, and spur innovation in clean technology. According to the 2021EU Transport and Environment Report [2], EV sales tripled in 2020, though this increase varied greatly across EU nations, correlating with their economic wealth.
The global demand for EVs has significantly increased lithium-ion battery (LIBs) production, leading the electrochemical energy storage market [Reference Wu, Kaden and Dröder3, 4]. The production of LIBs is an energy-intensive process, involving mining, material processing, and assembly, largely powered by fossil fuels, especially coal in China [Reference Gaines and Dunn5, 6]. In 2022, Australia produced nearly 47% of the world’s lithium, with Chile at 30%, and along with Argentina and China, these countries accounted for over 96% of production and held about 78% of global reserves [7, 8]. The concentration of lithium reserves in few countries necessitates securing raw material supply chains, especially during trade disputes or conflicts. Additionally, Australia faces environmental challenges from the improper disposal of lithium-ion batteries, posing risks of soil and groundwater contamination and fire hazards, leading to significant economic and environmental costs [Reference Zhao, Ruether, Bhatt and Staines9].
Recycling lithium-ion batteries minimizes environmental impact by recovering valuable metals, decreasing mining activities and preventing landfills contamination risks. This energy-efficient process leads to lower greenhouse gas emissions, promoting a more sustainable and circular economy for battery materials [Reference Sambamurthy, Raghuvanshi and Sangwan10].
For this reason, the 2006/66/EC directive of the European Parliament [11] sets safety and waste management guidelines for end-of-life batteries, promoting specialized recycling systems for LIBs to safely recover valuable materials. Recycling these batteries for second life uses, such as grid storage, offers economic advantages, with projections suggesting that by 2050, repurposed EV batteries could significantly reduce the need for new grid storage solutions in the UK. This approach also reduces production costs, preserves resources, and enhances the sustainability of the battery and EV industries [Reference Hill, Raugei, Pons, Vasileiadis, Ong and Casullo12, Reference Breiter, Linder, Schuldt, Siccardo and Vekić13].
Battery recycling is conducted through pyrometallurgy [Reference Wu, Kaden and Dröder3], hydrometallurgy [Reference Makuza, Tian, Guo, Chattopadhyay and Yu14], and manual disassembly [Reference Bae and Kim15, Reference Lain, Brandon and Kendrick16], each of these methods has distinct environmental impacts and safety risks, including exposure to hazardous materials and high voltage. In particular, disassembly is predominantly carried out manually by humans [Reference Breiter, Linder, Schuldt, Siccardo and Vekić13], and it presents inherent hazards to human health and safety such as high voltage and thermal runaway [17].
For this reason, robots are increasingly being considered for the automated or semi-automated disassembly. Given the scale and variability of the recycling tasks, however, a fully automated line is rarely possible or convenient. Therefore, collaboration between robots and humans on shared tasks is critical to improve these industrial operations [Reference Quattrucci, Ceccarelli, Santoro, Russo, Quaglia, Boschetti and Carbone18, Reference Galin, Meshcheryakov, Kamesheva and Ronzhin19]. To distribute tasks between human operators and robots, several parameters have been proposed in the literature, such as cost [Reference Ceccarelli20–22], base time [Reference Kroll and Hanft23], consistency score [Reference Saha, Mukherjee, Das and Hoseini24–Reference Lee and Weng25], injury risk [26–32], and accessibility [Reference Desai and Mital33–35].
Among these works, the method proposed in ref. [Reference Ranz, Hummel and Sihn36] aims to optimize work and productivity according to the capabilities and limitations of both humans and robots. The criteria used for the comparison are process time, quality, and additional investments such as costs, time, workspace, and maintenance. This work includes safety factors such as the injury risk and the accessibility, but at the same time evaluates the process efficiency. Papers [Reference Bänziger, Kunz and Wegener37–Reference Kheirabadi, Keivanpour, Chinniah and Frayret38] propose an approach to optimize human–robot task allocation in hybrid manufacturing environments, particularly in automotive. These approaches consider parameters like workspace layout, task times, and ergonomic impacts simulating dynamic human–robot interaction and movement. Results demonstrate the procedure’s ability to improve task distribution efficiency and ergonomics. However, this paper does not consider the cooperation between humans and robots and only focuses on the allocation of a specific task. The work in ref. [Reference Malik and Bilberg39] proposes a methodology for distributing tasks between humans and robots in assembly operations based on the geometrical complexity of the component, workspace, and process characteristics. Financial aspects, however, are not considered for the evaluation of the task distribution. Overall, these methods show how task distribution has been analyzed for specific case studies, usually focused on a single task and/or engineering parameters only.
This paper aims to expand previous work with a more general criterion for human–robot task distribution. The new metrics are then demonstrated by utilizing a UR10 collaborative robot [Reference Robots40] for an experimental disassembly task, involving the loosening and tightening of a bolt first performed by the UR10 and then by a human operator. Experimental data are then compared using the ANOVA statistical method [Reference Ståhle and Wold41] to evaluate the variation of the results during the different cycles in terms of human and robot screwdriving. Finally, a novel Q index is obtained to evaluate whether a robot or a human is more suitable for the screwdriving task.
By encouraging the adoption of automated and semi-automated lines in a field where operation is still mostly manual, this work aims at improving battery recycling uptake by improving both human safety and industrial efficiency. However, the proposed Q index can easily be applied in other industrial fields where robot and human operators cooperate.
2. Material and methods
2.1. Requirements for electric vehicle battery disassembly
As a result of climate change and related climate policies, the number of EVs on European roads is currently rising (Figure 1), with expectations for continued growth in the long term. According to a McKinsey analysis [Reference Fleischmann, Hanicke, Horetsky, Ibrahim, Jautelat, Linder, Schaufuss, Torscht and van de Rijt42], the demand for lithium-ion batteries is projected to increase at an annual growth rate of approximately 27%, reaching an estimated 4,700 GWh by 2030 as shown in Figure 2.
An example of electric vehicle battery pack [45].

Example of force values during three working days of 200 cycles each.

This increasing demand and production of lithium-ion batteries has led to a rise in the number of end-of-life batteries, which contain valuable materials like lithium and copper, making their recycling both economically and environmentally advantageous [43]. This paper focuses on the disassembly stage of the recycling process. Dismantling lithium-ion battery systems used in automotive applications remains a complex, costly, and time-consuming process due to design variations, flexible components, and the risks associated with high voltage and chemicals [Reference Wegener, Andrew, Raatz, Dröder and Herrmann44].
Disassembling EV batteries presents significant challenges due to design diversity, safety risks, process complexity, and cost implications. The lack of standardized battery designs complicates robotic automation, requiring customized approaches for different structures, increasing costs and engineering efforts.
Manual disassembly remains prevalent due to the versatility required, but potential hazards like electrical shocks and hazardous materials lead to raise labor costs.
Disassembly process involves handling mechanical, electronic, and chemical components in restricted spaces, making automation difficult and expensive to implement. Additionally, the variability in end-of-life battery conditions – ranging from intact to heavily damaged – introduces uncertainty, necessitating flexible and adaptable disassembly methods. The cost of automation, training skilled labor, and ensuring safety measures further adds to the economic burden, making efficient and cost-effective battery disassembly a major challenge in the recycling industry [Reference Zang and Wang46]. Consequently, distributing tasks between robots and humans is well-suited for improving the disassembly process.
2.2. A new methodology for task distribution
For disassembly tasks, key requirements include safety, productivity, and logistical factors, such as ensuring access to specific areas of the battery system and minimizing the time required for each task. These factors are critical for optimizing the overall disassembly process, with logistics and safety being prioritized over conventional robot performance metrics [Reference Robots47–Reference Russo, Zhang, Liu and Xie48]. Critical factors from Quattrucci et al. [Reference Quattrucci, Ceccarelli, Santoro, Russo, Quaglia, Boschetti and Carbone18] are here adapted to formulate an objective function for human–robot task distribution. The selected factors are the following ones:
-
• Cost. The total cost a
 $C_{R}$
for a robotic system can be obtained considering the following items [Reference Ceccarelli20, 21]:
-
• Cost of the robotic system (S): it includes the cost of the robot, all the tools and equipment needs to obtain a specific task;
-
• Cost of installation (I): this refers to the infrastructure needed for the robotic cell, including the power supply, production linkages and safety systems;
-
• Cost of the design (B): this may involve the development of new production strategies and the redesign of the entire production process and equipment;
-
• Cost of the robot activity (A): which includes the cost of energy consumption, material usage, and maintenance costs;
-
• Cost of temporary change activity (T): it consists of the change of activity, which includes programmed or non-programmed stops in case of renewing/modifying the production process;
-
• Return of the investment: an economic evaluation based on specific parameters of the industrial application such as the previously mentioned parameters S and I, tax deductions promoting industrial growth (F), human wage cost per hour (L), cost of material changes in manufacturing (M), yearly depreciation costs of the robot (D), operational and maintenance cost, robot working hours (H):
(1)
\begin{equation}{\rm ROI}=\frac{kH\left(L+M-R\right)-D}{P-F}\end{equation}
(2)
\begin{equation}C_{R}=S+I+B+A+T-{\rm ROI}\end{equation}
For a human operator performing the same task, the cost
$C_{o}$
includes wages (
$W$
), social contributions and taxes (
$S$
), training (
$T$
), and insurance (
$I$
) [22]:(3)
\begin{equation}C_{o}=W+S+T+I\end{equation}
These costs are calculated over one year of operation. A one-year period provides a complete cycle of most business operations, including seasonal fluctuations that may affect labor and production. In addition, it aligns with standard accounting practices for depreciating capital investments and amortizing costs.
The cost ratio (
$C$
) between the manual and automated operation is(4)
\begin{equation}C=\frac{C_{O}}{C_{R}}\end{equation}
-
-
• Task duration measures the time required to complete a task [Reference Kroll and Hanft23]; with a base time score T used to compare how inherently easy it is for a robot versus an operator to perform the task.
(5)where
\begin{equation}T=\frac{T_{R}}{T_{O}}\end{equation}
$T_{R}$
[s] is the robot base time and
$T_{O}$
[s] is the operator base time considering the mean value of the task duration of a large sample of repetitions.
-
• Consistency ratio. measures the consistency of task duration [Reference Saha, Mukherjee, Das and Hoseini24]. When an activity is performed so consistently that the time required remains nearly identical in each iteration, the parameter approaches zero. The consistency ratio
$R$
is calculated by comparing the variability in task completion times, specifically as the ratio between the standard deviation of the times for the operator (
$\sigma _{O}$
) and the robot (
$\sigma _{R}$
).(6)
\begin{equation}R=\frac{\sigma _{R}}{\sigma _{O}}\end{equation}
For humans, this consistency ratio is also intended as a measure of operator fatigue, as we expect a decreasing performance over many consecutive repetitions [Reference Lee and Weng25].
-
• Injury risk. Hazards are identified and classified based on their potential consequences and likelihood [26–Reference Ispășoiu, Milosan, Gabor and Oancea29], allowing for the categorization of industrial accidents into types such as falls, impacts, and collisions [Reference Jeong, Park, Son and Mok30]. The severity of a hazard
$S$
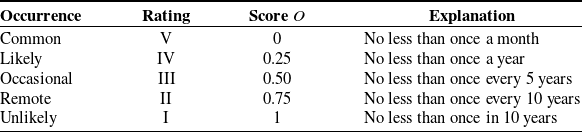
is determined using a four-level classification according to MIL STD 882B [31] and EN 50129:2019 [32] guidelines, as outlined in Table I. The frequency of injuries due to hazards, known as occurrence
$O$
, is based on the risk factors involved in the process, as detailed in Table II. Injury risk can be expressed as(7)The weights
\begin{equation}I=S\cdot w_{S}+O\cdot w_{O}\end{equation}
$w_{S}$
and
$w_{O}$
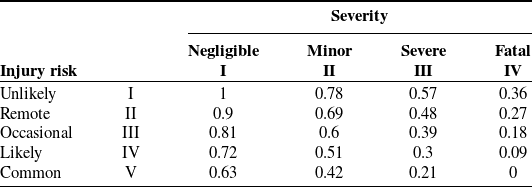
are adjusted to give greater emphasis to severity over occurrence. In this study, a weight of 0.7 is assigned to severity and 0.3 to occurrence, shaping the Injury Risk Matrix shown in Table III. For tasks with a score of 0.075 or lower, appropriate measures are taken to eliminate risk factors. When scores fall between 0.81 and 0.42, the injury risk is considered moderate, requiring efforts to reduce risk. If the score reaches 0.5 or lower, immediate action is necessary.
-
• Accessibility parameter
$A$
is influenced by the object’s geometry and its surrounding environment [Reference Desai and Mital33–Reference Peng and Chung34]. A more complex geometry results in a higher score, ranging from 0 to 1. If
$A$
exceeds 0.5, robotic intervention is recommended to avoid potential health and safety risks for the operator, as noted by the Health and Safety Executive (HSE) [35]. The parameter
$A$
is calculated as(8)In this context,
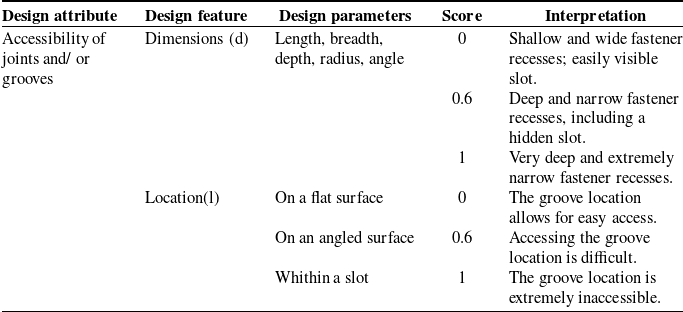
\begin{equation}A=\frac{1}{2}(d+l)\end{equation}
$d$
represents a dimensional factor, while
$l$
refers to a location factor. The criteria for assigning values to these variables are outlined in Table IV [Reference Desai and Mital33].


Criteria of severity, adapted from the definition in [Reference Jeong, Park, Son and Mok30].

Criteria of occurrence, adapted from the definition in [Reference Jeong, Park, Son and Mok30].

Matrix of injury risk [Reference Jeong, Park, Son and Mok30].

Scoring system for evaluating a numerical analysis of accessibility [Reference Desai and Mital33].

Once all these scores are defined as Eqs. (4)–(8), it is possible to calculate a value of an objective function
 $Q$
to define task distribution as
 \begin{equation}Q=w_{C}C+w_{T}T+w_{R}R+w_{I}I+w_{A}A\end{equation}
The assignment of weights
 $w$
is determined by the relative importance assigned to each parameter in comparison to others, according to the user’s discretion based on personal judgment and necessities, considering how important all parameters showed in this paragraph are for the specific task. For a systematic approach to weight selection, please refer to previous work on the topic, such as the methodology described in ref. [Reference Diakoulaki, Mavrotas and Papayannakis49]. The objective function
 $Q$
measures the suitability of using a robot instead of an operator, ranging from 0 to 1. If
 $Q$
≤ 0.5, it is considered advantageous to employ a robot for the specific task. Additional parameters and corresponding weights can be added to Eq. (9).
2.3. ANOVA analysis for performance comparison
In industrial applications, it is essential to quantify the performance of both robots and human operators by evaluating the consistency with which specific tasks are performed over the course of a workday. For this purpose, we here propose a statistical analysis through ANOVA, with an example application to the behavior of the UR10 robot [Reference Robots40] performing the proposed screw removal task over three consecutive working days. The robot repeated the same task, unscrewing and screwing a bolt, 200 times each day, simulating 6 hours of continuous operation (maximum period for human supervision), and producing the data shown in Figure 2. As reported in the figure, the force applied by the robot exhibits significant variations over time, caused by internal factors like robot vibrations and motor heating and external factors such as worktable vibrations.
To quantify significant differences between experiments cycles, an analysis of variance (ANOVA) is applied [Reference Ståhle and Wold41] to evaluate whether observed variations among group means are due to actual differences or simply random variation. ANOVA works by comparing the variance between group means to the variance within groups, using the F-statistic. This F-statistic is calculated as the ratio of the mean square between groups (MSB) to the mean square within groups (MSW):
 \begin{equation}F=\hspace{0pt}\frac{{\rm MSB}}{{\rm MSW}}\end{equation}
where:
-
• MSB is derived from the between-group sum of squares (SSB) divided by its degrees of freedom:
(11)where k is the number of groups and the SSB is calculated as
\begin{equation}{\rm MSB}=\frac{{\rm SSB}}{k-1},\end{equation}
(12)where
\begin{equation}{\rm SSB}=\sum _{j=1}^{k}n_{j}({X_{j}}-X)^{2},\end{equation}
$n_{j}$
is the sample size in group j,
$X_{j}$
is the mean of group j, and
$k$
is the number of groups.
-
• MSW is obtained from the within-group sum of squares (SSW) divided by its degrees of freedom.
(13)where n is the total number of observations, k is the number of groups and the SSB is calculated as
\begin{equation}{\rm MSW}=\frac{{\rm SSW}}{n-k},\end{equation}
(14)
\begin{equation}{\rm SSB}=\sum _{j=1}^{k}\sum _{i=1}^{n_{j}}n_{j}({X_{ij}}-{X_{j}})^{2}\end{equation}


Significance is quantified by comparing the calculated F-statistic to a critical value from the F-distribution table, considering the degrees of freedom. If the F-statistic exceeds the critical value or the p-value is less than the chosen significance level, the null hypothesis (no difference between group means) is rejected, indicating significant differences between groups.
In this work, the ANOVA analysis is used to compare the performance of a robot and a human operator cycle and assess whether differences among groups of data are statistically different. The key performance indicators are selected as common features for robots and human operators. For example, the force value on the Z-axis is selected because it could be measured for both operator and robot, even though the robot could also measure load on the other axes.
The ANOVA approach also helps to determine whether the observed variation in group means is due to actual differences between groups or can be attributed to random variation. This approach is crucial for understanding the deterioration over time and the robustness of the robot and human in maintaining consistent force and time performance.
3. A case study: screw removal
The task considered for the application of the objective function Q [Reference Quattrucci, Ceccarelli, Santoro, Russo, Quaglia, Boschetti and Carbone18] is screw removal in an EV battery. As one of the most common tasks in disassembly, screw removal involves most of the challenges highlighted in this paper. Manipulating components in disassembly generally does not require high precision and, as long as a component can be reached, grasp is generally possible from any position. Conversely, screw removal requires finer manipulation, as the screw, often in an enclosed place, needs to be located and reached with a specific orientation; additionally, a general robotic gripper cannot be used for this task, as a specialized screwdriving tool is needed.
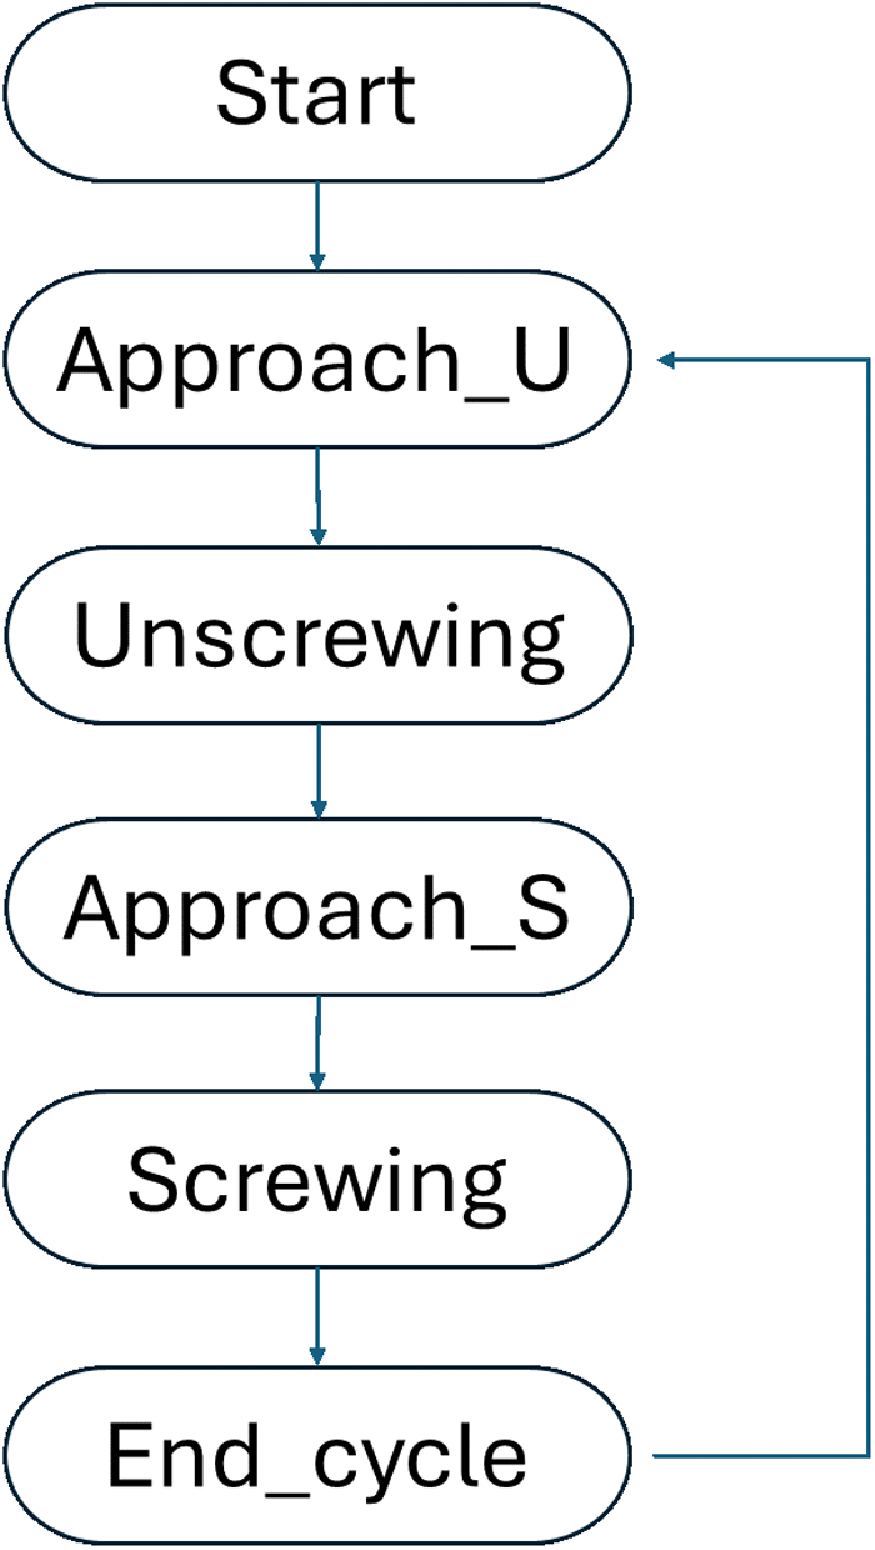
This operation has been divided in four tasks. As illustrated in Figure 3, the robot starts from its home position, distant from the screw, and proceeds to approach the screw through the "approach_U" phase (Figure 4a). Subsequently, it reaches the screw placed inside the box and unscrews it during the "Unscrewing" phase for 5 s (Figure 4b). After the Unscrewing phase is complete, the robot returns to its initial position and then moves toward the screw again through the "approach_S" phase to tighten it back and setup the following cycle (Figure 4c). Once the screw is fully tightened (Figure 4d), the unscrewing cycle is considered complete, and the robot returns to the "approach_U" phase to begin a new cycle as shown in Figure 4e.
Screw removal flowchart.

Screw removal steps: a) approach unscrewing step; b) unscrewing step; c) approach screwing step; d) screwing step; e) end cycle step.

Including both tightening and loosening bolts allows a more comprehensive evaluation of the robotic system’s capabilities. This approach asses the robot’s precision, consistency, and reliability across a broader range of motions, providing a more rounded assessment of its performance.
For this experiment, both the robot and the human operator are required to perform the same steps of unscrewing and screwing the screw to complete a cycle. To obtain a robust dataset, both the robot and the human conducted 50 screw removal cycles continuously. Further cycles were obtained for the robot to better characterize its variance over time. Data were collected on the forces applied by the robot (from the end-effector) and the human, as well as the time taken to complete an entire cycle. The data on cycle times will be used to derive the value of the objective function Q, while the average force trends obtained will allow for a comparison of the consistency in force application between the robot and the human operator.
4. Robot evaluation
4.1. Modeling
A UR10 CB2 robot [Reference Robots40] is used for the experiment. The robot is equipped with internal sensors that measure the internal force of the joint motors and their position. To calculate the force applied by the end-effector on the screw during the unscrewing phases, the following steps are followed. First, the transformation matrix T is derived, considering that the values for α, a, and d (Figure 5) are taken from the universal robot catalog [Reference Russo50];
 $\theta$
i is acquired from the UR10 sensor system.
 \begin{equation}T=\left[\begin{array}{c@{\quad}c@{\quad}c@{\quad}c}\mathrm{cos}(\theta) & -\mathrm{sin}(\theta)\,\mathrm{cos}(\alpha) & \mathrm{sin}(\theta)\,\mathrm{sin}(\alpha) & \mathrm{a}\,{\cos } (\theta)\\ \mathrm{sin}(\theta) & \mathrm{cos}(\theta)\,\mathrm{cos}(\alpha) & -\mathrm{cos}(\theta)\,\mathrm{sin}(\alpha) & \mathrm{a}\,\mathrm{sin}(\theta)\\0 & \mathrm{sin}(\alpha) & \mathrm{cos}(\alpha) & d\\0 & 0 & 0 & 1\\\end{array}\right]\end{equation}
The Denavit–Hartenberg parameters in UR10 [Reference Robots47].

The DH parameters in the transformation matrix of Eq. (15) refer to the geometry in Figure 5.
The Newton–Euler method is applied to calculate the end-effector force. This method calculates the dynamics of each link of the robot combining Newton’s second law (for forces) and Euler’s equation (for torques) [Reference Siciliano, Sciavicco, Villani and Oriolo51]. For calculating end-effector forces, forward recursion and backward recursion are applied [Reference Siciliano, Sciavicco, Villani and Oriolo51] for obtaining angular velocity, angular acceleration, linear velocity, and linear acceleration of the joints, respectively. The forward recursion computes the velocities and accelerations of each link; the angular velocity w[i] is formulated as
 \begin{equation}w[i]=Rw[i-1]+\left[\begin{array}{c} 0\\ 0\\ \dot{\theta }[i]\hspace{0pt} \end{array}\right]\end{equation}
where R is the rotation matrix part of the transformation matrix T. Angular acceleration
 $\dot{w}$
[i] is computed as
 \begin{equation}w[i]=R\dot{w}[i-1]+\left[\begin{array}{c} 0\\ 0\\ \ddot{\theta }[i]\hspace{0pt} \end{array}\right]+w[i-1]\times \left[\begin{array}{c} 0\\ 0\\ \dot{\theta }[i]\hspace{0pt} \end{array}\right]\end{equation}
Linear velocity v[i] is
 \begin{equation}v[i]=R(v[i-1]+w[i-1]\times d[i])\end{equation}
where d is the vector representing the position offset of the joints. Linear acceleration can be obtained as
 \begin{equation}\dot{v}[i]=R(\dot{v}[i-1]+\dot{w}[i-1]\times d[i]+w[i-1]\times (w[i-1]\times d[i]))\end{equation}
The backward recursion thus calculates the forces f[i] for each link as
 \begin{equation}f[i]=m[i](a[i]+\alpha [i]\times r_{c}\hspace{0pt}[i]+w[i]\times (w[i]\times r_{c}\hspace{0pt}[i]))+m[i]g\end{equation}
where m[i] is the mass of the link and
 $r_{c}\hspace{0pt}$
is its center of the mass [Reference Siciliano, Sciavicco, Villani and Oriolo51]. After computing the forces and torques for each link, they are recursively summed from the last link to the base:
 \begin{equation}f_{i-1}=R_{i-1}^{T}\, f_{i}+f_{i-1}\end{equation}
The effective force acting on the screw by the end-effector is obtaining by subtracting the resistive effects of inertia and the gravitational components of the links from the acquired forces. Force data along the robot’s Z-axis was acquired for a more realistic comparison with the force exerted by a human operator on the screw. To maintain full 6-dof mobility in the arm [53], for this reason a prototypal screwdriver is preferred to the wrist torque of the UR10 which can only reach up to a maximum of 1.3 Nm.
4.2. Experimental setup
As seen in Figure 6a, the robot is programmed for screwing and unscrewing a bolt from the box showed in Figure 6b, with a geometry representative of the one of a battery case.
A. Robot setup; b. Box for screw removal.

Robot motion has been preprogrammed with ROS and python2.7, which have been also used to acquire data. The screwdriver shown in Figure 7a, b was a custom prototype developed for the experiment, controlled by an Arduino UNO microcontroller that communicates to ROS through the serial communication library rosserial.
CAD model and prototype of the end-effector.

The screw selected for the experiment is an M8, 6 cm in length, typically requiring a torque of approximately 24 Nm as specified in ISO 898-1 standards [52]. To enable repeated tests, the robot does not fully remove the screw, but only loosens and tightens the bolt 50 times without interruptions. For this reason, the vertical velocity of the robot during the operation can be computed as a function of screwdriver head rotation from the helical pitch of the screw, as
 \begin{equation}v=\frac{n\cdot p\hspace{0pt}}{t},\end{equation}
where n is the number of turns required to fully loosen the screw [32]; p is the thread pitch of the screw (1 mm); and t is the time required to complete the unscrewing task (3 s). The linear velocity calculated and approximated for the experiment is 11 mm/s, and it is used for both the unscrewing and screwing phases. A screwdriver tool using a DC motor [53] is here preferred to directly using the robot final joint to maintain full 6 degree-of-freedom mobility with the robot.
4.3. Results
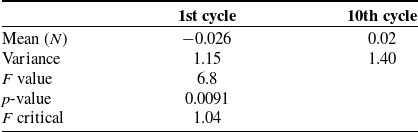
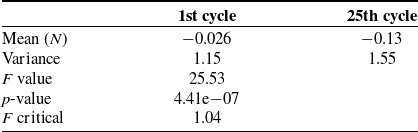
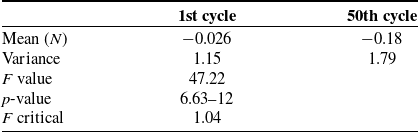
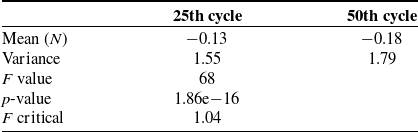
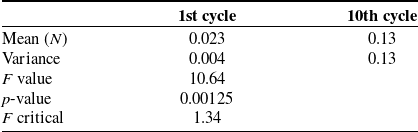
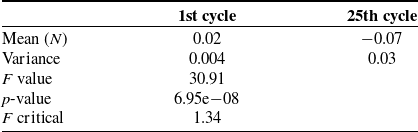
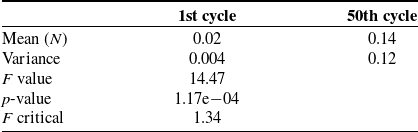
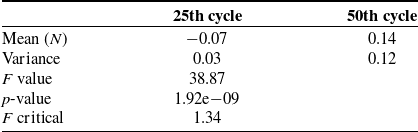
The result shown in Figure 8 depicts the behavior of the z-component of the end-effector force during a cycle. The areas highlighted in purple and yellow correspond to the screw’s reactions during the unscrewing and screwing phases (each lasts approximately 4 s per cycle), respectively. During these two phases, the reactions of the screw to the applied force can be observed. Figure 9, on the other hand, shows the trend of the average force during the various cycles. It can be observed that the forces remain nearly stable, centered around a mean applied force of 3.17 N. The ANOVA method was applied to compare the mean values of the z-component of the end-effector force across different cycles. As shown in Tables V, VI, VII and VIII , the p-values and F-critical indicate a significant difference between the various cycles. This demonstrates that, although the average force remains nearly constant, there is a deterioration over time as the number of cycles increases.
End-effector z-force of the robot during the unscrewing and screwing step.

Force mean value per cycle.

ANOVA for cycle 1 and 10 (robot).

ANOVA for cycle 1 and 25 (robot).

ANOVA for cycle 1 and 50 (robot).

ANOVA for cycle 25 and 50 (robot).

5. Human-robot comparison
5.1. Experimental setup
The screw removal task performed by the human (Figure 10a) closely follows the procedure carried out by the robot. To collect data, a load cell has been placed beneath the box to measure force variations during the task. The load cell [54] is connected to the HX711 [55] signal amplifier, which, in turn, is connected to an Arduino Uno to acquire the load cell data (Figure 10b).
a) Experimental setup for the manual experiment, b) the load cell sensing system.

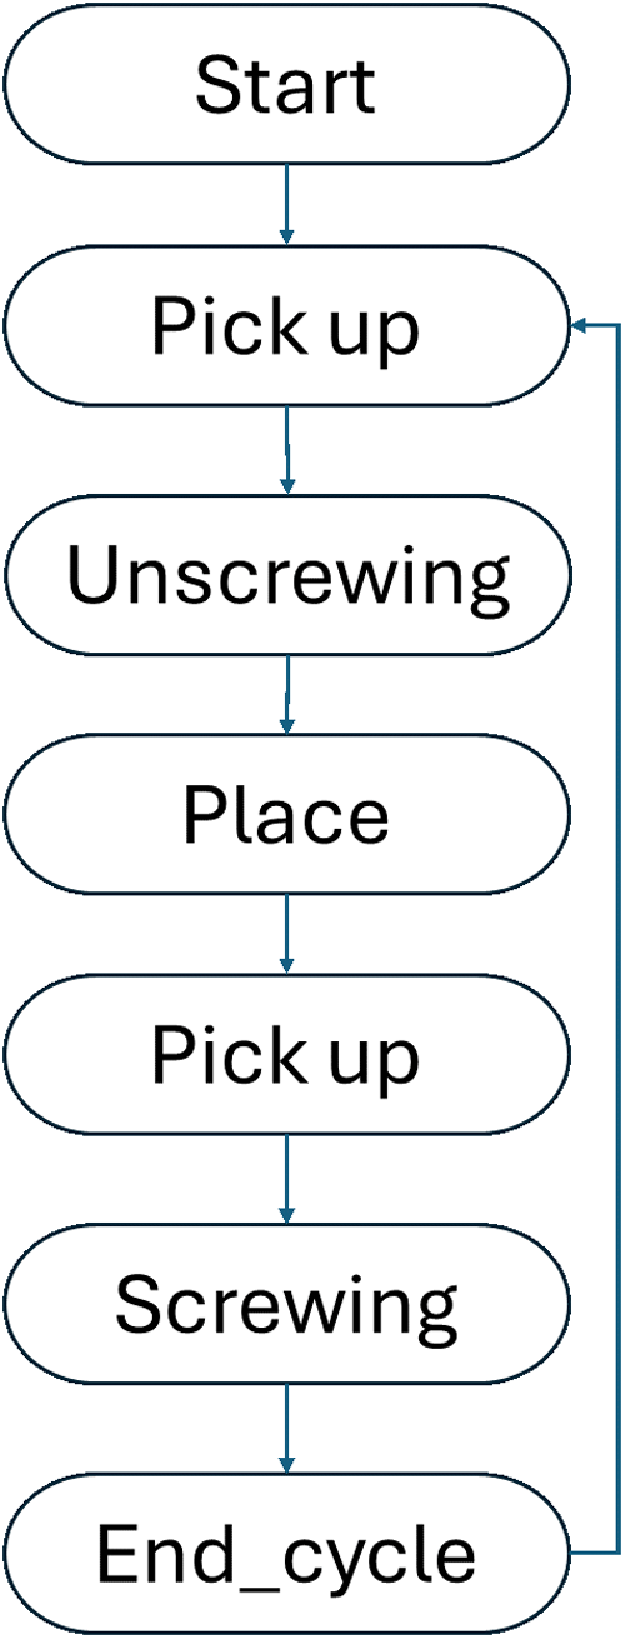
Specifically, in each cycle, the human will pick up the screwdriver from the workbench, loosen the screw, place the screwdriver back, pick it up again, and then tighten the screw to return it to its original position. All the steps are shown in the flowchart in Figure 11. Like the robot, the cycles planned for the human are 50.
Human screw removal flow chart.

5.2. Results
The results in Figure 12 show the behavior of the human force during a screw removal cycle. The two areas highlighted in purple and yellow correspond to the unscrewing and screwing phases, respectively. Comparing the two areas to the rest of the graph, the instantaneous force variation is significant, whereas in the other areas the force is nearly zero. Figure 13, on the other hand, shows the trend of the average force across the various cycles (highlighting how the human operator naturally minimizes load in undesired directions). The trend is not as uniform as the robot’s because the force applied by human changes significantly in each cycle. The ANOVA method, shown in Tables IX, X, XI and XII, indicates a significant difference between the various cycles. This demonstrates a deep deterioration over time as the number of cycles increases.
Human force on the screw during the screw removal task.

Human mean force per cycle.

ANOVA for cycle 1 and 10 (human).

ANOVA for cycle 1 and 25 (human).

ANOVA for cycle 1 and 50 (human).

ANOVA for cycle 25 and 50 (human).

5.3. Discussion
In this section, the numerical characterization of the screw removal task is presented as a case study to evaluate the efficiency of the objective function Q [Reference Quattrucci, Ceccarelli, Santoro, Russo, Quaglia, Boschetti and Carbone18]. After reporting the values acquired from the experiments, including time stamps and applied forces, a comparison is made to determine the optimal task assignment.
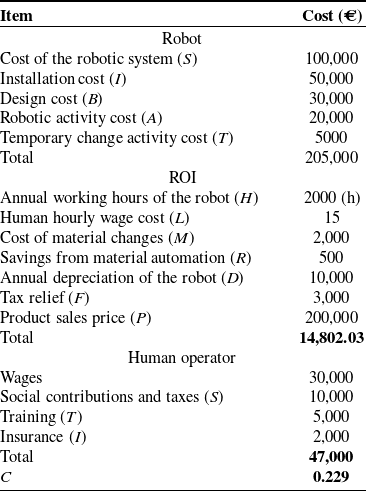
Values calculated in Table XIII approximate costs related to robot and human operator. Cost parameter is obtained using formulas (1), (2), (3) and (4). A more detailed estimation requires specific sector and operational environment data for a precise evaluation.
A numerical example of the cost parameter.

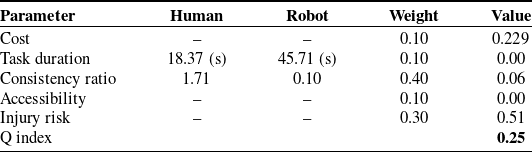
The parameters for human–robot task distribution, as defined in Table XIV, are established according to the methodology proposed in Section 2.2. The primary goal of the experiment is to evaluate performance in terms of timing and human safety, with cost assigned a weight of 0. The base time is calculated as the ratio of the average execution times of the robot and the human, based on the results from 50 cycles. Consistency ratio is determined as the ratio between the standard deviations of the task completion times for the operator and the robot, considering the results from 50 cycles, the difference between human and robot can be seen in Figure 14a, b. In this context, accessing the screw is straightforward, resulting in an accessibility parameter value of 0. During the screwdriving task, lateral bending and twisting postures pose significant physiological and biomechanical risks to workers [35]. Here, the likelihood of such occurrences is considered likely, while their severity is assessed as minor as seen in Table III. Consequently, the injury risk associated with these postures is rated at 0.51 [Reference Jeong, Park, Son and Mok30]. Weights are assigned to prioritize the operator’s health (0.3) and consistency ratio (0.4). Cost, accessibility, and task duration are given weights of 0.1. The resulting Q value is 0.25. Since this does not exceed the threshold of 0.5, the unscrewing task is assigned to the robot.
Human–robot distribution task parameter.

Variability of task duration: a. Robot task duration; b. human task duration.

6. Conclusion
In this paper, robotized task framework was presented with a laboratory case study focused on bolt removal, emphasizing the distribution of tasks between human operators and robots. A novel objective function, named Q, is proposed to assess key factors in human–robot task distribution, such as component accessibility, task duration, injury risk, and task consistency. A laboratory experiment is conducted to validate the practical application of the Q index within the selected case study. In our case, the unscrewing task was analyzed by comparing human and robot performance in terms of task duration and applied force during the screw removal. The subsequent evaluation of the Q index for this task indicates that the screw removal task is suited for robotic execution under the given conditions.
Author contributions
Luca Quattrucci, Matteo Russo, and Marco Ceccarelli conceived and designed the study. Luca Quattrucci e Reza Radpour conducted data gathering. Luca Quattrucci performed statistical analyses. Luca Quattrucci, Matteo Russo, and Marco Ceccarelli wrote the article. Matteo Russo and Marco Ceccarelli supervised the study.
Financial support
The first author would like to thank the Italian National Agency for New Technologies, Energy and Sustainable Economic Development (ENEA) for his doctoral scholarship.
Competing interests
The authors declare no conflicts of interest exist.
Ethical standards
Not applicable.