Can deficits in perceived legitimacy be tackled by increasing citizen participation in democratic decision making? Some scholars have argued that by engaging citizens in decision making, they will feel trusted and respected and consider the process to be fairer (for example, Barber Reference Barber1984; Pateman Reference Pateman1970; Sintomer, Herzberg and Röcke Reference Sintomer, Herzberg and Röcke2008; Smith Reference Smith2009; Tyler Reference Tyler1990). Others have debated the merits of participatory decision making to foster perceived legitimacy (for example, Hibbing and Theiss-Morse Reference Hibbing, Theiss-Morse, Sullivan, Snyder and Sullivan2008). To date, the empirical evidence provides us with an ambiguous picture (Arvai and Froschauer Reference Arvai and Froschauer2010; Boulianne Reference Boulianne2018; Herian et al. Reference Herian2012; Jäske Reference Jäske2019; Olken Reference Olken2010; Persson, Esaiasson and Gilljam Reference Persson, Esaiasson and Gilljam2013; Terwel et al. Reference Terwel2010; Ulbig Reference Ulbig2008).
In pursuit of an evidence-based debate about the effects of participatory processes, we take a step back and ask: What is the yardstick against which these processes should be measured? This yardstick too often remains implicit. In early theoretical works by proponents of participatory democracy, rosy ideals of how citizens could (and would) behave under a participatory democracy were described. For instance, citizens will conceive of themselves as community rather than self-interested individuals (Barber Reference Barber1984), they will continuously educate themselves in democratic skills and values (Pateman Reference Pateman1970) and they will strive to be rational truth seekers (Habermas Reference Habermas1996). Perhaps unintentionally, these seminal works have set the bar very high for evaluating participatory processes in empirical research.
The aggregate empirical evidence shows that citizens do not live up to these ideals in participatory processes (for example, Esaiasson et al. Reference Esaiasson2019), but also not in representative settings (as prominently discussed by Achen and Bartels Reference Achen and Bartels2016). More insightful than asking whether participatory procedures live up to these high standards is asking: Do they perform better than the status quo processes? More specifically, can participatory processes generate more legitimacy than current representative practices? Our argument builds on Warren's (Reference Warren2017) problem-based approach, which considers participatory processes as potentially complementary to representative democracy rather than as a replacement (see also Beauvais and Warren Reference Beauvais and Warren2018). A framework that allows us to compare the effects of participatory decision-making arrangements to existing procedures sheds light on the implications of adding participatory practices to representative democracy. Our approach is in line with recent discussions in democratic theory that demand more realistic approaches to the study of popular vote processes that move beyond thinking in competing models of democracy (El-Wakil and Mckay Reference El-Wakil and Mckay2019; Hug Reference Hug2009). For instance, El-Wakil (Reference El-Wakil2018) argues that there is no reason why we should demand voters to be more competent when voting in referendums than when voting in elections.
We illustrate the importance of evaluation frameworks by focusing on the so-called outcome favourability effect in evaluations of the fairness of the process. We consider fairness perceptions as one element of the broader concept of legitimacy perceptions, as is common in psychology, legal research and political science research on decision making and legitimacy (Blader and Tyler Reference Blader and Tyler2003; De Cremer, Cornelis and Van Hiel Reference De Cremer, Cornelis and Van Hiel2008; Esaiasson, Gilljam and Persson Reference Esaiasson, Gilljam and Persson2012; Grimes Reference Grimes2006; Tyler Reference Tyler1990).
Past research has repeatedly documented the link between fairness perceptions and other concepts such as decision acceptance, trust in authorities, cooperation and compliance (Esaiasson et al. Reference Esaiasson2019; Leung, Tong and Allan Lind Reference Leung, Tong and Allan Lind2007; Marien and Werner Reference Marien and Werner2018; Tyler Reference Tyler2011).
One recent reason for scepticism about the participatory processes is the observation that the favourability of the outcome shapes the evaluation of these processes, potentially even more so than the procedural characteristics (Arvai and Froschauer Reference Arvai and Froschauer2010; Esaiasson et al. Reference Esaiasson2019; Hibbing and Theiss-Morse Reference Hibbing, Theiss-Morse, Sullivan, Snyder and Sullivan2008). Winner–loser gaps in perceptions of fairness and related concepts have been identified across experimental (Arnesen Reference Arnesen2017; Doherty and Wolak Reference Doherty and Wolak2012; Esaiasson et al. Reference Esaiasson2019; Hibbing and Theiss-Morse Reference Hibbing, Theiss-Morse, Sullivan, Snyder and Sullivan2008) and observational studies (Marien and Kern Reference Marien and Kern2017). From an ideal-world perspective, this would indeed be troubling evidence against the appeal of participatory practices, because citizens do not behave like gracious losers. But, as has been documented repeatedly, citizens do not live up to this ideal in representative settings either. Electoral losers have lower evaluations of the fairness of the electoral system, lower levels of trust in government and lower levels of support for democratic principles than election winners (Anderson et al. Reference Anderson2005; Banducci and Karp Reference Banducci and Karp2003; Daniller Reference Daniller2016; Esaiasson Reference Esaiasson2011; Moehler Reference Moehler2009). The existence of an outcome favourability effect is therefore not a convincing argument against participatory processes.
But then how should we compare participatory and representative processes? Should we compare the size of the winner–loser gaps resulting from processes with and without participation? It is possible that both losers and winners perceive a decision-making process with participation as fairer than one without participation. Accordingly, the fairness perceptions of both winners and losers could increase, which would result in similarly sized winner–loser gaps in both procedures, and hide the boost in fairness perceptions. Recent empirical evidence points towards such an independence of process and outcome effects (Strebel, Kübler and Marcinkowski Reference Strebel, Kübler and Marcinkowski2019). It would be unwarranted to dismiss the potential of participatory procedures in such a scenario just because winners also experienced a boost. To evaluate the effects of participatory procedures, we need to move beyond the study of winner–loser gaps (see also Esaiasson Reference Esaiasson2011).
We argue that there are two necessary requirements for a participatory process to prove useful in terms of legitimacy generation. First, independent of the decision outcome, processes with a participatory element should result in higher fairness perceptions than those without such an element, such as purely representative processes. Secondly, a crucial (and more conservative) test for determining whether participation can foster perceptions of fairness is assessing decision losers' reactions to procedures with and without participatory processes. Since winners have already received a favourable outcome, they have little reason to be dissatisfied with the process or to not comply with the taken decision. Several scholars have argued that the demand for legitimacy arises especially when collective decisions are unfavourable to the individual to avoid disobedience and hence state coercion (Sabl Reference Sabl2015). In this vain, losers' consent presents a core challenge to democratic decision making. Finding strategies that can foster such consent is a (if not the most) important undertaking (Anderson et al. Reference Anderson2005; Esaiasson Reference Esaiasson2011; Sabl Reference Sabl2015). This results in the following two hypotheses:
Hypothesis 1: Decision making with a participatory process leads to higher fairness perceptions compared to decision making without a participatory process.
Hypothesis 2: Among decision losers, decision making with a participatory process leads to higher fairness perceptions compared to decision making without a participatory process.
Data and Methods
We draw on data from twelve experimental studies from the Netherlands (original data) and Sweden (data collected by Esaiasson et al. Reference Esaiasson2019). The experiments are similar in that they all contain a decision-making scenario and a 2 (procedure: participatory process vs. no participatory process) by 2 (outcome favourability: loser vs. winner) design. The general experimental protocol was identical in all studies. Participants were exposed to a policy issue and questioned about their policy preference on this issue. Subsequently, participants were randomly allocated to one of four conditions. Depending on the condition, a decision-making process was presented that did or did not include a participatory process. Afterwards, the decision was announced that was either in line with respondents' preferences or not, depending on the condition. Subsequently, respondents answered survey questions on their legitimacy perceptions.
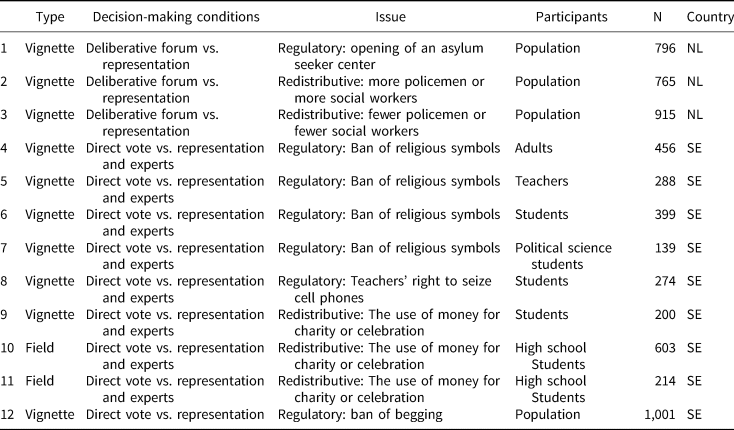
Table 1 shows that the experiments differ in three main methodological respects. We believe this increases confidence in the robustness and generalizability of the findings. First, participatory processes (PP) are operationalized differently across studies. In vignette studies 1–3, the PP treatment described decision making by citizens in a deliberative forum in which randomly selected citizens participated. Secondly, in vignette studies 4–9 as well as 12, PP was manipulated as decision making by citizens in a referendum (vs. decision making by elected representatives or experts). Lastly, in field experiments 10 and 11, respondents, in this case students, in the PP condition could vote directly, compared to decision making by a teacher or the student council. Further differences were the policy issue at hand, ranging from regulatory to redistributive issues and from political issues (such as the opening of an asylum centre) to group decision-making issues (such as the use of money for charity or a school trip).
Overview of experimental studies

The presentation of the stimulus also differed, ranging from watching animated movies (studies 1–3) or reading a text about a decision-making process (studies 4–9 and 12) to participating in the process themselves (studies 10 and 11).
The method of data collection varied from field experiments in schools to online survey experiments within the general population. The Swedish data was collected by Peter Esaiasson et al. (Reference Esaiasson2019), who generously provided access to the data.
Samples
Different sampling techniques were applied to the different studies. Participants in the vignette studies were recruited by survey companies, at train stations, during seminars for teachers, at Swedish universities and in high schools. For the field experiments, participants were recruited in high schools. For further information on the recruitment methods of the samples, stimulus material and demographic information, see Appendix A.
Measures
Fairness perceptions were measured in line with previous research on procedural fairness (Doherty and Wolak Reference Doherty and Wolak2012; Esaiasson et al. Reference Esaiasson2019; Herian et al. Reference Herian2012; Ulbig Reference Ulbig2008). In all experiments, the question wording was: ‘How fair do you think the process was that led to the decision?’ or a slight variation of it (see Appendix A). Answers were measured on a 7-point scale (from very unfair to very fair) across all studies, which are recoded for ease of interpretation to 0–1. In experiments 1 to 3, three additional items were included, such as: ‘How appropriate was the decision-making procedure?’ Conducting the analysis with the index variables results in substantially the same results (see Appendix, Table B2).
For further information on the design and the original analysis of the Swedish data (4–12), see Esaiasson et al. (Reference Esaiasson2019). For further information on the exact protocol of the Dutch studies (1–3), see Appendix A.
Analysis
The analysis is conducted in two parts. First, we use Study 1 as an example to show differences in analysis and interpretation between the ideal-world approach and the approach we propose. Secondly, we conduct the main analysis – effects of participatory processes on decision losers – across all twelve studies.
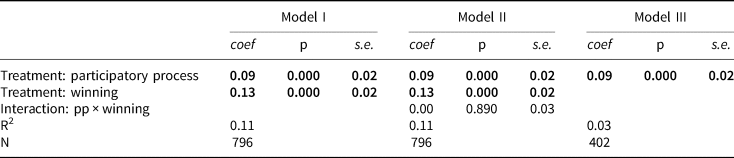
In Study 1, we analyse the average treatment effects on fairness perceptions. Model I in Table 2 demonstrates that participatory processes have a positive significant effect on fairness perceptions: giving citizens a voice leads to a more positive evaluation of the process. Further, outcome favourability has a substantial effect on perceptions of fairness, such that losers evaluate the procedure as less fair than winners. Judging from the unstandardized coefficients, the effect of the outcome favourability treatment is larger than that of the participatory treatment. This approach and these results have led scholars to conclude that outcomes matter more than processes, and that therefore the suggestion to implement participatory processes is flawed. However, as we argued earlier, this interpretation could be considered throwing the baby out with the bathwater. After all, it is plausible that outcomes also matter in standard processes without participation and we would find the same winner–loser gaps. As Model II shows, this is indeed the case as the interaction between the participatory treatment and the outcome treatment is not significant. Hence, participatory processes generate the same gap in fairness perceptions between decision winners and losers as representative processes. Critics may conclude that procedural reform is at the very least ineffective because it cannot narrow the winner–loser gap. Yet as we argued above, the mere size of this outcome favourability gap is not informative. Winners and losers can both gain from a participatory process. A similarly sized gap between winners and losers does not exclude the possibility of change in overall levels of fairness perceptions.
Explaining fairness perceptions across treatment groups for Study 1

Note: non-standardized coefficients are presented, estimates with a p-value below 0.05 in bold. Study issue: opening an asylum seeker center.
The insightful comparison is (a) between people who experienced a participatory process and those who did not, independent of the outcome and (b) between people who lost and experienced a participatory process compared to those who lost and experienced a standard process without participation.
Table 2, Model I shows a positive and highly significant main effect of participatory process on respondents’ fairness perceptions. Since the treatment variables are orthogonal to each other by design, this effect is independent of outcome favourability. Hence, it seems that participatory processes generate an overall boost in perceptions of fairness. Turning towards the critical group of decision losers, Model III reveals a positive and highly significant effect. Decision losers have higher perceptions of fairness if the decision was made in a process that allowed participation than those who took part in a purely representative procedure. It might seem contradictory that the winner–loser gap did not change while losers increased their perceptions of fairness, but this stable gap can be explained by the fact that the evaluation of the process increased relatively similarly among both winners and losers. It shows that what we identify as the critical group – losers – does consider participatory processes to be fairer than processes without participation.
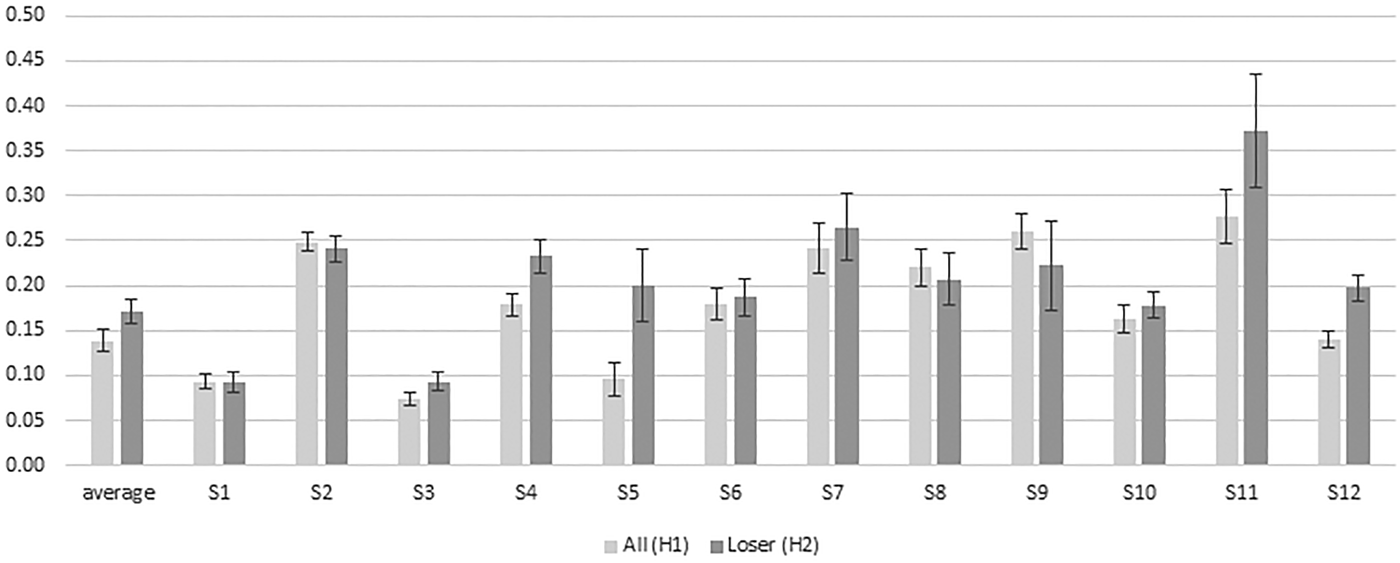
In the second part we apply this alternative approach to all twelve experiments. Do fairness perceptions consistently and significantly increase when a decision-making process is more participatory compared to purely representative or expert based? Does this also hold for losers? The unstandardized effects are shown in Figure 1 (fairness perceptions range from 0–1). The first column plots the effect across all studies, estimated using regression with robust standard errors clustered by study to account for the nested nature of the data. The other columns present the estimates for each individual study. For each of the twelve studies, we find positive and significant effects of the participatory process for both losers and for the full samples (winners and losers combined). The effect sizes range from 0.07 in study 3 to 0.37 in study 11. On average, decision making with a participatory process led to an increase in the fairness perception of 0.16 for losers and 0.13 for all respondents on a scale from 0–1, which we consider rather substantial effects.
Overview of effects of participatory process on fairness perceptions across studies.
Note: coefficients for the column ‘average’ are the results of an ordinary least squares (OLS) regression with robust standard errors clustered by study; OLS with clustered robust standard errors for studies 7 and 8 (clustered by class); OLS regressions for all other studies. Unstandardized coefficients are presented, fairness perceptions range from 0–1, error bars present 95 per cent confidence intervals. See Appendix Table B1 for an overview of the main effects across studies.

In addition, in several of the twelve studies presented here we find slightly, yet not significantly (except for study 12), larger effects of participatory processes on decision losers than on decision winners (see Appendix Table B3). The question of whether decision losers are more sensitive to process information than decision winners warrants future investigation.
Discussion
In line with recent criticism of standard approaches to the study of participatory processes, we have argued that such processes should not be compared to normatively desirable ideal-type citizens, but instead to political behaviour in existing representative procedures, focusing particularly on decision losers.
We advocate shifting the focus away from plotting outcome and process effects against each other when evaluating the potential of participatory processes to increase perceptions of legitimacy. Individuals can care strongly about outcomes and processes – or care little about either. In short, we should test whether different procedural settings can create better losers; if they also create happier winners, this is not problematic.Footnote 1
A limitation of the empirical evidence presented in this letter is that it stems from experimental research that uses more or less hypothetical scenarios. Therefore we lack confidence regarding whether the effects would play out similarly in the real world, especially when we account for how the processes are framed in public debates. Yet, strong conclusions have been drawn that oppose the legitimacy-fostering capacity of participatory processes using similar designs.
To gain more insights into the potential of these participatory processes, a number of questions remain, such as: are these effects large enough to justify the additional costs of changing procedural arrangements? What level of legitimacy beliefs is sufficient to guarantee the compliance and co-operation of decision losers? These, we believe, are exciting avenues for further research for both democratic theory and empirical research.
Supplementary material
Data replication sets are available in Harvard Dataverse at: https://doi.org/10.7910/DVN/ZNG7PM and online appendices are available at https://doi.org/10.1017/S0007123420000459.
Acknowledgements
We are grateful to Peter Esaiasson for providing data and valuable feedback on this manuscript. We also thank Wouter Schakel, Jamie Pow, our colleagues at the University of Amsterdam and KU Leuven as well as the participants of the Barcelona-Gothenburg-Bergen workshop for Experimental Political Science in 2018 for their helpful comments. This publication reflects the authors' view and the Agency is not responsible for any use that may be made of the information it contains.
Funding
This project has received funding from the European Research Council under the European Union's Horizon 2020 research and innovation programme (grant agreement No 759736).