Introduction
Measurements of enteric methane (CH4) emissions from livestock have traditionally been obtained using indirect calorimetry techniques. While these techniques are both accurate and reliable, the expense and need for animal training limit the numbers of animals that can be measured (Johnson et al., Reference Johnson, Westberg, Lamb and Kincaid1998). In addition, the extent to which calorimetric results can be extrapolated to free-ranging animals for which diet, behaviour and environment are different from those in enclosed chambers has been questioned and has stimulated the development of measurement techniques suitable for grazing animals (O’Kelly and Spiers, Reference O’Kelly and Spiers1992; Johnson et al., Reference Johnson, Huyler, Westberg, Lamb and Zimmerman1994a; Lockyer and Jarvis, Reference Lockyer and Jarvis1995; Harper et al., Reference Harper, Denmead, Freney and Byers1999; Leuning et al., Reference Leuning, Baker, Jamie, Hsu, Klein, Denmead and Griffith1999).
Studies with sheep (Murray et al., Reference Murray, Bryant and Leng1976; Torrent and Johnson, Reference Torrent and Johnson1994; Immig, Reference Immig1996) have established that the rumen accounts for about 87% of the total digestive tract CH4 production. According to Murray et al. (Reference Murray, Bryant and Leng1976), about 95% of the rumen CH4 is excreted by eructation, whereas 89% of the lower-gut CH4 production (about 13% of the total) is exhaled through the lungs. Thus, about 98% of the total tract CH4 production is excreted through the mouth and nostrils. Based on this knowledge, Johnson et al. (Reference Johnson, Huyler, Westberg, Lamb and Zimmerman1994a) developed the sulphur hexafluoride (SF6) tracer technique for CH4 emission measurements on individual animals. Thus, it is implicit that the SF6 tracer technique detects CH4 exiting only through the mouth and nostrils. The SF6 tracer technique is now widely used in New Zealand and many other countries for CH4 emission measurements on grazing or pen-fed cattle, sheep and alpacas (Lassey and Ulyatt, Reference Lassey and Ulyatt1999; Lassey, Reference Lassey2007).
Lassey (Reference Lassey2007) summarised attempts to compare calorimetric and SF6 tracer techniques for CH4 emission measurements. For example, working with cattle, Johnson et al. (Reference Johnson, Huyler, Westberg, Lamb and Zimmerman1994a) reported good agreement between the SF6 tracer technique and calorimetry chamber CH4 measurements, and more recently Boadi et al. (Reference Boadi, Wittenberg and Kennedy2002) using cattle with ventilated hoods corroborated that agreement. However, studies conducted in sheep by Pinares-Patiño (2000) and Wright et al. (Reference Wright, Kennedy, O’Neill, Toovey, Popovski, Rea, Pimm and Klein2004) failed to demonstrate agreement between the SF6 tracer and the calorimetric chamber in their CH4 emission estimates. Reasons for the disagreement might be related to the uncertainty of rate of permeation of SF6 from the tracer source deployed in the reticulo-rumen of the experimental animal and poor ventilation leading to increased local concentrations of SF6 and CH4 gases (Pinares-Patiño, 2000). The tracer source (permeation tube) is charged at 600 to 900 mg SF6, and at permeation rates (hereafter abbreviated as ‘PR’) of 0.6 to 1.7 mg/day one could expect useful life of permeation tubes beyond a year. Lassey et al. (Reference Lassey, Walker, McMillan and Ulyatt2001) analysed the performance of SF6 permeation tubes and concluded that PR does not remain constant with time, as the technique supposes, but it changes slowly.
CH4 is a by-product of the feed fermentation process and it is well established that digestion efficiency and digesta kinetics differ between cattle and small ruminants, especially when they are fed on forages (Colucci et al., Reference Colucci, MacLeod, Grovum and McMillan1984; De Boer et al., Reference De Boer, Cottyn, Boucque, Aerts and Buysse1984). In addition, there is limited evidence that ruminant species differ in rumen motility and excretion of digestive gases (Colvin et al., Reference Colvin, Wheat, Rhode and Boda1957; Dougherty and Cook, Reference Dougherty and Cook1962; Dougherty et al., Reference Dougherty, Allison and Mullenax1964; Dziuk and McCauley, Reference Dziuk and McCauley1965; Hoernicke et al., Reference Hoernicke, Williams, Waldo and Flatt1965; Murray et al., Reference Murray, Bryant and Leng1976). Hence, reliability of the SF6 tracer technique demonstrated in cattle does not assure comparable reliability in small ruminants.
The present study sought to evaluate the reliability of the SF6 tracer technique for CH4 emissions measurement on forage-fed sheep, with permeation tubes deployed either for long or short terms. The long-term deployment was a non-intended feature.
Material and methods
Experimental design and animals
Two indoor trials (T1 and T2) were conducted with the same group of 10 cryptorchid Romney sheep in order to measure their individual CH4 emissions both by the SF6 tracer (hereafter referred as ‘tracer CH4’) and by the indirect calorimetry chamber (hereafter referred to as ‘chamber CH4’) techniques while fed at 1.2 times their maintenance requirements on chaffed lucerne hay. Trial T1 was conducted during the spring of 1997, when sheep were housed in a naturally ventilated building, whereas T2 was conducted during the autumn of 1998, when sheep were housed in a covered yard. All the chamber measurements of CH4 emission used the two-chamber facility at the Animal Physiology Unit, Massey University (Palmerston North, New Zealand). Before the start of trials and between trials, sheep were maintained at grazing on ryegrass/white clover pasture. In T1, sheep were 14 months old and 40.4 ± 4.2 kg live weight, whereas in T2 they were 22 months old and 46.9 ± 4.8 kg live weight. The sheep were prepared with rumen cannulae (65 mm internal diameter) 3 months before T2 commencement, and foam washers were fitted around the cannulae immediately prior to T2 to avoid loss of gases through the rumen fistula.
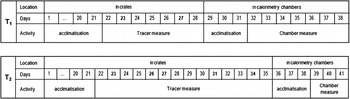
In both the trials, management of sheep was staggered over time in order to synchronise with the availability of one chamber dedicated to measurement. Sheep were brought indoors and put in digestibility crates, where, after an acclimatisation period of 21 days, intermittent tracer CH4 emission measurements were conducted over a 7-day (T1) or a 14-day (T2) period. Then, sheep were transferred to calorimetry chambers for 3 days of acclimatisation followed by 7 (T1) or 3 (T2) days of CH4 emission measurement. Figure 1 shows the experimental design for the trials, detailing the specific days when the tracer CH4 measurements took place.
Experimental designs for the trials, showing the location where sheep were held, the days involved in acclimatisation and methane (CH4) measurement by either technique. The days shown in bold (23 and 27 for trial T1; 23, 26, 27, 31 and 34 for trial T2) represent specific days when the tracer CH4 measurements took place.

The experimental protocols for both trials of this study were approved by the Animal Ethics Committee of AgResearch Limited.
Feeds and feeding
Chaffed (∼5 cm) lucerne hay from one uniform batch was fed during both trials, and the quality of the feed offered was controlled by thorough mixing of the total experimental requirements and weighing the daily allowance for individual animals into plastic bags, prior to the experiment.
The organic matter, crude protein, neutral-detergent fibre, soluble carbohydrate and lipid contents (dry matter (DM) basis) of the hay were 88.6%, 19.1%, 40.1%, 2.7% and 1.8%, respectively, whereas the metabolisable energy (ME) content was 8.4 MJ/kg DM, as determined by near-infrared (NIR) spectroscopic analysis.
The feeding level was restricted to 1.2 times the maintenance energy requirements using the feeding standards of the Standing Committee on Agriculture (SCA, 1990). This was to ensure that the animals ate all the feed on offer and also to avoid variation in feed intake between tracer and chamber measurement periods. In trial T1, the sheep were fed twice daily (0800 and 1600 h), in digestibility crates and in the chambers; whereas in T2 sheep were fed automatically 12 times per day when in digestibility crates, but twice daily in the calorimetry chambers. Drinking water was made available ad libitum under all circumstances.
Measurements and sample analyses
Feed intake
The amounts of feed on offer, refused and spilled were weighed daily and samples were taken for DM determinations (65°C, 48 h). Except for small amounts of feed spilled, the sheep ate all of the feed on offer in both the digestibility crates and the calorimetry chambers. Mean ± s.d. daily feed DM intakes in T1 and T2 were 1088 ± 100 and 1139 ± 106 g, respectively.
Measurement of CH4 emissions by the chamber technique
The two chambers (1 and 2) used in this study have been described by Holmes (Reference Holmes1973). Briefly, each chamber was made of galvanised sheet steel and rigid steel framework with internal dimensions of 170 cm length × 70 cm width × 150 cm height. Each chamber was insulated externally with polystyrene and temperature maintained at 14°C to 16°C by means of a water-cooled, fan-ventilated heat exchanger controlled thermostatically. Fresh air was drawn in from a height of 5 m above the ground level outside the building and exhausted from each chamber by a rotary pump, allowing a slight negative pressure within the chambers. The outgoing airflow was measured using dry gas meters. Airflow (30 to 40 l/min) was controlled by means of manifolds connected to the pump. Temperature, humidity and pressure of air flowing to the gas meters were measured in order to correct the air volume to standard conditions. An IR gas analyser (Servomex, Crowborough, East Sussex, UK) was used to measure the CH4 concentrations on aliquot representative samples (∼7 l) of chamber inflow and outflow air streams. These samples were collected continuously (over ∼22 h) in spirometers sealed with liquid paraffin.
The two calorimetry chambers differed in construction, with chamber 1 being older than chamber 2. A gravimetric method was used to test the recovery of CH4 in the chambers. Ultrapure (>99.99%) CH4 (BOC Gases NZ Ltd, Lower Hutt, New Zealand) was metered at about 25 ml/min (17.9 mg/min) into each chamber for about 2.5 h and the dispensing cylinder was weighed at the start and the end of the release periods to determine the weight of CH4 released. The rate of release of CH4 was set to match the average concentration of CH4 (∼600 p.p.m.) encountered in the chamber during trials involving sheep. The gas recovery in chamber 2 was 95.5 ± 0.5%, and this factor was used to adjust the CH4 emission data. Chamber 1 had the poorer recovery (88.8±7.0%), and so was used only for acclimatisation prior to CH4 measurements in chamber 2.
In T1, after the daily CH4 measurement by the chamber technique was finished, the remainder (if available) of the aliquot samples from the chamber outflow and inflow gases, which had been collected in the spirometers, were carefully drawn into evacuated PVC containers (hereafter referred to as a ‘yoke’ due to its inverted ‘U’ shape) for gas analysis under the SF6 tracer protocol. Wherever possible, two samples per animal were collected.
Measurement of CH4 emissions by the SF6 tracer technique
The calibrated SF6 tracer source (i.e. the permeation tube), the gas collection system and the subsequent analysis of samples are the three major components of the SF6 tracer technique (Johnson et al., Reference Johnson, Huyler, Westberg, Lamb and Zimmerman1994a), and the application of this technique for CH4 measurement in sheep housed in metabolism creates has been described by Pinares-Patiño et al. (Reference Pinares-Patiño, Ulyatt, Lassey, Barry and Holmes2003). Briefly, it involved the use of a calibrated permeation tube charged with SF6 and with a known SF6 PR, which was inserted per os (T1) or per fistula (T2) into the rumen of each animal 250 and 30 days before the commencement of T1 and T2, respectively. The reason for the long pre-deployment of permeation tubes in T1 was that the sheep were selected from a larger flock on the basis of emission experiments that used the same tubes.
PRs of tubes used at each trial were determined individually through serial weighing prior to insertion (hereafter referred as ‘pre-calibrated PR’), and for the two independent sets of permeation tubes used in T1 and T2, the PRs were 1.313 ± 0.440 and 0.691 ± 0.097 mg/day (mean ± standard deviation), respectively. During collection days, a sample of air exhaled by each sheep was drawn continuously (controlled by capillary tubing) from near the mouth and nostrils over ∼22 h into a lightweight pre-evacuated yoke suspended above the digestibility crate. Finally, gas chromatography (GC) was used to analyse the concentrations of CH4 and SF6 gases in the collected samples using flame ionisation detection and electron capture detection, respectively. All samples including the standards were run in triplicate, and the acceptance criterion was a coefficient of variation (CV) <0.75% among the three (except for backgrounds where the criterion was <2%). The curvilinear detector response to SF6 had been carefully characterised over the encountered dynamic range between background levels (∼4 p.p.t.) up to 1000 p.p.t. Detailed description of the tube calibration process is given by Lassey et al. (Reference Lassey, Walker, McMillan and Ulyatt2001), and details of the gas analysis process are described by Lassey et al. (Reference Lassey, Ulyatt, Martin, Walker and Shelton1997).
The daily CH4 emission (tracer CH4) was calculated using the ratio of molar mixing ratios, CH4 to SF6 (each corrected for mixing ratios in background air) in the yoke-borne sample, in conjunction with the pre-calibrated PR of SF6, as shown by the following formula (Johnson et al., Reference Johnson, Huyler, Westberg, Lamb and Zimmerman1994a):

where the multiplier ‘16/146’ is the ratio of molecular weights that converts molarity to mass.
CH4 emission measurements by the SF6 technique (tracer CH4) were carried out while animals were kept in digestibility crates, placed 2 to 3 m from each other to minimise cross-inhalation, within a building. The building (Animal Physiology Unit, Massey University) used in T1 was naturally well ventilated during the working hours (0700 to 1800 h) by opening two doors at each end of the building (one large and one small), but night ventilation was restricted to the small door only. In T2, the sheep were kept in a well-ventilated covered yard at AgResearch Grasslands (Palmerston North, New Zealand). The tracer CH4 measurements were carried out for 2 and 5 days in T1 and T2, respectively (Figure 1).
In both the trials, background air samples were collected from the incoming air stream into two evacuated yokes. Ranges of mixing ratios of SF6 and CH4 in background air samples during the trails were 5.1 to 8.1 p.p.t. and 1.9 to 2.8 p.p.m., respectively. Background concentrations of SF6 and CH4 were used to correct the concentrations found in the samples.
Estimations of CH4 emissions from analyses of chamber gases by the tracer protocol in trial 1
In T1, once analyses of chambers’ inflow and outflow air samples were finished by the calorimetric chamber procedures, the remainder of the aliquot samples collected over ∼22 h were drawn into evacuated yokes, and CH4 and SF6 molar mixing ratios analysed by GC as per the tracer technique. The molar mixing ratios of the gas SF6 in these samples were used to calculate the daily amount of this gas released in the chamber from a particular permeation tube located in the rumen of a particular animal (hereafter referred to as ‘calculated PR’), according to the formula:

where [out SF6] and [in SF6] are the mixing ratios of SF6 in the chamber outflow and inflow air, respectively; VR is the standardised ventilation rate (l/day) in the chamber, and 6.518 g/l is the ratio of molecular weight of SF6 to standard molar volume.
Then, the tracer technique calculation principles were used to estimate CH4 emissions based on the molar mixing ratios of CH4 and SF6 gases in the chamber inflow (in) and outflow (out) air samples (determined as per the tracer protocol) in conjunction with either the pre-calibrated PR or the calculated PR of SF6 from permeation tubes. Hereafter, CH4 emission calculation based on chamber gases using the pre-calibrated PR is named ‘pre-calibrated PR in chamber CH4’, whereas similar calculation using the calculated PR is named ‘calculated PR in chamber CH4’. The formulas are

Post-recovery PR
Permeation tubes used in T1 and T2 were retrieved from the rumen of the animals after 397 and 50 days of deployment, respectively, and once cleaned and left to dry, their weight losses were monitored for about 6 months in the laboratory at 39°C and a new post-recovery PR determined (hereafter referred to as ‘post-recovery PR’). The post-recovery PR was not used to re-calculate the CH4 emission, but it was compared with both the pre-calibrated PR and calculated PR.
In this study, the PR of tubes while in the rumen of the animal is named ‘in-rumen PR’, which cannot be measured directly and is usually equated to the pre-calibrated PR. However, if the recovery of SF6 in the calorimetry chamber was close to 100%, the calculated PR would be a good estimator of the in-rumen PR. Lassey et al. (Reference Lassey, Walker, McMillan and Ulyatt2001) have addressed the situation where the pre-calibrated PR cannot be extrapolated with confidence to a protracted trial time.
Data calculation and analysis
For each trial, the mean values and the CV of CH4 emissions per animal (g/day) were calculated. The two CH4 measurement techniques (chamber and tracer) were compared by the paired t-test (Cody and Smith, Reference Cody and Smith1991). In addition, the mean CH4 emission estimates were subject to correlation analysis. Similar statistical analyses were carried out to compare the daily CH4 emissions measured by the chamber technique and the emissions estimated based on chamber’s gas molar mixing ratios (T1 only). For the latter, only the chamber CH4 emission values corresponding to the days when the chamber gases were withdrawn and analysed by GC (as per the tracer protocol) were computed.
Finally, where data were available, pre-calibrated PR, calculated PR and the post-recovery PR of SF6 from the permeation tubes were compared by paired t-tests. For this purpose, each individual calculated PR and post-recovery PR was expressed as a percentage of the corresponding pre-calibrated PR. Coefficients of correlation between these relative PR values were also calculated.
In T2 two animals could not adapt to the chamber conditions. So, data for chamber measurements in this trial were collected from eight animals.
Results
Tracer and chamber CH4 emissions
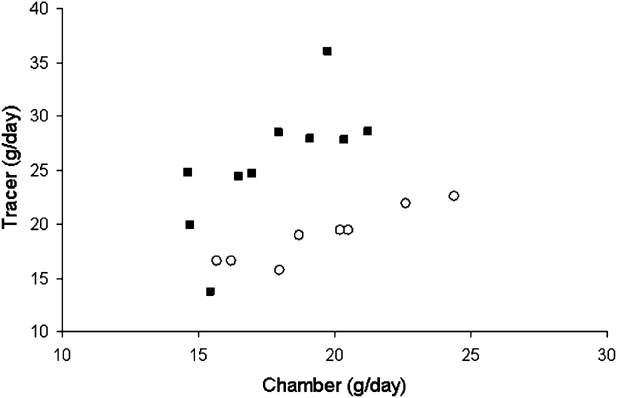
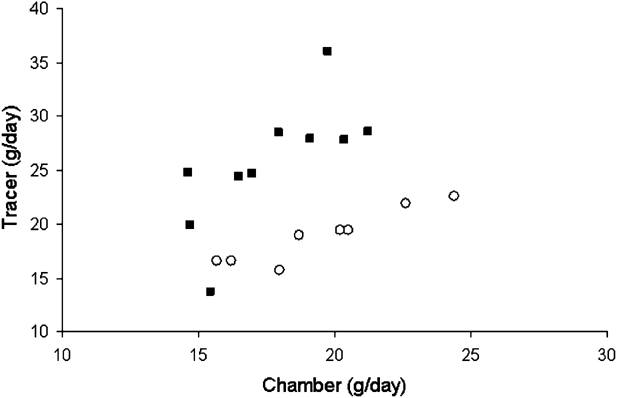
In trial T1, the tracer technique yielded significantly greater CH4 emission (by 39%) than the chamber technique, whereas in T2 the two measurement techniques did not differ significantly from each other in their CH4 emission estimates (Table 1). In both the trials, the chamber technique produced less variable CH4 emission estimates (by 0.65 and 0.45 in T1 and T2, respectively) than the tracer technique (Table 1). In trial T1, the CH4 emission estimates by the tracer and the chamber techniques were not significantly correlated with each other (r = 0.53, P > 0.09), but in trial T2, a significant correlation (r = 0.93, P = 0.001) between the two techniques was observed (Figure 2).
Mean ± s.e. and coefficient of variation (CVFootnote †) of methane (CH4) emissions from sheep (g/day) at the two trials (T1 and T2) as measured by the sulphur hexafluoride (SF6) tracer technique (tracer CH4, in digestibility crates) and by the calorimetry chamber (chamber CH4), and test of the difference of their meansFootnote ‡

† CV calculated by dividing the root mean square error by the mean value.
‡ Paired t-test of Ho: tracer CH4 – chamber CH4 = 0. Superscripts indicate that within a particular trial, the difference of means is significantly different (**P < 0.01) or not different (n.s. P > 0.05) from 0. Values in parenthesis indicate number of observations.
Relationship between the estimates of methane (CH4) emission (g/day) by the calorimetric chamber (chamber CH4) and the sulphur hexafluoride (SF6) tracer (tracer CH4) for trials T1 (▪) and T2 (○).
Estimations of CH4 emissions based on analyses of chamber gases by the tracer protocol in trial 1
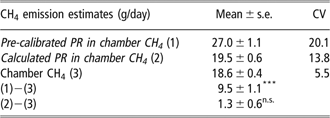
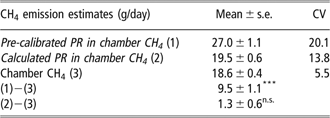
Table 2 presents for trial T1 the CH4 emission estimates (g/day) based on the molar mixing ratios of chamber gases analysed by the tracer protocol in conjunction with either the pre-calibrated PR or calculated PR as well as the CH4 emission values determined by the chamber technique. The CH4 emission estimated by the pre-calibrated PR in chamber CH4 procedure was much higher (by 38%) than the chamber CH4 value, whereas the calculated PR in chamber CH4 estimates and chamber CH4 values were not significantly different from each other (19.5 and 18.6 g/day, respectively). Overall, the chamber CH4 values had smaller variation than those of pre-calibrated PR in chamber CH4 and calculated PR in chamber CH4 estimates (Table 2).
Mean ± s.e. and coefficient of variation (CVFootnote †) of methane (CH4) emissions (g/day) for trial T1 as estimated based on analyses of chamber gases by the tracer routine (‘pre-calibrated PRFootnote ‡ in chamber CH4’ and ‘calculated PR in chamber CH4’) or measured by the calorimetry chamber (chamber CH4), and tests of the difference of their meansFootnote § (each value represents the mean of 28 simultaneous observations)
† CV calculated by dividing the root mean square error by the mean value.
‡ PR=permeation rate.
§ Paired t-test of Ho: difference of means = 0. Superscripts indicate that the difference of means is significantly different (***P < 0.001) or not different (n.s. P > 0.05) from 0.
The chamber CH4 values did not correlate with the pre-calibrated PR in chamber CH4 estimates (r = 0.44, P = 0.18) but they correlated positively (r = 0.64, P = 0.03) with the calculated PR in chamber CH4 estimates. A high and significant correlation was observed between the tracer CH4 and the pre-calibrated PR in chamber CH4 estimates (r = 0.88, P = 0.001).
PR of SF6: relationships between the pre-calibrated PR, calculated PR and the post-recovery PR
Table 3 shows the mean PRs and tests of differences of means among the pre-calibrated PR, the calculated PR (based on chamber gases) and the post-recovery PR of tubes deployed at each trial. Data for calculated PR was not available for trial T2. The calculated PR and post-recovery PR of tubes used in T1 were significantly (P < 0.001) lower (by 20% and 22%, respectively) than their respective pre-calibrated PR. However, the post-recovery PR of tubes used in this trial (T1) was not different (P > 0.05) from the calculated PR. In this trial (T1), the pre-calibrated PR was highly correlated with both the calculated PR (r = 0.93, P < 0.0001) and the post-recovery PR (r = 0.97, P < 0.0001). Similarly, the calculated PR and post-recovery PR were also highly correlated (r = 0.90, P = 0.0009).
Mean ± s.e. pre-calibrated permeation rate (PR), the in chamber calculated PR and the post-recovery PR of sulphur hexafluoride (SF6) from permeation tubesFootnote † used in each trial and tests of difference between their means

All values (except columns (2) and (3)) expressed as percent of the pre-calibrated PR (100%). For columns (2) and (3), the calculated PR expressed as percent of post-recovery PR. Each value represents the mean of 8 (T1) or 10 (T2) observations.
† Independent set of tubes deployed at each trial.
‡ Paired t-test Ho: difference of means = 0. Subscripts indicate that within a trial, the difference of means is significantly different (***P < 0.001) or not different (n.s. P > 0.05) from 0.
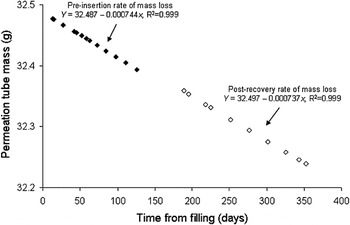
In contrast to T1, in T2 the post-recovery PR was not different (P > 0.05) from their pre-calibrated PR values (Table 3), but they were highly correlated with each other (r = 0.98, P < 0.0001). The latter observation is illustrated in Figure 3, where the pre-calibrated PR and the post-recovery PR of tube 344 deployed in sheep no. 2 typically represents the permeation behaviour of the set of tubes used in T2, i.e. there was very little change in PR between the pre-insertion and the post-recovery stages.
Calibration data from serial weighing of tube 344 deployed in sheep no. 2 during trial T2. The pre-calibrated permeation (PR) and post-recovery PR of sulphur hexafluoride (SF6) are deduced by linear regression from the data of days 13 to 126 and days 189 to 352, respectively (day 0 is the date of the tube fill). The post-recovery PR was only 0.007 mg/day less than the pre-insertion pre-calibrated PR (0.737 v. 0.744 mg/day). This figure is similar to Figure 2a of Lassey et al. (Reference Lassey, Walker, McMillan and Ulyatt2001).

Discussion
Johnson et al. (Reference Johnson, Huyler, Westberg, Lamb and Zimmerman1994a) examined the validity of the SF6 tracer technique for CH4 measurement in cattle by comparing 55 measurements made with the tracer (in pens) to those obtained from 25 measurements using open-circuit respiration chambers and found that whereas the tracer mean estimates were 93% of those in the chambers, these differences were not significant. A more recent validation test of the tracer technique against ventilated hoods also using penned cattle (Boadi et al., Reference Boadi, Wittenberg and Kennedy2002) showed that although the techniques did not differ significantly, the tracer estimates were slightly higher (by 5%) than the calorimetric measurements. Results of trial T2 of the present study, in which the PRs were more precisely known due to the more recent calibration, agreed with those found by Johnson et al. (Reference Johnson, Huyler, Westberg, Lamb and Zimmerman1994a) in showing that the calorimetry chamber CH4 values were 4% higher than the corresponding tracer estimates, but with no significant differences between the methods. Tracer CH4 emission estimates could be expected to be slightly smaller than those measured in respiration chambers because the flatus CH4 excretion, which accounts for approximately 2% of the total emission of CH4 (Murray et al., Reference Murray, Bryant and Leng1976), is not accounted for by either the SF6 tracer technique or by partial enclosure calorimetry (ventilated hoods).
Results of this study also support earlier reports (Johnson et al., Reference Johnson, Huyler, Westberg, Lamb and Zimmerman1994a and Reference Johnson, Huyler, Westberg, Lamb and Zimmerman1994b; Ulyatt et al., Reference Ulyatt, Baker, McCrabb and Lassey1999; Boadi et al., Reference Boadi, Wittenberg and Kennedy2002; Clark et al., Reference Clark, Pinares-Patiño and De Klein2005) that the tracer technique is associated with larger variation than the standardised calorimetry techniques. However, a recent study conducted by McGinn et al. (Reference McGinn, Beauchemin, Iwaasa and McAllister2006), where the influence of environment on estimations were cancelled by conducting all measurements in chamber, reported that the tracer technique was more accurate and precise than the calorimetric technique, especially when forage diets were used. Since estimates of total CH4 emissions using the SF6 tracer technique depend on the assumption that CH4 and SF6 are predominantly excreted via the mouth and nose (Ulyatt et al., Reference Ulyatt, Baker, McCrabb and Lassey1999), it can be conjectured that the proportion of CH4 excretion in flatus is not only dependent on feeding conditions, but also highly variable between animals.
Results of T2 of the present study, however, are in disagreement with those of Wright et al. (Reference Wright, Kennedy, O’Neill, Toovey, Popovski, Rea, Pimm and Klein2004), who working with sheep fed on a low-quality tropical grass hay found emissions expressed as a percentage of gross energy intake (%GEI, hereafter termed ‘CH4 yield’) of 16% to 37% and 8% to 12% GEI for tracer and chamber methods, respectively, with the chamber estimates being similar to previous observations (Kurihara et al., Reference Kurihara, Magner, Hunter and McCrabb1999) on cattle fed on similar diets, and CH4 measured in the same chambers. However, the extremely high estimates of CH4 yield for the tracer method observed by Wright et al. (Reference Wright, Kennedy, O’Neill, Toovey, Popovski, Rea, Pimm and Klein2004) have no precedent in the literature. The production of CH4 is related to the production of volatile fatty acids during the fermentation process, and even if all carbohydrates were fermented to acetic acid (stoichiometric assumption), the maximum CH4 yield would be only 33% (Wolin and Miller, Reference Wolin and Miller1988). In practice, a maximum CH4 yield of 15% GEI as measured by the calorimeter chamber has been reported for dairy cows fed on mixed diets (Holter and Young, Reference Holter and Young1992) and our extensive database for SF6 tracer measurements of CH4 emissions from ruminants fed on temperate forages show CH4 yields up to 8.3% GEI. Thus, the results of Wright et al. (Reference Wright, Kennedy, O’Neill, Toovey, Popovski, Rea, Pimm and Klein2004) are difficult to explain with regard to tracer CH4 emission estimates.
In contrast to trial T2 and expectations based on CH4 excretion dynamics (Murray et al., Reference Murray, Bryant and Leng1976), results of trial T1 of the present study showed that the tracer CH4 estimates (based on pre-calibrated PR) were 1.4 times greater than the corresponding chamber CH4 values. Arguments to support our hypothesis that the tracer rather than the chamber CH4 estimates lacked accuracy in trial T1 are now discussed. First, the tracer CH4 estimates observed in trial T1 were associated with large variability (CV = 18%), whereas the chamber CH4 values were more consistent, with a CV similar to those (∼7%) more commonly observed in chamber measurements (e.g. Blaxter and Clapperton, Reference Blaxter and Clapperton1965). In contrast to T1, the tracer CH4 estimates in T2 showed much lower variability. Second, that the estimates of CH4 emission by the tracer technique appear to be suspect in trial T1 is probably traceable to an inappropriate usage of PR. Evidence for this is the anomalously high estimate of CH4 emission rate for this case (Table 1), together with the systematic disagreement between pre-calibrated PR and calculated PR (Table 3). In contrast, the facts that the chamber CH4 and the calculated PR in chamber CH4 estimates were not only similar, but were also highly correlated suggest that the most likely in-rumen PRs at the time of T1 were close to the calculated PRs rather than to the pre-calibrated PRs.
It is commonly assumed (Johnson et al., Reference Johnson, Huyler, Westberg, Lamb and Zimmerman1994a) that PR of SF6 from permeation tubes remains constant until the SF6 non-gaseous load is exhausted, resulting in a declining SF6 headspace pressure in the tube (Lassey et al., Reference Lassey, Walker, McMillan and Ulyatt2001). In this study, the permeation tubes used in trial T1 were retrieved after 397 days of deployment, with the trial taking place on days 250 to 270. Although the post-recovery PRs for these tubes were 78%, on average, of their pre-calibrated PRs, these two estimates of PR for each tube were highly correlated with each other. Moreover, post-recovery PRs and calculated PRs were indistinguishable, suggesting that changes in PR through time were systematic across the set of tubes used in this trial. These findings are in agreement with the observations by Lassey et al. (Reference Lassey, Walker, McMillan and Ulyatt2001) who monitored loss of mass from permeation tubes recovered from sheep or maintained in laboratory as controls for periods up to 750 days, and found that the rate of mass loss fell slowly over time in a manner well captured by a quadratic mass v. time curve, with non-linearity being ignorable for about the first 3 months after calibration. Lassey et al. (Reference Lassey, Walker, McMillan and Ulyatt2001) suggested that the most likely cause of non-linearity was the interaction between the SF6 gas and the surfaces of Teflon pores (the permeation medium), and accordingly, correction of PRs based on the performance of sibling tubes (maintained in the laboratory) was proposed when tube recovery was unavailable (Lassey et al., Reference Lassey, Walker, McMillan and Ulyatt2001).
One could argue that collection efficiencies for CH4 and SF6 might differ. While CH4 production and excretion from the rumen is associated with the feeding pattern (Johnson et al., Reference Johnson, Westberg, Lamb and Kincaid1998), and therefore varies throughout the day, the excretion rate of the released tracer gas (SF6) is presumed to remain constant throughout the day. As a result, the CH4/SF6 ratio in gases excreted through the mouth and nostrils could vary markedly throughout the day. However, because gas-mixing processes within the rumen headspace as well as during expulsion through the throat and the mouth or nose are highly turbulent, we would not expect such mixing to discriminate between CH4 and the nine-fold heavier SF6 molecules. Therefore, unless collection efficiency varies systematically throughout the day in sympathy with feeding patterns, we would expect the relative collection abundances of CH4 and SF6 to closely represent their relative emissions entrained in the ‘breath’. Nevertheless, it is possible that background sampling could be compromised in the very still air of an unventilated room in which ‘gravitational settling’ of heavier gases might introduce some stratification. A bias could then be introduced for those animals whose inefficient breath-collection provided CH4 or SF6 concentrations little higher than the measured background. However, our sample acceptance criteria would normally reject ‘breath’ samples that are close to background. Thus, while the building used in trial T1 had limited nocturnal ventilation, we do not believe that a bias was thereby introduced in our results.
Conclusions
The first trial (T1) of this study showed that the SF6 tracer technique produced much higher and less-consistent CH4 emission estimates than the calorimetry chamber technique. This was almost certainly due to the long time elapse between tube calibration and the trial in conjunction with a slow decline in SF6 PR. The post-recovery calculations of PRs of SF6 (post-recovery PR) and the estimation of PRs of SF6 based on chamber gas concentrations (calculated PR) support this deduction. However, when this long time elapse was avoided in trial T2, a good agreement between the two techniques for CH4 emission measurement was observed. The SF6 tracer technique is reliable for use in sheep provided that the trial takes place within about 4 to 6 weeks of pre-calibrating the permeation tubes. For tubes that have an unavoidable long residence in the rumen, a post-trial tube recovery and post-recovery PR would provide a more reliable estimator of PR at the time of trial. Whether the tracer technique is associated with extra variability or not remains to be established.
Acknowledgements
The authors acknowledge Mr J Purchas (Massey University) for his skilled assistance on the calorimetric chamber measurements, and Ms CF Walker and Mr AM McMillan (NIWA) who assisted with sample collection and GC analysis. This research was funded by the New Zealand Foundation for Research, Science and Technology and by the New Zealand Ministry of Agriculture and Forestry.