The group III-nitrides GaN, AlN, and InN have had tremendous impact on industry, enabling, for example, Blu-Ray® DVD technology, high-brightness, three-color LED displays, ultraviolet lasers, LEDs for replacement of incandescent lighting and high-power electronics.[Reference Khan1, Reference Mills2] They are also of interest for solar energy harvesting.[Reference Wu, Walukiewicz, Yu, Shan, Ager, Haller, Lu, Schaff, Metzger and Kurtz3] Here, we report the synthesis, by plasma-assisted vapor–liquid–solid epitaxy, of a direct gap semiconductor, ZnSnN2, which, with ZnGeN2 and ZnSiN2, forms an alloy semiconductor family with direct band gaps ranging from the ultraviolet to the deep red. These materials are of particular interest in part because they are closely related to the III-nitrides; their most stable, orthorhombic crystal structure is arrived at, conceptually, by replacing the wurtzite group III sublattice of the III-nitrides with an ordered pair of group II and group IV sublattices, with each nitrogen atom bound to two Zn and two group IV atoms, thus preserving nitrogen's octet rule.[Reference Punya, Lambrecht and van Schilfgaarde4]
The Zn–IV-nitrides are at an extremely early stage of development, comparable to the state of III-nitrides some four decades ago; to date, there are fewer than two dozen experimental reports on Zn–IV-nitride materials.[Reference Punya, Lambrecht and van Schilfgaarde4] Indeed, although ZnSiN2 and ZnGeN2 were first synthesized in 1970, synthesis of ZnSnN2 was not reported until more than 40 years later.[Reference Feldberg, Keen, Aldous, Scanlon, Stampe, Kennedy, Reeves, Veal and Durbin5, Reference Lahourcade, Coronel, Delaney, Shukla, Spaldin and Atwater6] Yet, Zn(Si,Ge,Sn)N2 has the potential to overcome many of the lingering materials problems in III-nitrides. For example, recent calculations predict that spontaneous polarizations of Zn–IV-nitrides should be much closer to each other than are those of III-nitrides.[Reference Paudel and Lambrecht7] As a consequence, there should be no need to grow along nonpolar crystallographic directions, a difficult and nonoptimal route, to avoid spontaneous polarization fields in heterostructures.[Reference Farrell, Young, Wu, DenBaars and Speck8] In addition, ZnSiN2 may be easier to dope than AlN, particularly p-type, which would be advantageous for development of shorter wavelength ultraviolet lasers. (A related case is that of ZnGeP2, the Zn–IV-P2 chalcopyrite analog to zincblende GaP, which has been shown by electron paramagnetic resonance to be p-type due to Zn vacancies, in contrast to GaP, which is typically n-type if nominally undoped.[Reference Halliburton, Edwards, Scripsic, Rakowsky, Schunemann and Pollak9] Furthermore, the close match in lattice parameters with III-nitrides makes possible the design of hybrid structures with III-nitrides. Thus, exploitation of Zn–IV-nitrides could lead to new applications arising from their unique properties. In addition, it is of note that the Zn(Sn,Si)N2 alloy system covers the ultraviolet to deep-red range of the spectrum entirely with abundant, nontoxic elements.[Reference Hurd, Kelley, Eggert and Lee10]
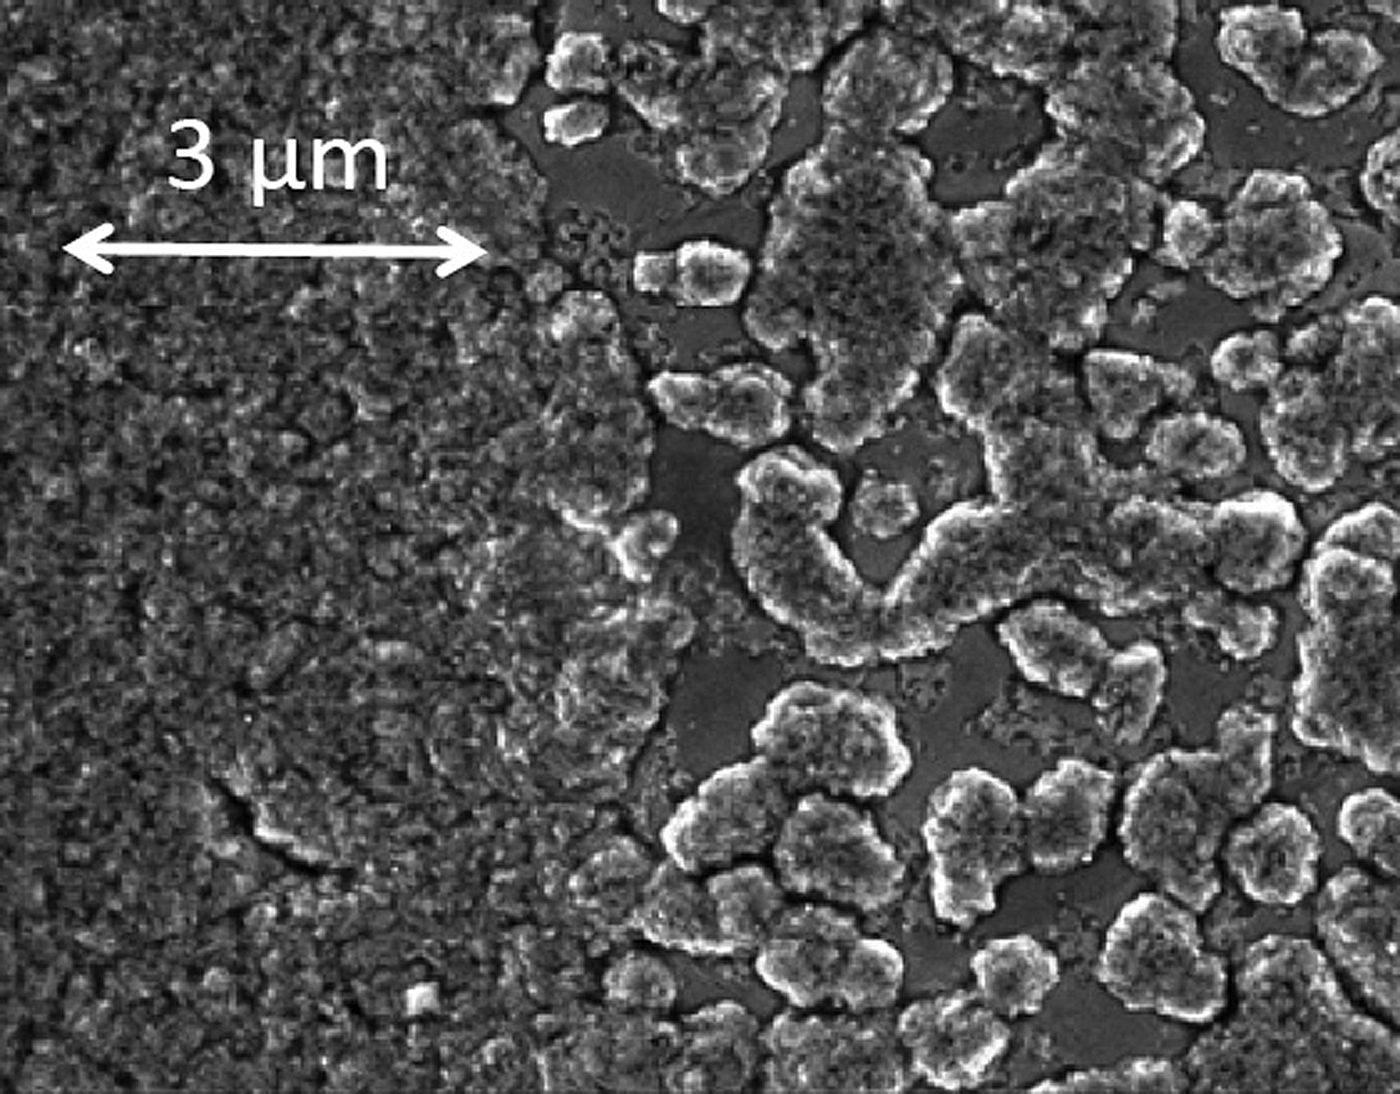
Here, we report the synthesis of ZnSnN2 by a vapor–liquid–solid method, and measurement of its lattice parameters and band gap. The synthesis was conducted in a stainless-steel vacuum chamber with a base pressure of 10−7 Torr. The Zn and Sn shot, 99.999% purity (metals basis), were refined of their native oxides and alloyed in a nitrogen glove box, then loaded into a custom crucible machined from hot-pressed boron nitride. Activated process gases, composed of grade 5 H2 provided by a Matheson Chrysalis II H2 generator and research grade 5.7 N2, at flow rates of 5 and 40 sccm, respectively, were directed to the surface of the melt from a microwave plasma source with a quartz tube positioned vertically above the crucible and located 1.5″ from the surface of the melt. The chamber pressure was kept at 30 mTorr, the optimal pressure for generation of N2* and the activated species important for growth.[Reference Myers, Millecchia, Ptak, Ziemer and Stinespring11] A series of growth studies were carried out for which the starting melt compositions varied between 8 and 45 at% Zn, and growth temperatures varied between 390 and 525 °C. Synthesis of ZnSnN2 was observed for melt compositions above 17 at% Zn and between 425 and 510 °C. These studies, which reveal interesting information about the Zn–Sn–N phase diagram, will be described more fully in a later work. The material used for the measurements reported here was grown at 485 °C from a melt with a starting composition of 25 at% Zn. Patches of polycrystalline ZnSnN2, with estimated average thicknesses of 250–350 nm, formed on top of the melt, as shown in the scanning electron microscope (SEM) image in Fig. 1, within 15 min. Auger chemical analysis showed equal ratios of Zn and Sn within experimental uncertainty.
A SEM image of the ZnSnN2 polycrystalline crust, with smooth underlying Zn–Sn alloy visible in some areas.

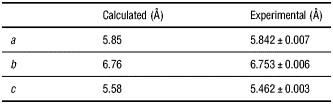
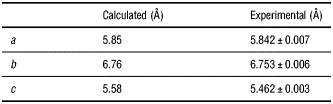
The X-ray diffraction (XRD) spectrum shown in Fig. 2 was taken on the as-grown sample using an X-ray diffractometer with Cu Kα (1,2) irradiation at small incident angle, focused to a 500 µm diameter spot size at the sample, and using a two-dimensional xenon detector with a step size of 0.02°. The average crystallite size, estimated from the [200] peak width using the Scherrer formula, is approximately 70 nm, consistent with the crystallite sizes discernible in the SEM image in Fig. 1. The fitted orthorhombic lattice parameters are listed in Table I along with the predicted values from Ref. Reference Punya, Lambrecht and van Schilfgaarde4.
Measured and calculated X-ray powder diffraction spectra. The peaks labeled # and * are from Sn and Zn, respectively. The Miller indices labeling the experimental peaks are orthorhombic indices.
Comparison of the experimentally determined lattice parameters with calculated lattice parameters from Ref. Reference Punya, Lambrecht and van Schilfgaarde4.
Two simulated powder diffraction spectra are shown in Fig. 2 as well, one for the orthorhombic lattice and the other for a wurtzite lattice calculated by setting the occupation probabilities of Zn and Sn each to ½ on the group III wurtzite sublattice.Footnote 1 While the predicted crystallographic structure for Zn–IV-nitrides is orthorhombic, a sufficient number of defects involving the exchange of Zn with a group IV atom on the Zn–IV sublattice would result in a wurtzite-like diffraction spectrum. Such disorder was invoked as a possible explanation for observation of strong density-of-states features in Raman spectra of single crystal ZnGeN2.[Reference Peshek, Paudel, Kash and Lambrecht12] In addition, recent investigations have shown that the XRD spectra of ZnGeN2 can be “tuned”, with growth conditions, from orthorhombic to wurtzite-like, and that the prominence of density-of-states features in the Raman spectra correlates, qualitatively, with the disorder measured by XRD spectroscopy.[Reference Blanton, Zhao, He, Shan, Zhao, Kash, Sablon, Heier, Tatavarti, Fu, Nuesch, Brabec, Kippelen, Wang and Olson13]
The absence of any peaks in the measured XRD spectrum unique to the calculated orthorhombic structure is consistent with the presence of disorder on the II–IV orthorhombic sublattice, yielding a “wurtzite-like” XRD spectrum. However, the peaks unique to orthorhombic symmetry are all relatively weak in comparison with the observed peaks, making it more difficult to detect the presence of disorder by XRD than is the case for ZnGeN2. Details of the calculations of both orthorhombic and wurtzite lattice parameters from the measured spectrum are included in the Supplementary materials.
Photoluminescence (PL) spectra were taken at room temperature in ambient atmosphere using a continuous-wave (CW) HeNe at 1.96 eV and a CW solid-state laser at 2.33 eV. The lasers were focused onto the sample to 1–2 µm diameter spot sizes by a ×50 objective. The radiation from the sample was collected by the same objective, passed through appropriate filters, and dispersed by a grating spectrometer (1200 g/mm grating blazed at 500 nm) equipped with a liquid-nitrogen-cooled silicon charge-coupled-detector (CCD). For the energy range of 1.25–1.75 eV, within which the PL spectra were measured from the samples, combined quantum efficiency of the CCD and the grating decreases approximately linearly from about 60% (at 1.75 eV) to 10% (at 1.25 eV). The raw PL spectrum is shown in Fig. 3. The PL peak was estimated to be near 1.4 eV when the sensitivity of the detector and collection efficiency of the optical setup were taken into account. We note that the shape of the PL spectrum was observed to be independent of the excitation energy from 103 to 106 W/cm2.
Photoluminescence (PL) and photoluminescence excitation (PLE) spectra of ZnSnN2. The PL spectrum was obtained using a CW solid state laser with 2.33 eV photon energy and not corrected for detection efficiencies of the spectrometer, CCD, and the optical setup. The PLE spectrum was taken using a picosecond laser, the integrated PL intensity interval (1), from 1.31–1.42 eV (empty squares), and the integrated PL intensity (2) from 1.65–1.68 eV (filled circles). The two empty triangles were taken with two CW lasers. All the PL intensities were normalized by excitation photon flux at the sample surface. The solid line is a fit to the PLE spectrum of intensity interval (2) (filled circles), as described in the text.
The band gap was determined using photoluminescence excitation spectroscopy (PLE). PLE spectra were taken with a supercontinuum fiber laser with a repetition rate of 40 MHz and pulse duration of a few picoseconds, using the optical setup described above for the PL measurements. Excitation radiation from 1.55 to 2.76 eV was wavelength-selected using a series of tunable narrowband filters with FWHM of 20 nm. The peak intensity at the sample surface was kept below 1.5 × 10⁸ W/cm2. Two filters were used to select two different portions of the PL spectrum, one from 1.65 to 1.68 eV, and another from 1.31 to 1.42 eV, for detection. Figure 3 shows the PLE spectrum, that is, the integrated PL intensity, normalized by the excitation photon flux, as a function of the excitation photon energy in the range of 1.55 to 2.76 eV. The two inverted triangles were taken using the two CW lasers, at intensities of approximately 1 kW/cm2. All other data were obtained using the picosecond light source with peak intensities approximately 5 orders of magnitude higher than for the CW measurements. For excitation intensities below 100 W/cm2, PL efficiency was observed to decrease as excitation intensity was reduced, indicating that recombination through nonradiative recombination channels became more important at these lower excitation intensities. The PLE spectrum for lower-energy PL (Fig. 3, empty squares) shows evidence of band tailing.
The solid curve in Fig. 3, obtained by fitting the function (E–E g)p to the PLE spectrum of the higher-energy PL, yields a band gap E g = 1.7 ± 0.1 eV, for various values of p, with the best fit p = 0.73 ± 0.04. This phenomenological fit is consistent with an absorption coefficient that reflects a square-root density of states, characteristic of a direct gap, combined with exciton enhancement of the absorption near the band gap. Our measured band gap is lower than the ~2 eV gaps determined by absorption spectroscopy for MBE-grown films[Reference Feldberg, Keen, Aldous, Scanlon, Stampe, Kennedy, Reeves, Veal and Durbin5] and by spectroscopic ellipsometry for sputter-deposited films.[Reference Lahourcade, Coronel, Delaney, Shukla, Spaldin and Atwater6] Punya et al. predicted a zero temperature band gap of 2.02 eV using quasiparticle self-consistent Green's function and screened Coulomb interaction (QSGW)[Reference Punya, Lambrecht and van Schilfgaarde4] and their calculated lattice parameters, and 1.8 ± 0.1 eV using QSGW and our measured lattice parameters. The latter is in particularly close agreement to our measured value at room temperature, especially considering that we expect a shift to lower energy of the order of 100 meV for T = 300 K.[Reference Lambrecht14]
We interpret broad PL peaking at 1.4 eV as defect luminescence, and the gap measured by PLE spectrum as intrinsic gap. Broad defect luminescence at energies below the band gap is commonly seen in both GaN and ZnGeN2.[Reference Du, Bekele, Hayman, Angus, Pirouz and Kash15, Reference Misaki, Tsuchiya, Sakai, Wakahara, Okada and Yoshida16] An alternative interpretation is that the luminescence is intrinsic and the band gap measured by PLE is blue shifted by band filling. This alternative cannot be ruled out but seems unlikely given that the PL and PLE spectra fit very poorly to a Fermi–Dirac function.[Reference Davydov, Klochikhin, Emtsev, Kurdyukov, Ivanov, Vekshin, Bechstedt, Furthmuller, Aderhold, Graul, Mudryi, Harima, Hashimoto, Yamamoto and Haller17]
This observation of luminescence from the newest Zn–IV-nitride opens up this family of alloy semiconductors to a broad range of optoelectronic applications. With this measurement of the lattice parameters and band gap of ZnSnN2 we can complete comparison of the band gaps and lattice parameters of II-nitrides and Zn–IV-nitrides, as shown in Fig. 4.[Reference Walukiewicz, Ager, Yu, Liliental-Weber, Wu, Li, Jones and Denlinger18, Reference Osinsky, Fuflyigin, Zhu, Goulakov, Graff and Schubert19] Further research is strongly warranted, as several interesting and unique properties, and a host of important applications, are anticipated for these materials.
The band gaps versus “a” lattice constants for III-nitrides and Zn–IV-nitrides and their alloys. Here, for appropriate comparison, the orthorhombic “a” lattice constants of Zn–IV-nitrides are divided by factor 2. Experimentally determined values for pure materials are shown by solid circles. III–V lattice constants, band gaps, and bowing parameters are from Ref. Reference Walukiewicz, Ager, Yu, Liliental-Weber, Wu, Li, Jones and Denlinger18 and references therein. The experimentally determined band gap of ZnGeN2 is taken from Ref. Reference Du, Bekele, Hayman, Angus, Pirouz and Kash15, that of ZnSiN2 is taken from Ref. Reference Osinsky, Fuflyigin, Zhu, Goulakov, Graff and Schubert19, and that of ZnSnN2 is from this work. Calculated values are shown by open circles.[Reference Punya, Lambrecht and van Schilfgaarde4] ZnSiN2 is predicted to be indirect gap; here both the indirect gap and the gap at Γ point are shown. The alloys ZnSi1−x(Ge,Sn)xN2 are predicted to be direct up to about x=0.6–0.7, or to a band gap of 4.5–4.6 eV, using interpolations of the band structures from Ref. Reference Punya, Lambrecht and van Schilfgaarde4. The bowing parameters for Zn–IV-nitrides are taken to be proportional to the differences in ternary band gaps, with the constant of proportionality set equal to that found for III-nitrides.[Reference Walukiewicz, Ager, Yu, Liliental-Weber, Wu, Li, Jones and Denlinger18]
Supplementary materials
For supplementary materials for this article, please visit http://dx.doi.org/10.1557/mrc.2013.19
Acknowledgments
This work was supported by the National Science Foundation grant nos. DMR-1006123 and DMR-0907477 and by the US Department of Education grant nos. P200A090276 and P200A070434. Construction of the synthesis apparatus was supported in part by the National Science Foundation grant no. DMR-0420765. Additional support for optical instrumentation was provided by National Science Foundation grant no. DMR-0349201.