Introduction
Major depression is experienced by 16% of adults in their lifetime, and it is reported to be the second leading cause of morbidity and mortality in adults between the ages of 18 and 44 years worldwide.Reference Kessler, Berglund and Demler 1 , Reference Murray and Lopez 2 Women of reproductive age are twice as likely to be afflicted as age-matched male counterparts, and most screening studies suggest that this risk is enhanced further during pregnancy and the postpartum period.Reference Gavin, Gaynes, Lohr, Meltzer-Brody, Gartlehner and Swinson 3 Approximately 10–20% of women will experience new-onset depression (major or minor) during pregnancy or post-partum, and 7–12% will satisfy the criteria for major depressive disorder (MDD).Reference Gavin, Gaynes, Lohr, Meltzer-Brody, Gartlehner and Swinson 3 – Reference Silva, Jansen and Souza 6
The ramifications of untreated depression during the perinatal period are well documented, and can be persistent and profound. Depressed pregnant women often suffer from poor prenatal care, and are vulnerable to substance abuse, miscarriage, and obstetrical complications.Reference Zuckerman, Amaro and Bauchner 7 – Reference Orr, James and Blackmore Prince 9 During the postpartum period, maternal depression has been associated with impaired infant bonding, marital discord, and cognitive and developmental delays in progeny.Reference Field, Hernandez-Reif and Diego 10 – Reference Zahn-Waxler, Iannotti, Cummings and Denham 14
There are several treatment modalities that appear to be effective for perinatal depression, including psychotherapy and medication.Reference Yonkers, Wisner and Stewart 15 Unfortunately, psychotherapy resources are not readily available or affordable for many women, and new or expecting mothers often find this intervention to be inconvenient as well.Reference Revicki, Siddique and Frank 16 – Reference Ko, Farr, Dietz and Robbins 18 Antidepressants have been demonstrated to be effective for perinatal depression in both clinical practice and investigational settings, but some researchers have voiced concerns about the safety of these medications, particularly in utero.Reference Yonkers, Wisner and Stewart 15 , Reference Ng, Hirata, Yeung, Haller and Finley 19 , Reference Domar, Moragianni, Ryley and Urato 20 However, a recent evidence-based report released by the National Academies and the Institute of Medicine (IOM) concluded that the risks of untreated depression far exceeded the risks of antidepressant medications both during pregnancy and postpartum. 21
In spite of these options, research evidence suggests that depression detection and treatment rates for new mothers may be significantly lower than those found in similar cohorts of nonpregnant women, and that these discrepancies were more prominent in lower socioeconomic groups or in women of Latino or African American descent.Reference Marcus, Flynn and Blow 22 – Reference Witt, Keller and Gottlieb 24 Authors of the IOM report noted that “treatment rates for new mothers were alarming low,” but also concluded that the body of evidence on this topic was considered preliminary, with most investigations featuring older data, small sample sizes, or limited methodological approaches. 21
The purpose of this investigation was to conduct a longitudinal analysis of depression detection and treatment rates in a contemporary population of new mothers who were continuously enrolled in the nation’s largest state Medicaid system (California State Medicaid, or Medi-Cal) in comparison to a cohort of nonpregnant women of similar age also receiving Medi-Cal services. In addition, we conducted a logistic regression analysis of demographic factors predicting either depression diagnosis or treatment during the perinatal period, and examined potential disparities in the rendering of healthcare services.
Methods
Data
The investigators were given access to administrative claims data from the state of California Department of Health Care Services for eligible subjects enrolled in the Medi-Cal fee-for-service program between January 1, 2006, and December 31, 2009. This data warehouse, known as the Managed Information System and Decision Support System (MIS/DSS), contained eligibility information, demographic data, and fiduciary claims for all medical services received by study subjects through the Medi-Cal system (eg, office visits and procedures with associated International Classification of Diseases, ninth revision (ICD-9) diagnostic codes). Prescription medication claims submitted to and reimbursed by the Medi-Cal program were available in the MIS/DSS database as well. All data were de-identified and encrypted prior to transmission from state agencies to researchers at the University of California at San Francisco (UCSF). This investigational protocol was approved by the California Health and Human Services Agency Data and Research Committee (DRC) and the Committee for the Protection of Human Subjects (CPHS), as well as the UCSF Committee on Human Research (CHR).
Study population
Eligible subjects consisted of women between the ages of 18 and 39 years old (on the index date) who had been continuously enrolled in the Medi-Cal fee-for-service program between January 2006 and December 2009. The perinatal cohort was composed of women with evidence of live birth occurring between October 2007 and March 2009. The control group consisted of women without evidence of pregnancy in the administrative dataset during this same time frame. The index date was defined as the date of birth for the perinatal cohort, and the control group was randomly assigned an index date (ie, birth date) for the purpose of conducting longitudinal comparisons. Women were excluded from the analysis if there was evidence of pregnancy without documentation of live birth (eg, presumed fetal demise as a result of therapeutic abortion, elective abortion, or miscarriage).
Outcomes
The investigators conducted a retrospective longitudinal cohort analysis of depression detection and treatment rates for perinatal and nonpregnant cohorts across 3 contiguous 9-month timeframes: prior to conception, antepartum, and postpartum. For the purposes of this investigation, the date of conception was assumed to occur exactly 9 months prior to the date of live birth, as evidenced by the first occurrence of an ICD-9 code indicating labor (or index date for control subjects).
The primary outcome of this analysis was diagnosis of depression during any or all of the 3 time frames, as evidenced by an ICD-9 code for any depressive illness as the primary or secondary diagnosis (293.83, mood disorder in conditions classified elsewhere; 296.2, major depression, single episode; 296.3, major depression, recurrent; 298.0, other nonorganic psychoses; 300.4, other dysthymic disorder; 309.1, adjustment reaction with prolonged depressive reaction; 311, depressive disorder; 648.4, mental condition during pregnancy).
Secondary outcomes included (1) pharmacy benefit claim for an antidepressant medication and (2) either an ICD-9 code for depression or pharmacy benefit claim for an antidepressant medication. This broader definition of depression was used as an additional secondary outcome to capture beneficiaries in whom depressive illness was not formally diagnosed or who may have been coded improperly. The subgroup of beneficiaries that received an ICD-9 diagnosis of any depression illness was further analyzed to ascertain treatment trends (eg, receipt of antidepressant prescription and/or psychotherapy services). Psychotherapy services were determined by ICD-9-CM procedure codes for the following services: 94.0 through 94.59 (with the exception of alcohol and drug rehabilitation related services, 94.45, 94.46, 94.53, or 94.54).
Statistical analyses
Demographic characteristics were compared across the 2 study groups and the excluded cohort (ie, women who gave birth, women who had no administrative evidence of pregnancy, and women who did not give birth but had evidence of pregnancy) using analysis of variance for comparison of age and χ2 tests for ethnicity and geographic residence. Because the study data was derived from a large administrative dataset, specific individual-level information was relatively limited. Consequently, adjustments could be made for potential effects of age (in quartiles), ethnicity (Hispanic, non-Hispanic white, African American, Asian), and geographic residence (urban, rural, frontier) only. For the purposes of this analysis, age was characterized as younger than 25 years (reference), 25–29 years, 30–34 years, and greater than 34 years.
The primary outcome—diagnosis of depression based on ICD-9 codes—was examined using unadjusted logistic regression analysis to obtain odds ratios and 95% confidence intervals. This analysis was repeated with adjustments for age, ethnicity, and geographic residence. Secondary outcomes (depression as defined by treatment with antidepressant medications, and depression as a composite of diagnosis or treatment with antidepressant medication) were likewise examined with logistic regression models.
Comparison of rates of depression across time periods between the 2 groups involved examining multiple observations per subject (one from each time period). Because observations within a person are generally correlated, we utilized generalized estimating equation (GEE) regression techniques to accommodate both within-person and between-person variability. GEE treats the additional variability as a nuisance factor, and adjusts the variance for the added correlation between observations while averaging over all subjects. Interactions between study groups (those who did and did not give birth) were examined to determine if time effects were different for the 2 groups, and models were adjusted for age, ethnicity, and geographic setting.
Demographic characteristics, including age quartiles, self-identified ethnic affiliation, and urbanization of setting (defined as urban, rural, or frontier based on zip codes associated with primary residence), were examined in univariate logistic regression models for both the primary and the composite depression outcome. A multivariate model was then constructed to determine the association between these 2 outcomes and the primary predictor—group defined by live birth—adjusted for these characteristics.
Treatment of depression within the cohort of women who received a depression diagnosis was examined by first creating 4 mutually exclusive categories: (1) received antidepressant medication only, (2) received psychotherapy only, (3) received both antidepressant medication and therapy, and (4) received neither. These were compared between the 2 cohorts using Fisher’s exact tests. Data specific to types of antidepressant medication prescribed were examined and summarized descriptively only.
Results
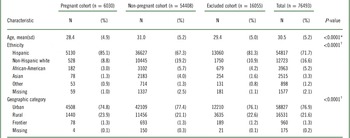
A total of 76,493 beneficiaries was identified who were between the ages of 18 and 39 years of age and continuously enrolled in the Medi-Cal fee-for-service program. The perinatal study cohort consisted of 6030 women with evidence of live birth. Of the remaining study population, 16,055 beneficiaries were excluded due to documented evidence of pregnancy during the observation period, leaving a total of 54,408 in the control or nonpregnant cohort. Table 1 summarizes the demographic characteristics of the entire population, including individual study cohorts as well as excluded subjects. In general, the population was primarily of Hispanic descent (72%, by self-report) living in an urban setting. After exclusion of those women who did not give birth but had some evidence of pregnancy, the controls eligible for analysis were younger than the cases on average, and less likely to be Hispanic.
Demographics of cohorts

* Calculated using analysis of variance (ANOVA).
† Calculated using χ2 test.
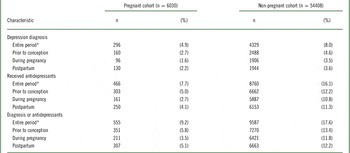
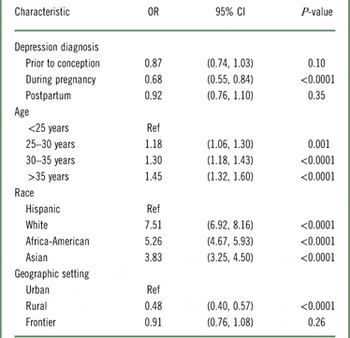
Rates of depression diagnosis, prescription of antidepressants, and either diagnosis or prescription of medications for the 2 groups are presented in Table 2. In GEE analysis adjusted for age, race, and geographic setting, the effect of pregnancy vs nonpregnancy was examined for the pregnancy period compared to the pre-pregnancy period, and the postpartum period compared to the pre-pregnancy period (given that period was defined by 3 categories, with the pre-pregnancy period as a reference). A significant interaction was found to occur in the first comparison, ie, between pregnancy period and pre-pregnancy period (p-value for interaction=0.03); that is, the effect of pregnancy vs nonpregnancy on depression diagnosis rates is different depending on whether the period in question is the 9 months of pregnancy or the 9 months prior to pregnancy. Whereas no difference was observed in the depression diagnosis rates between the 2 groups in the period prior to pregnancy (OR=0.87, p=0.10), a significant difference was observed during the actual pregnancy period, during which time pregnant women were 32% less likely to receive a depression diagnosis than nonpregnant women (OR=0.68, p<0.0001). This interaction was not observed to occur in the second comparison of postpartum period vs pre-pregnant period, however (p-value for interaction=0.65). Therefore, the effect of pregnancy vs nonpregnancy on depression diagnosis rates is the same in both the pre-pregnancy period and the post-pregnancy period, and is not significant (Table 3).
Rates of depression/anti-depressant use across study timeframes

* Period prior to conception through end of postpartum period.
Association of depression diagnosis with demographic risk factors—GEEFootnote * model

* GEE=generalized estimating equations.
Ref=reference group.
Age was independently and inversely associated with depression diagnosis; compared to the youngest women (<25 years), women in the oldest group (>34 years) were 1.5 times as likely to receive a diagnosis, women in the 3034– years group were 1.3 times as likely, and women from 2529– were 1.3 times as likely. All races were more likely to receive a diagnosis than Hispanic women and those living in urban environments were two times more likely to receive a diagnosis as those in rural environments.
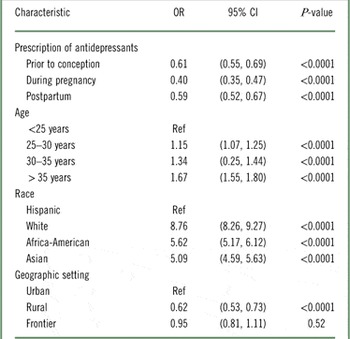
When an expanded definition of depression was used as an outcome (ie, in order to include those who were prescribed antidepressant medications in the “depressed” cohort), a similar pattern was seen, with an interaction present in the comparison of the 2 groups between the pregnancy and pre-pregnancy period, but not between the postpartum and pre-pregnancy periods (Table 4). However, the difference between the 2 study cohorts was significant in all 3 time periods, which is reflective of the fact that the pregnant cohort was much less likely to receive an antidepressant during any of the 3 periods than were those in the nonpregnant cohort (5% vs 12%, 3% vs 11%, and 4% vs 11% in the pre-pregnant, pregnant, and post-pregnant periods, respectively). The pregnant cohort, compared to the nonpregnant cohort, was 60% less likely to receive a diagnosis and/or be on antidepressants in the pregnancy period, and 40% less likely in the pre- and post-pregnancy periods.
An analysis of the subgroup of subjects receiving an ICD-9 code for depression further underscored the different treatment patterns for respective cohorts, and across time periods. During the pregnancy timeframe, 48% of the perinatal cohort diagnosed with depression received any treatment (medication or psychotherapy), as opposed to a 72% treatment rate for the depressed control group (p<0.0001).This discrepancy persisted through the postpartum period, when 56% of the depressed perinatal cohort received treatment versus 74% in the control group (p<0.0001). The use of psychotherapy was very rare throughout the study periods in both cohorts (eg, a total of 5 beneficiaries diagnosed with depression received psychotherapy during any time frame).
Association of depression diagnosis or antidepressant use with demographic risk factors—GEEFootnote * model

* GEE=generalized estimating equations.
Most of the subjects receiving antidepressants were prescribed agents from the selective serotonin reuptake inhibitor (SSRI) class, though antidepressant preferences appeared to change over time. Prior to pregnancy, 57% of the women in the perinatal cohort who received antidepressants were prescribed an SSRI, and the prevalence of SSRI use increased to 73% during pregnancy. SSRI use predominated during the postpartum period as well, with 68% of new mothers who received an antidepressant filling a prescription for an SSRI. The pattern of antidepressant utilization across classes remained relatively unchanged for the nonpregnant cohort through the 3 study periods. Sertraline was the antidepressant most commonly prescribed for both study cohorts and across all timeframes, accounting for 25% of antidepressants received by the perinatal cohort prior to conception, 29% during pregnancy, and 17% postpartum.
Discussion
This longitudinal investigation revealed significantly lower depression detection and treatment rates in a perinatal cohort of Medi-Cal beneficiaries than nonpregnant controls. This discrepancy was most pronounced during the 9 months of pregnancy itself, but significant differences were found between cohorts for the postpartum period as well. Within-group comparisons revealed a similar pattern, with significantly lower detection and treatment rates found during the pregnancy and postpartum periods than preconception. Among pregnant women formally diagnosed with depression, less than half (48%) received any treatment while expecting, and only 56% of the diagnosed pregnant cohort was provided medications or psychotherapy postpartum (vs 72% and 73% treatment rates for controls during pregnancy and postpartum; p<0.0001 for both comparisons).
Other investigations have also reported that depression is often undetected and untreated during pregnancy as well. Bennett et alReference Bennett, Marcus, Palmer and Coyne 23 analyzed Medicaid claims data from 1999–2000 for women previously identified with depression and reported that service use (antidepressant medications or mental health visits) declined significantly during pregnancy and postpartum, in comparison to a nonpregnant cohort receiving routine gynecological care. Flynn et alReference Flynn, Blow and Marcus 25 conducted diagnostic interviews among a select sample of 276 high-risk pregnant women and reported that 17% met criteria for an acute episode of MDD, and only 33% of these women were receiving any treatment. Witt et alReference Witt, Keller and Gottlieb 24 used national data from household surveys conducted between 1996–2005 and identified depression in 9.5% of the 2130 pregnant women studied. Approximately 62% of these depressed subjects received treatment during pregnancy, and only 35% received adequate care.
Overall, 1.6% of pregnant women received a diagnosis of depression while they were expecting during this investigation, a figure that is substantially lower than historical values reported in prospective screening studies. In a systematic review on the topic published in 2005, authors stated that “as many as 18.4% of pregnant women (p. 1076)” are depressed during their pregnancies, with up to 12.7% suffering from major depression.Reference Gavin, Gaynes, Lohr, Meltzer-Brody, Gartlehner and Swinson 3 This apparent underdiagnosis of depression in the present retrospective study may be explained, in part, by coding inaccuracies or omissions in claims data, a phenomenon which has been reported previously with mental illness.Reference Goodman and Tyer-Viola 26 – Reference Walkup, Boyer and Kellermann 28 However, even with a more liberal definition of detected depression (which included formal diagnosis or antidepressant prescriptions), only 3.5% of pregnant women were identified as depressed by providers, and this figure may be inflated somewhat by the inclusion of subjects being treated with antidepressants for anxiety disorders.
There are a wide variety of other factors that may also be contributing to depression being overlooked in the perinatal population, including patient, provider, and administrative barriers. Women in the perinatal population continue to express concerns about the stigma of mental illness, the safety of antidepressants in pregnancy and breastfeeding, and the cost and lack of access to specialized care.Reference Ko, Farr, Dietz and Robbins 18 , Reference Gjerdingen, Katon and Rich 29 – Reference Leddy, Haaga, Gray and Schulkin 31 While obstetricians/gynecologists strongly believe that it is their responsibility to manage perinatal depression and anxiety disorders (as opposed to a mental health referral), they have also identified time constraints and lack of training as major deterrents to appropriate management.Reference Dietrich, Williams and Ciotti 32 – Reference Palladino, Fedock, Forman, Davis, Henshaw and Flynn 36 The low detection and treatment rates in this study may also be influenced by the healthcare system itself. As other investigators have concluded, the consistent delivery of quality care to perinatal populations enrolled in public programs such as Medicaid is considerably more challenging than for beneficiaries enrolled in private HMOs or managed care, where treatment continuity and communication among specialty providers is emphasized.Reference Bennett, Marcus, Palmer and Coyne 23 , 37 , Reference Johnson 38
From our logistic regression analysis, we were also able to identify several demographic factors predictive of lower detection and treatment rates. Beneficiaries identifying themselves as Hispanic were much less likely than other ethnic groups (eg, African American, Asian, Caucasian) to be given a diagnosis of depression or receive antidepressants. This particular disparity has been consistently reported in other investigations involving pregnant or postpartum women, but it is not clear if this is evidence of a lower likelihood of developing depression or if it is due to cultural differences in the likelihood of women seeking care.Reference Ng, Hirata, Yeung, Haller and Finley 19 , Reference Bennett, Marcus, Palmer and Coyne 23 , Reference Witt, Keller and Gottlieb 24 , Reference Dietz, Williams, Callaghan, Bachman, Whitlock and Hornbook 39 – Reference Kozhimannil, Trinacty, Busch, Huskamp and Adams 41 In the National Comorbidity Survey—Replication (NCS-R) study, researchers measured the 12-month prevalence of depression in women living with children and reported that white populations had the highest percentage suffering from depression (11.5%) followed by Asian mothers (9.9%), non-Mexican Hispanics (9.3%), African Americans (7.0%), and Mexicans (5.3%).Reference Kessler, Berglund and Demler 1 Other studies have reported, however, that non-white women may have a higher threshold for seeking mental health care, as well as the fact that physicians are less likely to detect mental illnesses in non-white populations.Reference Borowsky, Rubenstein and Meredith 42 , Reference Kimerling and Baumrind 43
Younger subjects were also less likely to be diagnosed or treated for depression in our study, with the lowest prevalence rates found in the youngest population (<–25 years of age). This particular finding is also consistent with previous investigations, though the underlying reason(s) for this association are not forthcoming. It is possible that health literacy rates are lower in younger cohorts. An alternative explanation may have to do with the fact that older women of reproductive age are more likely to have had previous pregnancies and are more familiar with and susceptible to perinatal depression. As our database lacked comprehensive information on previous pregnancies, we were unable to analyze this association further.
The results of this investigation confirm previous research findings which have documented that depression is frequently overlooked and undertreated in perinatal populations in general, and specific subgroups appear to be particularly vulnerable as well. As noted previously, there are serious ramifications associated with untreated perinatal depression for new mothers, their babies, and the family unit as a whole, including medical and psychiatric comorbidities, increased morbidity and mortality, and longstanding influences upon the healthy development of offspring and their families.
From a population perspective, perinatal depression has emerged as a major health policy concern, with implications reverberating through clinical, administrative, and political domains. For example, the Patient Protection and Affordable Care Act (H.R. 3590) contains a provision advocating for further research into the causes, identification, epidemiology, and treatment of postpartum depression. 44 Improvements in detection methods for perinatal depression have been discussed in public health circles, but there is no consensus on how to proceed. Routine depression screening has been widely advocated in the general adult population, but a U.S. Preventative Services Task Force report on the subject concluded that these measures should only be implemented if a reliable healthcare system is in place to provide specialized services to newly identified cases. 45 In 2009, the World Health Organization recommended the implementation of universal depression screening for new mothers, but guidelines from the American College of Obstetrics and Gynecology published in 2010 concluded that there was insufficient evidence currently to support this intervention. 46 , 47 In practice, routine depression screening appears to be more common of late, with a recent survey of ob/gyn providers reported that 72% of the respondents screened their perinatal patients on a routine basis.Reference Leddy, Haaga, Gray and Schulkin 31 It is also worthwhile to note that one of the largest staff model HMOs in the United States has implemented a policy of mandatory depression screening twice during pregnancy (10 weeks and 30 weeks gestation) and at the time of the 6-week well-baby visit.
A variety of other interventions have been proposed to improve the outcomes of depressed mothers, including home visits, telecare, and community-based education and support, but few have been rigorously studied in the perinatal population. 21 There seems to be a general consensus, however, that systemwide changes are indicated to improve the access, quality, and continuity of care. 21 , Reference Gjerdingen, Katon and Rich 29 For instance, deficiencies in the coordination of care for new mothers may be largely responsible for low detection and treatment rates found in the postpartum period. 46 Typically, women will have their last visit with obstetricians approximately 6 weeks after delivery and may not have contact with another healthcare provider for many months afterward. The adoption of medical home models has been widely endorsed in modern healthcare, and the implementation of a similar program that encompasses the reproductive period may ensure adequate surveillance and access to resources, particularly if behavioral health specialists are routinely integrated into the treatment team.Reference LaRocco-Cockburn, Reed and Melville 48 Accommodations would have to be made, however, to ensure that such models were not only cost effective but also adaptable, culturally sensitive, and locally appropriate. 21
Advances in basic science research may also serve to facilitate improvements in the identification and management of perinatal depression. Investigations that examine the psychosocial and genetic influences underlying perinatal depression may serve to identify individuals who are uniquely at risk, and subsequently influence screening methods as well as recommendations regarding the duration and intensity of treatment modalities. Similarly, further research to examine the safety and efficacy of antidepressants during pregnancy and breastfeeding will serve to enlighten providers and patients, and ultimately reduce apprehensions that currently discourage women from seeking care. Web-based care and telemedicine are two other options under investigation that may serve not only to streamline treatment but also to improve access to counseling and other resources.
Strengths and Limitations
One of the strengths of this longitudinal investigation was that it permitted us to follow depression detection and treatment patterns for a perinatal population over time, as well as in comparison to a cohort of nonpregnant controls identified in the same database. In fact, to the authors’ knowledge, this is the first investigation to include both within-group and cohort comparisons of study outcomes for perinatal depression. Furthermore, this analysis also featured a relatively large dataset, containing recent patient-specific data from a population unlikely to be receiving services outside of this public health system.
There were a variety of limitations inherent in our investigation that are worthy of mention. For instance, the study population consisted primarily of young Hispanic women who were enrolled in a state Medicaid program and who reside in rural California settings. The results, therefore, are not necessarily generalizable to all populations of pregnant women living in the United States. Potential study weaknesses can also be found in the database itself, which was limited to beneficiaries who were continuously enrolled in fee-for-service plans. In recent years, there has been a rapid increase in Medi-Cal beneficiaries enrolled in the state’s managed care plans, and pregnant women may be affected preferentially by these insurance coverage shifts, raising the possibility of selection bias (ie, pregnant women may be more likely to become enrolled in managed care plans). However, during the time that study data were collected (2006–2009), the majority of Medi-Cal clients continued to be enrolled in the fee-for-service plans. A related limitation can also be attributed to the fact that we restricted our study population to continuously enrolled subjects, excluding the many beneficiaries who become eligible for the Medi-Cal program during their pregnancy and drop out of the program when coverage expires 60 days postpartum. Available demographic data were also limited in breadth and restricted the number of covariates included in our regression analysis. Ideally we would have preferred to have investigated and adjusted for additional demographic variables such as education, employment, marital status, and provider specialty. The retrospective nature of our study also limited the scope of primary outcomes we were able to analyze. For example, although utilization data strongly suggests an undertreatment of perinatal depression, we were not able to determine if this was due to patients not being offered treatment by their providers or if they elected to decline the intervention. The distinction would be of critical importance in proposing future interventions to improve outcomes.
The decision to exclude pregnant women lacking documented evidence of live births should also be noted. As our primary objective was to compare depression rates not only between study cohorts but also longitudinally through the reproductive phases, we elected to exclude women with (presumed) fetal demise because assumptions could not be made regarding conception dates or the associated postpartum period. Based on our comparison of study outcomes, it appeared in retrospect that detection and treatment rates for women in the excluded cohort more closely resembled the perinatal population (versus nonpregnant controls), but further investigation of this population is warranted.
Conclusions
Our investigation provides further evidence that pregnant women suffering from depression are less likely to be diagnosed or treated than nonpregnant controls. Even when depression is diagnosed, less than half of those afflicted receive any treatment for their illness—an oversight that has been associated with serious medical consequences and developmental repercussions. Similar deficiencies were also noted during the postpartum period that deserve attention, both from research and health policy perspectives.
This investigation also identified significant disparities in the delivery of healthcare services to certain subpopulations of pregnant women, including those of Hispanic descent, younger age, or living in an urban environment. Further research is indicated to explore potential barriers to care in these populations, as well as interventions that may overcome such obstacles. Efforts made to expand access to care and facilitate the coordination of care from early pregnancy through the postpartum period may also serve to improve perinatal outcomes.
Disclosures
Michelle Geier, Nancy Hills, Marco Gonzales, and Karoline Tum have nothing to disclose. Patrick Finley has the following disclosure: Neuroscience Education Institute, advisory board, honoraria.