Introduction
In Taiwan, 70.4% of the elderly population has at least one chronic condition (Chi et al., Reference Chi, Lee and Wu2011). Moreover, chronic conditions are common as well as depression as a mental health issue among middle-to-old adults (Vos et al., Reference Vos2012). It has been well established that there is a significant comorbidity of depression with chronic conditions (Goldney et al., Reference Goldney, Phillips, Fisher and Wilson2004; Rowan et al., Reference Rowan, Haas, Campbell, Maclean and Davidson2005; Tolea et al., Reference Tolea, Black, Carter-Pokras and Kling2007; Øverland et al., Reference Øverland, Knapstad, Wilhelmsen, Mykletun and Glozier2011; Tsai et al., Reference Tsai, Livneh, Lu, Tsai, Chen and Sung2013; Hung et al., Reference Hung2013; Cojocaru et al., Reference Cojocaru, Corina, Mitu and Szalontay2014; Perng et al., Reference Perng2014; De Ryck et al., Reference De Ryck2014). Depression leads to decrements in health compared with many chronic diseases. With the rapidly growing senior population and prolonged life expectancy, examining which kinds of chronic conditions have the greatest impact on older adults’ psychological burden and ascertaining the timing of the highest psychological burden (McCusker et al., Reference McCusker2016), as well as modifiable factors, demands attention.
A meta-analysis study reviewed the risk for depressive symptoms for an array of medical diagnoses, including hypertension, diabetes, heart diseases, stroke, lung diseases, and arthritis. It was found that the risk of depression over time after diagnosis increased in participants with heart diseases, stroke, and lung diseases (Huang et al., Reference Huang, Dong, Lu, Yue and Liu2010). However, existing research on the association between depression and chronic conditions has been limited by short-term evaluation or clinical samples with limited representativeness. In addition, social support (Uebelacker et al., Reference Uebelacker2013), socioeconomic status (Lorant et al., Reference Lorant, Deliège, Eaton, Robert, Philippot and Ansseau2003), physical limitations (Li et al., Reference Li2012), and comorbidities are factors related to increased risk of the onset, persistence, or worsening of depression; self-stigma is a significant concern for depressive symptoms, with chronic conditions across demographics (Schabert et al., Reference Schabert, Browne, Mosely and Speight2013); however, the extent to which these factors modify the depressive symptom trajectories associated with each condition lacks investigation.
To fill the gap in the current literature, our study evaluated changes in depressive symptoms over 11 years among participants diagnosed with different chronic conditions in order to identify both the average levels and timing of changes related to each chronic condition. The objectives of this analysis were (1) to estimate the differences in the average levels of and rate of change in depressive symptom trajectories after the diagnosis of chronic conditions, and (2) to examine the roles of socio-demographic and health-related factors in depressive symptoms.
Methods
Participants
Data were drawn from the Taiwan Longitudinal Study on Aging (TLSA). The original cohort comprised 4,049 participants aged ≥60 years old recruited in 1989 and re-interviewed every three to four years. In 1996 and 2003, the survey was supplemented with another 2,462 and 1,599 participants aged 50 to 66 years, respectively. Full details regarding the recruitment procedures in the TLSA have been described previously (Chiu et al., Reference Chiu, Wray and Ofstedal2011). Our analytic sample was drawn from the 1996, 1999, 2003, and 2007 interview waves. To reduce the potential confounds of extreme values, we excluded participants who had lost their partners in the last year of any interview wave (n = 113). In addition, participants reported without any chronic condition in 2003 were also included in our analyses. A total of 6,535 participants aged 50+ years old were included at the baseline. This selection yielded a final analytic sample of 1,207 participants diagnosed with hypertension, 499 with diabetes, 681 with heart diseases, 160 with stroke, 57 with cancer, 432 with lung diseases, 850 with arthritis, 691 with gastric conditions, and 234 with liver diseases in 1996. The new recruitments in 1999, 2003, and 2007 are presented in Appendix A.
Measures
Chronic conditions
We elicited information about chronic conditions by responses to the question “Have you been diagnosed with hypertension, diabetes, heart diseases, stroke, cancer, lung diseases, arthritis, gastric conditions, or liver diseases by a physician?,” from which a dichotomous measure was obtained. In addition, the “duration” after diagnosis was recorded, including (1) a self-reported chronic condition in 1996, 1999, 2003, and 2007 (i.e. the duration equaled an additional three years in 1999, an additional seven years in 2003, and an additional 11 years in 2007) and (2) the duration of the participants’ new diagnosis made between 1999 and 2007 (i.e. if participants were diagnosed with a chronic condition in 1999, the duration after diagnosis was presumed to be an additional two years (rounding up 1.5 years) in 2003 and 2007, which equaled six years and ten years, respectively). Different chronic diseases were collected separately and were followed up until 2007.
Depressive symptoms
We measured depressive symptoms using the 10-item short form of the Centers for Epidemiological Studies-Depression (CES-D) scale (Radloff, Reference Radloff1977), with scores ranging from 0 to 30. The scale has previously been deemed a reliable and valid measurement tool for older adults in Taiwan. The inherent validity of the scale evaluated by the ROC curve and the score yielded a specificity of 0.93 and a sensitivity of approximately 0.96 (Chang and Weng, Reference Chang and Weng2013). Cronbach's α reliability coefficients in the 1999 and 2003 surveys were 0.84 and 0.86, respectively (Seplaki et al., Reference Seplaki, Goldman, Weinstein and Lin2006). Moreover, complete data from the short form of the CES-D scale from at least one follow-up was added to our data. For example, if participants reported suffering from diabetes for four years in 1996, depressive symptoms after diagnosis with diabetes contributed by this person were 4, 7, 11, and 15 years in 1996, 1999, 2003, and 2007 separately. Therefore, the changes in depressive symptoms as the chronic disease progressed were evaluated after gathering this information.
Covariates
Socio-demographic and health-related variables that may interfere with depressive symptoms were measured at each wave and modeled as time-varying covariates. Socio-demographic variables included age (center to age 66 years, the mean age in 1996), gender, education level (“0 years,” “1 to 6 years,” “≧7 years”), economic satisfaction (“satisfied,” “fair,” “unsatisfied”), and marital status (“married or with a partner” or “separated, divorced, widowed, or never married”). Health-related variables included comorbidities and physical limitations. Comorbidities were determined from a count of chronic conditions common in midlife and at older ages that the participants indicated they had been diagnosed with, with scores ranging from 0 to 8. Physical limitations were assessed with six Nagi strength and mobility activities (SZ, Reference SZ1976), with scores ranging from 0 to 21. Psychiatric conditions were identified with the CES-D(scores≧10 defined as depression). The study revealed the tentative cut-off score 10 of the CES-D for identifying depression (Chang and Weng, Reference Chang and Weng2013).
Data analyses
We used Pearson's χ 2 tests and t-tests to make a comparison between the characteristics of participants who were chronic condition sufferers and those who were non-sufferers. To examine the depressive symptom trajectories at diagnosis and over time, we employed multilevel modeling (MLM) (Bryk and Raudenbush, Reference Bryk and Raudenbush1987) with SAS version 9.3 (SAS Institute, Inc., Cary, NC) and computed separate models for each chronic condition. MLM is flexible in accommodating an unbalanced research design, and such flexibility ensured that participants who missed one or more measurement points during the follow-up period would be included in the analyses. As MLM has the capacity to efficiently control for time-varying covariates in the levels of and changes in long-term health trajectories, MLM was used to analyze variables measured at multiple points in time to examine patterns of change in participants’ depressive symptoms after being diagnosed with a chronic condition.
Before building a model, we examined the intercept only (unconditional), linear, quadratic, and cubic growth curve models to determine which one best characterized a time model of depressive symptoms after a chronic condition diagnosis in midlife and older adulthood. A deviance test was used to evaluate the model fit of each nested model. After examination, the quadratic curve model best fit participants diagnosed with hypertension; the linear time model best fit participants diagnosed with diabetes, heart diseases, or arthritis; and the unconditional growth curve model best fit new sufferers diagnosed with stroke, cancer, lung diseases, gastric conditions, and liver diseases. These patterns best characterized the depressive symptom trajectories in regard to assessing the duration of suffering from a chronic condition. Within each health outcome, three models were built. Model 1 incorporated a chronic condition and the duration of that chronic condition: The intercept coefficient represented the average level of depressive symptoms at diagnosis; the slope coefficient represented the linear rate of change over time after being diagnosed; and the coefficient for the quadratic term represented accelerated increase or decrease per year. Model 2 added socio-demographic variables and their interaction effect with time to evaluate the effect of socio-demographic factors, including age, gender, education level, marital status, and economic satisfaction. Model 3 added health-related variables, which were treated as time-varying factors. We controlled for comorbidities and physical limitations to determine the net effect of each chronic condition on depressive symptoms. In addition, we controlled for psychiatric condition in Model 4, in which depression was identified with the CES-D. Data analyses were completed in 2015.
Results
Descriptive results
Table 1 presents the socio-demographics of the participants, as well as the associations of the demographic factors with the CES-D scores from the baseline. The participants diagnosed with stroke, heart diseases, or lung diseases were the oldest in age, and their mean ages were 69.73, 69.15, and 68.76, respectively. Females comprised a higher proportion of those diagnosed with hypertension, diabetes, heart diseases, stroke, lung diseases, or arthritis. Education level was lower for the participants with diabetes, heart diseases, arthritis, or liver diseases. For each condition, depressive symptoms were all statistically higher in those with comorbidities, except for participants with liver diseases. In addition, participants with comorbidities had significantly higher physical limitations. The highest depressive symptoms scores were 9.60 (SD = 6.96) for stroke diagnosis, followed by cancer (M = 8.50, SD = 7.70), and lung diseases (M = 8.33, SD = 7.00).
Sample socio-demographics of adults with and without the selected nine conditions, TLSA 1996

Boldface indicates statistical significance (p < 0.05).
Trajectories of different chronic conditions
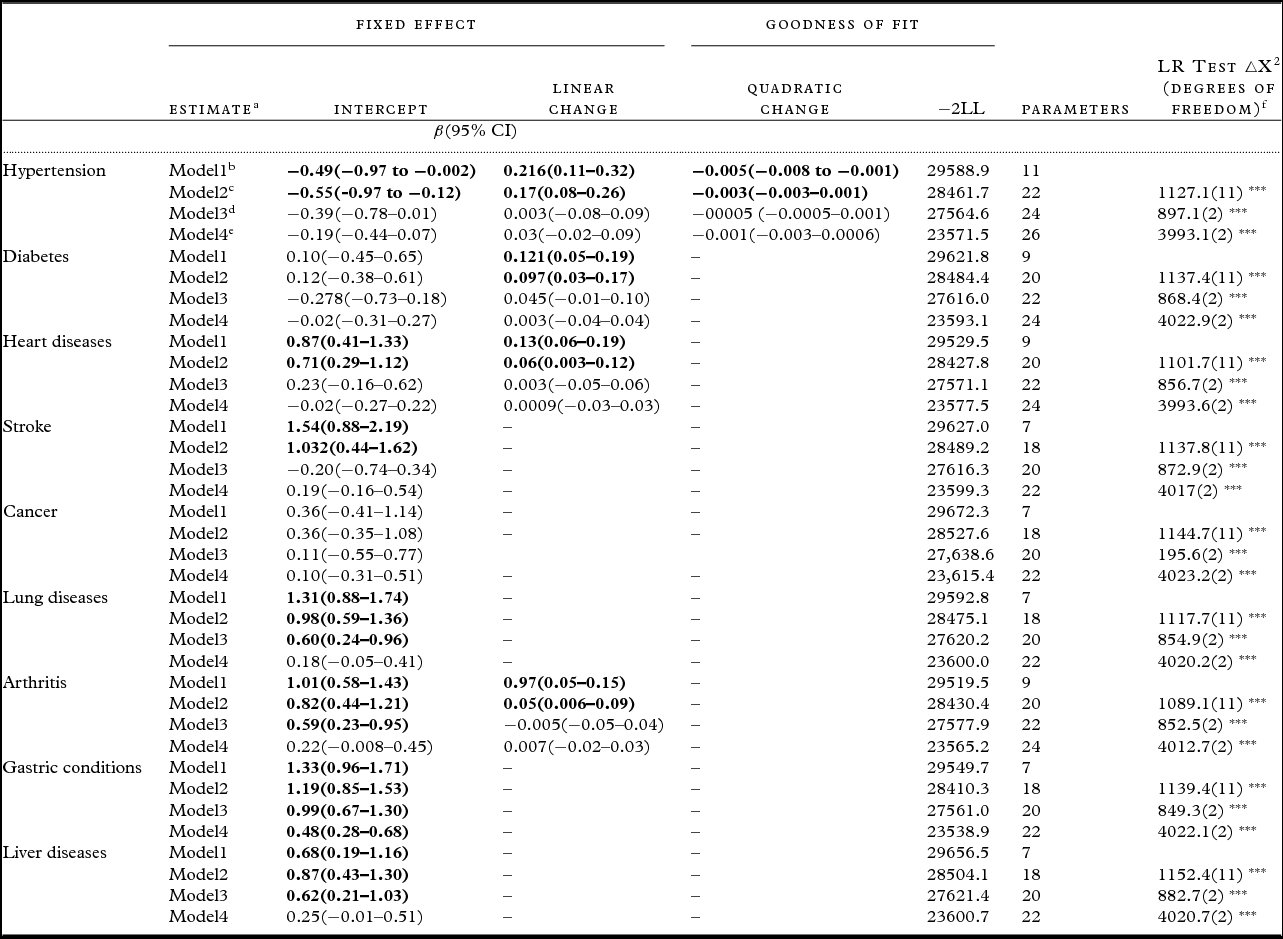
Table 2 presents the depressive symptom trajectories for participants diagnosed with different chronic conditions over time. In Model 1, the intercept represented the estimated average level of depressive symptoms at diagnosis compared with non-sufferers of comparable age. We found that participants with stroke (β = 1.54, 95% CI = 0.88–2.19), lung diseases (β = 1.31, 95% CI = 0.88–1.74), gastric conditions (β = 1.33, 95% CI = 0.96–1.71), or liver diseases (β = 0.68, 95% CI = 0.19–1.16) had higher depressive symptoms than their counterparts without these conditions. Moreover, the estimated linear rate of change after diagnosis of hypertension, for each additional year, was 0.22 (95% CI = 0.11–0.32), and the estimated quadratic rate of change per year was −0.005 (95% CI = −0.008 to −0.001). The rate of increase per year of depressive symptom scores was 0.12 (95% CI = 0.05–0.19), 0.13 (95% CI = 0.06–0.19), and 0.97(95% CI = 0.05–0.15), respectively, after a diagnosis of diabetes, heart diseases, and arthritis. These positive and significant slopes indicate a cumulative psychological burden for participants diagnosed with hypertension, diabetes, heart diseases, or arthritis.
Time trajectories of depressive symptoms (CES-D scores ranging from 0 to 30) after diagnosis for each condition (parameter estimate based on multilevel modeling)

Boldface indicates statistical significance (p < 0.05).
a The intercept represented the estimated average level of depressive symptoms at diagnosis compared with non-sufferers of comparable age; the linear change coefficient represented the linear rate of change over time after being diagnosed; and the quadratic changes coefficient for the quadratic term represented accelerated increase or decrease per year.
b Model1: Chronic condition and chronic condition × duration after diagnosis.
c Model2: Model1+age, gender, education level, marital status, and economic satisfaction.
d Model3: Model2+comorbidities and physical limitations over time.
e Model4: Model3+psychiatric condition (defined depression as CESD≧10).
f The addition of variables in Model 2–4 accounted for a substantial amount of the variance in the depressive trajectory.
Model 2 controlled for socio-demographic variables, including age, gender, education level, marital status, and economic satisfaction, to evaluate possible self-stigma effects and to determine the net impact of chronic conditions on depressive symptoms. The pattern of depressive symptoms did not differ between Model 1 and Model 2. However, the inclusion of socio-demographic variables in these chronic conditions accounted for a substantial amount of the annual changes in the depressive symptom trajectories – 22.72% (0.22−0.17/0.22) in hypertension, 19.83% (0.121–0.097/0.121) in diabetes, 54.84% (0.13–0.06/0.13) in heart diseases, and 94.84% (0.97–0.05/0.97) in arthritis – suggesting that socio-demographic variables explained the 22.72% to 94.84% difference in depressive symptoms after diagnosis of these four chronic conditions.
Model 3 represented the impact of each chronic condition on depressive symptoms based on time-varying comorbidities and physical limitations. Depressive symptoms in participants with gastric conditions (β = 0.99, 95% CI = 0.67–1.30), liver diseases (β = 0.62, 95% CI = 0.21–1.03), lung diseases (β = 0.60, 95% CI = 0.24–0.96), or arthritis (β = 0.59, 95% CI = 0.23–0.95) remained significantly higher after diagnosis compared with their counterparts of comparable age, indicating that those diagnosed with these chronic conditions may be more depressed, regardless of their comorbidities and physical functions. For participants with hypertension, heart diseases, or stroke, significant depressive symptoms disappeared after controlling for comorbidities and physical functions. These results indicate that baseline comorbidities and physical limitations are crucial factors in these conditions. Similarly, in participants diagnosed with hypertension, diabetes, heart diseases, or arthritis, the positive and significant slope disappeared after controlling for these covariates. The inclusion of comorbidities and physical functions in these chronic conditions accounted for a substantial amount of the average level of the depressive symptom trajectories –16.82% (1.189–0.989/1.189) in gastric conditions, 28.55% (0.865–0.618/0.865) in liver diseases, 38.34% (0.978–0.603/0.978) in lung diseases, and 28.03% (0.824–0.593/0.824) in arthritis – suggesting that comorbidities and physical functions explained the 16.82% to 38.34% difference in depressive symptoms after diagnosis of these four chronic conditions.
After controlling for psychiatric condition in the Model 4, the possible effects of the net impact of chronic conditions diagnosis were revealed. These effects remained robust after controlling factors for participants diagnosed with gastric conditions (β = 0.48, 95% CI = 0.28–0.68). These results indicate that psychiatric condition plays an important role in baseline depressive symptoms among participants diagnosed with lung diseases, arthritis, or liver diseases.
Discussion
This is the first long-term population-based study that has compared the depressive symptom trajectories of disease diagnoses across different commonly observed chronic conditions in middle-aged and older adults considering the normal aging process. Among the nine chronic conditions we examined, four patterns of depressive symptom trajectories were identified: (1) elevated depressive symptoms after diagnosis that worsened over time for participants diagnosed with heart disease or arthritis; (2) elevated depressive symptoms after diagnosis with no worsening over time for participants diagnosed with stroke, lung diseases, gastric conditions, or liver diseases; (3) no elevated depressive symptoms after diagnosis but an increase in depressive symptoms over time for participants diagnosed with diabetes; and (4) no significant patterns for participants diagnosed with cancer. These findings provide information for caregivers in addressing psychological burden at different times for different conditions.
Existing literature featuring survival analysis has indicated the risk of depressive symptoms associated with multiple medical diagnoses (Polsky et al., Reference Polsky2005), where the prevalence of adults with chronic conditions as well as depressive disorders is expected to be higher. (Vos et al., Reference Vos2012). Although previous studies have facilitated an understanding of depressive symptoms associated with chronic conditions, they have not provided an understanding of the extent to which depressive symptoms change over the course of the normal aging process (Huang et al., Reference Huang, Dong, Lu, Yue and Liu2010). Our study method enabled us to efficiently control for missing data and time-varying covariates on the levels of and changes in depressive symptoms while considering the age effect over time. In addition, by comparing nested models, we evaluated both the individual and synergistic effects of each chronic condition with socio-demographics, comorbidities, and physical limitations.
Previous studies have reported that stigma is a significant concern for adults with chronic conditions across demographics (Schabert et al., Reference Schabert, Browne, Mosely and Speight2013), but people with better socio-demographic status experience were found to exhibit decreased severity of psychological burden after being diagnosed with a chronic condition. Our results echo these findings in that stigma associated with socio-demographics, including education level, marital status, and economic satisfaction, may influence the degree of depressive symptoms at the baseline and over time. For example, we found that socio-demographic status explained 33% of depressive symptoms associated with stroke diagnosis ((1.54–1.03)/1.54 = 33%).
Findings suggesting a short-term relationship between depressive symptoms and chronic conditions may have been confounded by comorbidities and physical limitations (Horne et al., Reference Horne2013; Hung et al., Reference Hung2013; Dima-Cozma et al., Reference Dima-Cozma, Mitu, Szalontay and Cojocaru2014; De Ryck et al., Reference De Ryck2014). Moreover, prior studies have shown that the development of physical limitations significantly increases the risk for depressive symptoms (Li et al., Reference Li2012). By controlling for comorbidities and physical limitations, the intercept became non-significant in participants with hypertension, heart diseases, or stroke, suggesting that the baseline comorbidities and physical limitations determined the original depressive symptoms. Similarly, although participants diagnosed with hypertension, diabetes, heart diseases, or arthritis tended to have increasing depressive symptoms over time, a result similar to previous studies investigating depressive symptoms in adults with hypertension (Polsky et al., Reference Polsky2005; Huang et al., Reference Huang, Dong, Lu, Yue and Liu2010), our results showed that after controlling for health-related factors, the increasing level of depressive symptoms disappeared, suggesting that the increasing burden of these chronic conditions on depressive symptoms were proxies associated with comorbidities or physical limitations. This finding highlights the importance of preventing the deterioration associated with comorbidities and physical limitations over time in adults diagnosed with these chronic conditions. Moreover, after controlling for psychiatric condition, the baseline depressive symptoms became non-significant in participants with lung diseases, arthritis, or liver diseases, suggesting that psychiatric condition determined the original depressive symptoms after diagnosis with these chronic conditions. However, participants diagnosed with gastric conditions suffered more depressive stress, a finding that is supported by a previous study, where the results revealed that psychiatric conditions are positively associated with gastric diseases (Øverland et al., Reference Øverland, Knapstad, Wilhelmsen, Mykletun and Glozier2011). Further research examining the mechanisms underlying this link is therefore warranted.
The strength of our study lies in a comprehensive design used to investigate the mental outcomes relevant to dynamic changes, based on a “life course perspective,” which accounted for individual differences by controlling for socio-demographic and health-related factors over an 11-year period. In addition, different from the cross-sectional and short-term designs in most of the previous studies on this topic, our study provides information on prospective depressive symptom trajectories via measurements at multiple points over time after a chronic condition diagnosis. We also examined multiple chronic conditions to compare how long-term depressive symptoms change for different chronic conditions. In addition, this analysis provides new insights into the extent to which existing findings can be generalized to a non-Western population.
Some limitations exist and should be considered in the interpretation of the current findings. One issue relates to self-reported data on chronic conditions. Although the accuracy of the assessment of self-reported data has shown a high level of consistency in terms of self-reported chronic conditions and other biological variables (Goldman et al., Reference Goldman, Lin, Weinstein and Lin2003), participants who are not on medication for a chronic condition may not recall that they have been told that they have a chronic condition, and thus a certain bias may exist. In addition, although our study was based on a national database that measured the depressive symptoms of the same participants every three to four years, which enabled an investigation of changes in depressive symptoms over time in a heterogeneous population, subtle changes in depressive symptoms may have been missed during those intervals, which could have led to an underestimation of the effects of the chronic conditions under consideration. In addition, chronic conditions are mostly associated with increased mortality, so there may be a survivorship bias. In order to minimize survivorship bias, we used MLM, which has the flexibility to ensure that participants who missed one or more measurement points during the follow period were still included in the analyses. Future work is needed to further this understanding about the depression trajectories preceding death by linking TLSA to the Taiwan Cause of Death Dataset. Finally, we did not examine other factors that might have confounded the relationship between depressive symptoms and chronic conditions, such as sleep disturbance, level of exercise (Ku et al., Reference Ku, Fox, Chen and Chou2012), self-stigma with appropriate questionnaire evaluations (Schabert et al., Reference Schabert, Browne, Mosely and Speight2013), and other predictors, including healthcare utilization, cognitive deficits, and social support (Uebelacker et al., Reference Uebelacker2013), which have been associated with disease severity and mental health in previous literature. To address this issue, a sensitivity analysis controlling for exercise habits, hypnotic drugs, and social support were performed. The inclusion of these factors did not change the findings from the main analysis, and thus the data are not provided. However, we suggest that future research include these factors to further our understanding is this line of research.
Conclusion
In conclusion, with empirical data from a national representative sample from Taiwan, this study showed that, independent from socio-demographic, comorbidity, and physical limitation factors, participants with gastric conditions, liver diseases, lung diseases, or arthritis were significantly more depressed after diagnosis compared with non-sufferers. In participants with hypertension, heart disease, or stroke, the baseline comorbidities and physical limitations determined the original depressive symptoms. Cumulative psychological burden over time was significant for participants diagnosed with hypertension, diabetes, heart diseases, or arthritis. However, these effects disappeared after controlling for comorbidities and physical limitations. Our study sheds light on the importance of addressing psychological burden in adults with chronic conditions, especially those with comorbidities. Current guidelines for medical care should incorporate psychological treatment to achieve better care and prevent further disability, especially for those with gastric conditions, liver diseases, lung diseases, or arthritis.
Conflict of interest
None.
Description of authors’ roles
Ching-Ju Chiu guided the study design, statistics, and discussion, had full access to all of the data in the study, and took responsibility for the integrity of the data and the accuracy of the analysis and discussion. Yu-Ching Hsu reviewed the literature, analyzed the data, and wrote the paper. Shuo-Ping Tseng contributed to the discussion.
Acknowledgments
This work was supported by the Ministry of Science and Technology (P.I.: 103-2314-B-006-038-MY3). An earlier version of this paper was presented at the 34th Annual Meeting of The Society of Behavioral Medicine, San Francisco, CA, March 20–23, 2013.
Appendix A. Flowchart for the 1996–2007 TLSA