INTRODUCTION
The temporal and spatial configuration of consumers in relation to resource abundance and availability is a central theme within ecology (Heck & Valentine Reference HECK and VALENTINE2006). Herbivores may respond to changing food plant availability through migration (Nolet et al. Reference NOLET, LANGEVOORD, BEVAN, ENGELAAR, KLAASEN, MULDER and VAN DIJK2001), aggregation (Bos et al. Reference BOS, VAN DE KOPPEL and WEISSING2004) or through demographic compensation (Jefferies et al. Reference JEFFERIES, KLEIN and SHAVER1994). Conversely, herbivores have the ability to alter plant community structure through over-consumption or altered competitive interactions (Jefferies & Rockwell Reference JEFFERIES and ROCKWELL2002).
Theory on plant–herbivore interaction is based principally on the (predator–prey) work of Buzz Holling (Holling Reference HOLLING1959a, Reference HOLLING1959b) and Rosenzweig & MacArthur (Reference ROSENZWEIG and MACARTHUR1963), and is conceptually well developed. Hypotheses have been confronted with field data, with studies showing herbivore functional and numerical response (Belanger & Bedard Reference BELANGER and BEDARD1994), negative feedback-loops where herbivores are the principal driver of change in plant populations (Brathen et al. Reference BRATHEN, IMS, YOCCOZ, FAUCHALD, TVERAA and HAUSNER2007, Jefferies & Rockwell Reference JEFFERIES and ROCKWELL2002), or even positive-feedbacks where herbivores promote food plant abundance (Prins & Nell Reference PRINS and NELL1990). Functional response describes an increase in food consumption as resource density increases, and numerical response describes a density-dependent increase in herbivore abundance, concomitant to increases in food availability (Holling Reference HOLLING1959a, Reference HOLLING1959b). Numerical response is difficult to parameterize, however, in highly mobile individuals typical of many herbivore populations. Spatial aggregation, conversely, is a spatial-temporal behavioural response in order to increase herbivore feeding opportunity (Bos et al. Reference BOS, VAN DE KOPPEL and WEISSING2004).
Further, the transient nature of terrestrial herbivores may allow refuge to plants and thereby opportunity to regenerate (Rowcliffe et al. Reference ROWCLIFFE, SUTHERLAND and WATKINSON1999). Indeed, the variation in food plant availability drives herbivore dispersal, with evidence of departure thresholds (point at which low food availability forces migration; Vickery et al. Reference VICKERY, SUTHERLAND, WATKINSON, LANE and ROWCLIFFE1995).
Abundant, large-bodied waterfowl are known to influence food plant community composition and distribution (Badzinski et al. Reference BADZINSKI, ANKNEY and PETRIE2006), and are in turn constrained by available resources (Jefferies et al. Reference JEFFERIES, KLEIN and SHAVER1994). To date, waterfowl-habitat research has been based principally in high-latitude regions, with little information on tropical waterbirds. Thus, while the theory on plant–herbivore interactions is well documented, application of knowledge to disparate systems requires that site- or region-specific knowledge is acquired on critical interactions.
The magpie goose (Anseranas semipalmata), a native to Australia and New Guinea, is almost entirely dependent on sub-coastal wetlands (Frith & Davies Reference FRITH and DAVIES1961). During the tropical dry season, magpie geese gather on seasonal floodplains, ostensibly to forage for the tubers of the sedge Eleocharis dulcis (Whitehead Reference WHITEHEAD1998). In these environments, the large, long-legged birds grub with their heavy bills in glutinous clay soils, and so are potentially limited by the depth of water. Although research on geese has not explicitly shown the type and strength of the relationship, there is evidence to suggest an aggregative response (Whitehead Reference WHITEHEAD1998). Moreover, there may be a migration threshold when floodplains dry prior to monsoonal rains (Frith & Davies Reference FRITH and DAVIES1961). Indeed, the tropical system is analogous to temperate staging areas used by the Canada goose (Branta canadensis), where seasonal aggregative response by birds does not appear to alter food plant community composition (Badzinski et al. Reference BADZINSKI, ANKNEY and PETRIE2006, Timmermans et al. Reference TIMMERMANS, BADZINSKI and INGRAM2008). Similar to temperate systems, the tropical floodplains of northern Australia sustain herbivores, for a limited period (Frith & Davies Reference FRITH and DAVIES1961).
Given the importance of site- and species-specific understanding of population-level interactions, we set out to determine (1) the drivers of the spatial aggregation response by magpie geese to seasonal floodplains; (2) potential impact of goose predation on E. dulcis abundance; (3) a possible departure threshold and the causes of this; and (4) potential gains in body condition by geese during the period of predation on E. dulcis. To test these (1–3), we develop a ‘global model’ explaining the nature and extent of goose–wetland interaction, with candidate ‘sub-models’ representing explicit hypotheses, anchored in ecological theory. We avoid the falsification of hypotheses, and instead, a priori model formulation is used to address a biological problem using a non-dichotomous, ‘strength of evidence’ approach (Burnham & Anderson Reference BURNHAM and ANDERSON2001), where hypotheses are challenged with data under a bias-corrected statistical likelihood framework.
STUDY AREA AND SPECIES
Fieldwork was undertaken on the seasonal floodplain system of the (macro-tidal) South Alligator River, Kakadu National Park (KNP). Situated in the wet–dry tropics of Australia's Northern Territory (NT), the Heritage listed KNP hosts ~1680 native plants (including 96 invasives) and numerous native fauna (Press et al. Reference PRESS, LEA, WEBB and GRAHAM1995).
The South Alligator (SA) floodplains are representative of sub-coastal wetlands across northern Australia (Finlayson et al. Reference FINLAYSON, LOWRY, BELLIO, NOU, PIDGEON, WALDEN, HUMPHREY and FOX2006) and have been documented as important feeding sites for magpie geese during the tropical dry period (Whitehead Reference WHITEHEAD1998). These typically occur on black, organic cracking clays, overlying estuarine deposits. Wetlands form at outflow junctions between estuarine sediment and upland river systems (Press et al. Reference PRESS, LEA, WEBB and GRAHAM1995), connecting with tidal systems through multiple unconnected channels, and flooding for four to six months each year.
Wetland vegetation dominates as wetlands recede, during the dry season. Across the NT, introduced weeds dominate many floodplains (Lonsdale Reference LONSDALE1994), however these are rigorously controlled within Kakadu, allowing native floodplain flora to flourish. These include vast wetlands dominated by E. dulcis, as well as stands of native grasses such as Oryza rufipogon, Urochloa mutica and Phragmites vallatoria (Cowie et al. Reference COWIE, SHORT and OSTERKAMP-MADSEN2000). Melaleuca forests typically dominate wetland fringes, and geese will roost in these at night. Magpie geese further use native grass for nesting activity following monsoonal rains (Frith & Davies Reference FRITH and DAVIES1961), but will only forage for grass species where E. dulcis is not available (Whitehead Reference WHITEHEAD1998).
Wetland systems, such as those in KNP were formed in the Holocene, following the stabilization of sea levels 6000 to 4000 y BP (Mulrennan & Woodroffe Reference MULRENNAN and WOODROFFE1998). Systems are dynamic, alternating between annual wetting and drying and tracking intensely seasonal rainfall patterns (Bayliss Reference BAYLISS1989). The climate of the ‘Top End’ of Australia's Northern Territory (NT) is marked by two distinct seasons: the wet (November–April), associated with the north-western monsoon, and the dry season (May–October).
Many NT floodplains are heavily grazed by managed livestock and feral ungulates (Corbett & Hertog Reference CORBETT and HERTOG1996) and introduced pasture grasses are prevalent (Lonsdale Reference LONSDALE1994). Native floodplain vegetation is dominant in designated and protected conservation areas, such as KNP, and these support numerous native and non-native vertebrates, including a diverse waterfowl guild (Finlayson et al. Reference FINLAYSON, LOWRY, BELLIO, NOU, PIDGEON, WALDEN, HUMPHREY and FOX2006).
Magpie geese rely on such wetlands for forage and breeding activity (Whitehead & Tschirner Reference WHITEHEAD and TSCHIRNER1990). An iconic waterbird native to Australia and New Guinea, magpie geese are the only extant member of family Anseranatidae (Frith & Davies Reference FRITH and DAVIES1961). Once prevalent across south and south-eastern Australia, magpie geese are now restricted to the tropical north because of the synergistic historical impacts of drought, habitat loss, deliberate poisoning, over-exploitation and predation by introduced vertebrates (Nye et al. Reference NYE, DICKMAN and KINGSFORD2007).
Further, while weedy plants dominate many tropical Australian floodplains, natives such as E. dulcis persist. A member of the Cyperaceae, these emergent aquatic annuals grow to 1 m in height and typically bear globose tubers, 5–10 mm in diameter (Cowie et al. Reference COWIE, SHORT and OSTERKAMP-MADSEN2000). Eleocharis dulcis occurs throughout tropical Australia and Asia, and is harvested as a food source by local people. The tubers are a favoured food plant of both geese and feral pigs (Sus scrofa) in tropical Australia (Whitehead Reference WHITEHEAD1998). While known to favour brackish wetlands, E. dulcis are sensitive to saline water and have been lost to past saline intrusion events (Traill et al. Reference TRAILL, BRADSHAW, DELEAN and BROOK2010).
METHODS
A priori model set
We developed a set of hypotheses, linked to candidate statistical models, to test alternative ideas about the relationship of tuber abundance to the aggregate response by geese. Moreover we developed hypotheses relating tuber response to herbivory.
Following the initial formulation of our broad hypotheses, we developed more specific multiple working hypotheses that accounted for interacting and additive effects of parameters (Burnham & Anderson Reference BURNHAM and ANDERSON2001). To elaborate, our ‘global model’ hypothesized that geese aggregate in response to the availability of E. dulcis, and have a decided impact on plant abundance, but the drying of the wetlands provides a migration threshold, after which plants have the ability to regenerate. Our hypotheses were: H1 – Aggregation hypothesis: magpie geese aggregate spatially in response to the abundance and availability of E. dulcis tubers. H2 – Grazing hypothesis: E. dulcis tuber density is driven by herbivory. H3 – Rainfall hypothesis: magpie geese are forced to depart from the floodplains, following aggregation in response to wetland drying.
A set of candidate models (representing variables that are potentially important on a priori grounds) has in turn been developed to relate to each of these hypotheses. Thus the first suite of competing hypotheses (H1) were (1) Magpie goose abundance is determined by E. dulcis tuber density, (2) goose abundance is determined by E. dulcis tuber size, (3) goose abundance is determined by water level and soil viscosity.
For H2, we hypothesized that (4) Eleocharis dulcis tuber density is determined by magpie goose predation, (5) Eleocharis dulcis density is determined by period of inundation and (6) Eleocharis dulcis density is determined by pig predation. Finally, for H3 we hypothesized that (7) goose presence/absence is determined by soil viscosity and (8) goose presence/absence is determined by water level.
Thus, following our hypothesis that geese aggregate in response to E. dulcis abundance we developed a model set that guided field data collection and thereby allowed us to challenge models with data. The global model to test aggregate response was: Goose abundance = interaction between tuber weight and density + water depth + soil viscosity.
We were further interested in goose departure, and thus our hypothesis that wetland water levels and/or food plant availability determined a migration threshold was framed within the global model: Bird absence = interaction between tuber density and weight + water depth.
Our models testing the hypothesis that E. dulcis tuber density was driven by predation was framed to test both goose (and pig) predation and distance to shoreline (as a surrogate of inundation period, given that sites close to the flood line dry earlier than sites deep within each wetland). We used exclosures to test the effect on predation versus non-predation.
Field sampling
Models required parameterization based on field data. Our approach was to collate these data following initial model development, and then to revise models as data challenged these.
Field work was restricted to the dry season only (June–November), because this is the period when geese aggregate as available water declines. Monitoring ran from 2005 through to the end of 2007.
Two sites were chosen (within one extensive floodplain area) at the South Alligator River and Nourlangie Creek confluence. The distance between sites was ~10 km. We constructed three plots at each of the two sites (six plots in total), all within reach of access roads. Plots were selected so that we could estimate bird and food plant abundance, as well as environmental parameters. All plots were 200 × 50 m (1 ha equivalent) in size, starting ~5 m from the (high) water's edge and separated by no less than 1000 m. Plots were demarcated using 2.5-m steel pickets, with white plastic pipes (50-mm gauge) secured at the top of each of these.
Exclosures were constructed at each of the two sites (three exclosures per site, six in total). These aimed to exclude (1) pigs, but not geese (no roof) and (2) both pigs and geese (exclosure with a mesh roof that allowed photosynthetic activity). Controls were simply demarcated plots that had no form of exclusion. Exclosures were 5 × 5-m squares built using 2.5-m steel pickets driven into the floodplain substrate. Three strands of 2.5-mm fencing wire were fed through the pickets with mesh fencing (90 × 5 × 1 mm) secured to the strands, and buried ~30 cm below the soil. A central picket allowed for roof construction across the exclosures. Exclosures were placed at ~ 50-m intervals across the floodplains (starting at 20-m from the flood line), so as to sample predation at various water depths and thus feeding intensity. The 2005 field season was dedicated to experimental design, plot demarcation, exclosure construction and to resolve a number of logistical issues such as floodplain access.
A four-seat, 4.8-m airboat (or fanboat) was hired for wetland access. We found this to be the safest and most efficient method of traversing floodplains. Wetlands flooded following the tropical monsoon rains in December each year. Vehicle and airboat access was not possible at this time (December–June). Moreover, birds were unable to access food plants before this time and thus field-data collection commenced by June.
We required estimates of bird abundance, E. dulcis tuber abundance, and environmental parameters such as water depth, soil depth and viscosity. Bird density was estimated from a single trailer-mounted boom-lift (maximum height, 10 m). From the raised lift, two observers counted the total number of geese in each plot at every hour, for an 8-h period, thus accounting for daily variation in goose aggregation. The mean value of each hourly count was calculated, and the median value taken across all eight counts to derive a central estimate of bird abundance. Goose abundance was thus estimated every month from June to November 2006 and July to October 2007.
We used bird mass as a measure of an individual's robustness (Kight & Swaddle Reference KIGHT and SWADDLE2007) in 2006. From 2007 we used an index (bird mass/bird body length) that better reflected relative body condition.
We sourced magpie geese in two ways: first from live-bird capture done in collaboration with Australian Quarantine as part of national disease surveillance, and second from dead geese shot on behalf of the traditional owners of KNP. Birds were secured each month during the field season, aged, sexed and weighed (leg bands were placed on live-caught birds). Individual geese were placed in a large cotton bag and weighed using a hanging scale (5 kg maximum, in 2-g increments). Total length was taken by laying each adult bird on its back, and using a tape to measure length from tip-of-beak to tip-of-tail (Lowe Reference LOWE1989).
Tuber and floodplain-parameter data were measured on-site using the airboat. Immediately following bird counts (typically 3 d), we drove the airboat to plots for plant collection. As the noise of the airboat disturbed the geese, it was necessary to make plant tuber counts following bird counts. We randomly selected (using a numbered grid overlain on a satellite image of each plot and using values from a computer-based pseudorandom number generator) three points within each plot prior to travel, and used a handheld Global Positioning System (GPS) to locate these. We used a handheld core extractor (65 mm diameter × 350 mm depth core, 1.2 m arm) to subsample soil and extract tubers. We took 10 samples (at each of the three points within each plot) by walking around the airboat perimeter and leaning overboard. This allowed estimation of tuber abundance at each plot. Tubers were separated from the soil core using a wire-mesh pan (held overboard), washed, counted and stored in sealed paper bags. Following field excursions, E. dulcis tubers were cleaned, dried (in a drying oven) and weighed in the laboratory.
At each plot, we also collected data on parameters likely to influence, or drive the abundance of magpie geese. A priori consideration of the system guided development of multiple competing hypotheses, expressed as generalized linear mixed-effects models with different combinations of independent predictors. Parameters used to build the model set included water depth (measured using a 1.5-m graduated rod, three samples at each subplot), soil depth (from the top of the soil to the base where the muddy strata met a hard, rocky substrate and measured using a rod), soil viscosity (2007 only and after cursory analysis of 2006 data) and an index of pig-rooting. Soil viscosity was estimated using an index of stickiness (after DPI 2004), and derived from samples at each point (30 from each plot). Viscosity was scored from 0–3 using hands to judge texture, with 0 being ‘not sticky’ and 3 ‘very sticky’. Water depth was categorized following field observation of bird grubbing behaviour, thus 0 for water below 10 mm, 1 for water between 10 and 450 mm and 2 for water deeper than 450 mm. Pig-rooting data were ultimately discarded as negligible.
Exclosures were cleared at the end of 2006. The partly saline wetland water caused quick deterioration of the wire mesh. Access issues required us to wait until the floodplains dried, before we could retrieve the mesh and pickets. We used the handheld core extractor to sample plant tuber abundance at each of the exclosures at both sites (November 2006). We sampled 10 cores from each treatment and then counted, dried and weighed the tubers.
Finally, departure thresholds and giving-up densities, as shown in some temperate waterfowl populations (Rowcliffe et al. Reference ROWCLIFFE, WATKINSON, SUTHERLAND and VICKERY2001, Vickery et al. Reference VICKERY, SUTHERLAND, WATKINSON, LANE and ROWCLIFFE1995), have not been defined for magpie geese. Here we used a binary indicator of bird absence from floodplains, and tested factors correlated with departure. We were unable to collect wetland parameter data following bird departure in 2007 and we therefore analysed 2006 data only.
Statistical analyses
Three model sets for testing bird abundance were collated for data from 2006, 2007 and both years. Models were also prepared to test bird departure using bird absence as a response. To gauge the relative importance of each predictor variable, we fitted a series of generalized linear mixed models (GLMM) to bird abundance and bird absence (the two alternative dependent variables) using the lmer function in the R-language environment (http://r-project.org). The random effects error structure within the GLMM was used to correct for spatial and temporal non-independence of data, given the likelihood of spatial correlation between plots and sites, and temporal correlation between month (sampling took place once each month) and year (two years), which were not measured directly and not captured within the fixed effects (predictor variables).
Using plant tuber abundance, we determined the effect of treatment (exclosure) type and distance (from shore line) following seasonal predation by geese. Again, we developed GLMM models using the lmer function in R, controlling for spatial correlation (site as a random effect).
Asymptotic measures of relative information loss were used to assign strengths of evidence to the competing models (Burnham & Anderson Reference BURNHAM and ANDERSON2001), with both Akaike's information criterion corrected for small sample sizes (AICc), and the Bayesian information criterion (BIC) weights used as an objective means of model comparison (McCarthy Reference MCCARTHY2007). Results should be viewed from ‘strength of evidence’ perspective, where Δ values (level of empirical support) of between 0–2 indicate substantial support (Burnham & Anderson Reference BURNHAM and ANDERSON2001). Thus a ‘best approximating model’ is selected from an a priori set of candidate models. The approach is markedly different to null hypothesis testing and readers are advised to source Burnham & Anderson (Reference BURNHAM and ANDERSON2001) for further information.
For the exclosure data, we further calculated evidence ratios as ‘weight of evidence for each model’, after Burnham & Anderson (Reference BURNHAM and ANDERSON2001). We chose a Bayesian method of model selection in addition to Akaike's information criteria, because the BIC tends to select simpler models which reflect main effects (dominant drivers), whereas AIC will include tapering effects, if sufficient data are available, and so often selects ‘saturated’ models (McCarthy Reference MCCARTHY2007).
RESULTS
Aggregative response
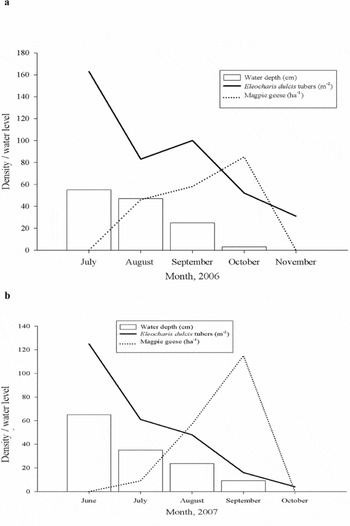
Magpie geese moved to the South Alligator floodplains at the onset of the dry season for both 2006 (July–August) and (July) 2007. There was a marked increase in bird abundance over these periods (Figure 1), followed by a decrease in abundance at the end of the dry season (October–November) when access to food plants was restricted by floodplain drying. Mean density of geese rose from 0 at the onset of dry 2006 to 85 ha−1 at peak. The 2007 foraging period was shorter, but peak abundance (mean across all plots) was higher, at 115 birds ha−1.
Monthly dry-season decline in Eleocharis dulcis tuber abundance (mean tubers m−2), in relation to the aggregative response of magpie geese (mean individuals ha−1) and floodplain water depth (monthly mean across all sites). Mean data represented are for 2006 (a) and 2007 (b). Standard deviation (SD) for E. dulcis tuber density, 2006 (50) and 2007 (46); SD for bird density 2006 (37) and 2007 (50); and SD for water levels 2006 (25) and 2007 (25).

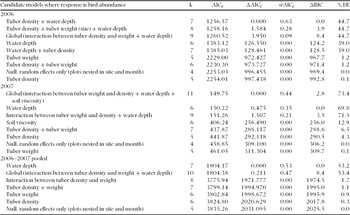
Using AICc and BIC to select the most parsimonious models, we found that water depth and tuber density were the best predictors of bird abundance in 2006 and across both years (Table 1). All fixed effects (global saturated model) were the best predictors of goose abundance during 2007 (Table 1).
Results from generalized linear mixed-effect models (GLMM) of the aggregative response of magpie geese (abundance and presence/absence) to floodplain dynamics during the dry season. All GLMMs include site as a random effect. Shown are the number of model parameters, including random effect variance decomposition (k), Akaike's corrected information criterion (AICc), difference from best model (ΔAICc), Akaike weight (wAICc) scaled relative to a total sum of 1, Bayesian Information Criterion (BIC), and per cent deviance explained (% DE) as a measure of goodness-of-fit. Included are data collected 2006, 2007 and pooled across 2006 and 2007.

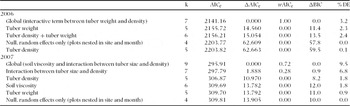
These findings indicate the role that rainfall ultimately has on restricting access to food plants, with seasonal rain prompting wetland flooding. We took these analyses a step further and omitted water depth from models testing bird abundance during the aggregative period only. Results indicate that tuber density and size were key drivers of abundance (Table 2), but the relatively low deviance explained suggests the overwhelming influence that water depth has on this system.
Aggregative response of magpie geese to Eleocharis dulcis and floodplain parameters (excluding water) during the aggregative period only (data pre- and post-feeding are omitted). Data are for 2006 and 2007.

Departure threshold
We found that goose abundance decreased with a reduction in the availability of tubers (Figure 1). Birds appear to reach a point where reward (for food plants) no longer matched grubbing effort, but water is the driving factor here (Table 3). The loss of floodplain water to evaporation leads to the rapid drying of the floodplain soils and so grubbing effort is difficult, if not impossible to the birds. Eleocharis dulcis tuber density immediately following bird departure was 3.7 m−2 (median = 3, n = 150), and mean density at the last measurement prior to departure (3 wk earlier) was 7.1 m−2 (median = 7, n = 370).
Generalized linear mixed-effect model results on the migration threshold (coded as a binary value: absence = 1, presence = 0) of magpie geese to seasonal floodplains during the dry season 2006.

Exclosures (response of E. dulcis)
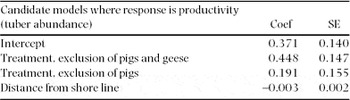
Mean tuber density or productivity was 7.7 m−2 in the control, 14.3 m−2 where only pig predation was excluded and 24.2 m−2 where access was blocked to both pigs and geese. GLMM-based model selection showed that both treatment and distance to shoreline were key to productivity (Table 4). Coefficient values are provided in Table 5, with the exclusion of predators shown to have a positive outcome for productivity. Poor model fit (low deviance explained, Table 4) is possibly due to small sample size (one-off sample of exclosures due to the expense of building and maintaining these), with only a small component of total environmental variation being captured within the exclosure sample areas.
Generalized linear mixed-effect model results of the response of plant tubers to herbivore exclusion (2006 only). Site was included as a random effect (spatial correlation).

Evidence ratios for GLM of the response of plant tubers to herbivore exclusion. Evidence ratios are the ratio of (Akaike weight) best model to following model. Coefficient (Coef) values for each treatment type, with SE are detailed.

Body condition
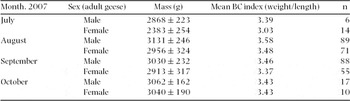
During 2007, body condition index (adult birds only) showed a peak early during the aggregation and with a gradual decline toward October (Table 6). As the dry season progressed, E. dulcis tubers grew in size (Traill, unpubl. data). Apparently E. dulcis plants continue to allocate biomass toward the culms during the dry period while floodplains still hold water.
Mean (± SE) body mass (g) of adult male and female magpie geese, 2007. Included are body condition (BC) indices.

DISCUSSION
Magpie geese aggregate on floodplains dominated by E. dulcis during the early tropical dry season where they forage for E. dulcis tubers. When grubbing in these environments, the birds gain body condition (relative to condition at the onset of foraging) and accrue reserves that help carry them through the resource-sparse late dry season (Frith & Davies Reference FRITH and DAVIES1961). While tubers are accessible, geese respond to both tuber availability and size, and are restricted by water depth and soil viscosity. Essentially, aggregation is driven by seasonal rainfall. These findings build on past work that has linked magpie geese to the presence of Eleocharis on seasonal floodplains (Bayliss & Yeomans Reference BAYLISS and YEOMANS1990), but at a finer spatial scale. Indeed, the aggregative response by tropical magpie geese is consistent with the hypothesis that herbivore (waterfowl) aggregation is largely driven by (wetland) resource availability and access to food (Noordhuis et al. Reference NOORDHUIS, VAN DER MOLEN and VAN DEN BERG2002, Rowcliffe et al. Reference ROWCLIFFE, WATKINSON and SUTHERLAND1998, Timmermans et al. Reference TIMMERMANS, BADZINSKI and INGRAM2008). A large proportion of the region's magpie goose population use Eleocharis-dominated floodplains during the late-dry season (Bayliss & Yeomans Reference BAYLISS and YEOMANS1990), in preference to alternative habitat and food plants, such as floodplains dominated by native Hymenachne or introduced Urochloa grass species. Indeed, up to 70% of the Northern Territory goose population uses the Kakadu wetlands at and around our study sites in the mid- to late-dry season (Whitehead Reference WHITEHEAD1998). An analogous aggregative response by (taxonomically disparate) geese has been shown in temperate regions, typically by migratory populations (Bos et al. Reference BOS, VAN DE KOPPEL and WEISSING2004, Rowcliffe et al. Reference ROWCLIFFE, WATKINSON and SUTHERLAND1998).
Other factors that we have not considered explicitly may drive dry-season site selection by geese, such as predator avoidance or access to roosting sites (Frith & Davies Reference FRITH and DAVIES1961, Whitehead Reference WHITEHEAD1998) – although these were embedded implicitly within our random effects. While large sub-coastal floodplains, such as those in our study, do provide refuge from terrestrial predators, it is implausible that these factors alone drive an aggregative response because there are large areas that offer both deep water and adjoining roosting sites elsewhere in these large floodplain systems.
Further, while we were unable to measure directly the functional response of geese to food plants (Holling Reference HOLLING1959a, Reference HOLLING1959b), we did not witness aggressive or interference behaviour between individuals while feeding, as has been shown in temperate waterfowl assemblages (Rowcliffe et al. Reference ROWCLIFFE, SUTHERLAND and WATKINSON1999). Undoubtedly though, magpie geese do compete for plant tubers, with mature and larger birds tending to forage more efficiently (Whitehead Reference WHITEHEAD1998). An increase in feeding intensity as the season progressed was not obvious. Any measure of a numerical response would have required estimation of changes in metapopulation abundance, which was not possible given the distribution of the birds, and their dispersal abilities (Whitehead Reference WHITEHEAD1998).
Aggregative association by magpie geese is a response to an ecological ‘window-of-opportunity’. The apparent increase in bird condition during this period highlights the importance of E. dulcis. The initial peak in goose condition is interesting, and we speculate that birds simply lose condition as contest-type competition increases. The increase in tuber size is also interesting. Biomass allocation may be a plant strategy that allows effective tuber re-growth following goose departure, after wetland drying and during wet-season inundation. Gut-content of harvested geese (culled on behalf of Traditional Owners) comprised >90% (by volume) E. dulcis tubers (Traill, unpubl. data). Indeed, the impact of herbivory (by geese) on E. dulcis is shown through the relative tuber abundance in exclusion zones compared with foraged areas (24.2 m−2 tubers and 7.7 m−2 respectively). Productivity in treatments that excluded just pigs was 14.3 tubers m−2 showing that despite control efforts by parks authorities, pigs still forage heavily on Eleocharis tubers. Further research that explores the competitive interactions between geese and pigs (over E. dulcis) is required.
While we failed to show a convincing ‘giving up’ density, where forage effort is no longer worthwhile (Nolet et al. Reference NOLET, LANGEVOORD, BEVAN, ENGELAAR, KLAASEN, MULDER and VAN DIJK2001), it appears that magpie geese abandoned preferred forage sites when tuber density fell below ~4 m−2, although this figure is likely to vary with other influences on foraging costs, such as the increasing glutinousness and ultimately hardness of dry clay soils. Magpie geese have been observed returning to study sites to forage for tubers following sporadic-dry season rains sufficient to provide wetland surface water and soften soils (D. Lindner, pers. comm., Kakadu Buffalo Farm). Nonetheless, our findings are consistent with the hypothesis that goose departure thresholds are driven by floodplain water levels.
Periods of herbivore exclusion may allow E. dulcis plants opportunity to regenerate, but there is no evidence that predation by geese drives a shift in plant community structure away from Eleocharis (cf. Jefferies et al. Reference JEFFERIES, KLEIN and SHAVER1994). We speculate that floodplain water quality (especially level of salinity) and period of inundation strongly influence the survival of E. dulcis plants, and these require further investigation. It is possible that the nutrient input and grubbing action of magpie geese benefit seed germination (Zacheis et al. Reference ZACHEIS, RUESS and HUPP2002).
Sensitivity of E. dulcis to saline water is a factor that limits the species’ spatial and temporal distribution (Eliot et al. Reference ELIOT, FINLAYSON and WATERMAN1999). Past saline water intrusion, possibly associated with feral buffalo (Bubalus bubalis) damage, affected habitats on parts of the South Alligator floodplains and larger areas of the nearby Mary River (Corbett & Hertog Reference CORBETT and HERTOG1996). Our models provide ‘evidence’ for our hypotheses, showing that aggregative events by magpie geese during the tropical Australian dry season are in large part due to the availability and abundance of E. dulcis tubers. Although more work is required to understand the nature of Eleocharis dulcis regeneration during wetland inundation, we suggest that seasonal flooding and drying of tropical floodplains across northern Australia allows E. dulcis a temporal refuge against bulb predation, and therefore imparts a capacity to regenerate prior to dry-season predation. The seasonal variation in water levels thereby allows the persistence of these systems, similar to temperate wetlands (Timmermans et al. Reference TIMMERMANS, BADZINSKI and INGRAM2008). We recommend that follow-up experiment-based studies test the reproductive capacity of E. dulcis under varying levels of predation, water salinity and inundation period.
ACKNOWLEDGEMENTS
We thank Parks Australia North and the Kakadu Traditional Owners for wetland access. We further thank J. Alderson, S. Delean, S. de Little, K. Dyke, D. Franklin, T. Griffiths, H. Guillen, C. Hassell, D. Lindner, M. Misso, T. Nou, S. Paul, P. Ragla, J. Smith, W. White, P. Whitehead, S. Winderlich and G. Yang. All work was funded through an Australian Research Council Discovery Grant DP0558350.