Introduction
Food security in southern Africa is tightly linked to the success of local smallholder cropping systems to achieve reasonable and stable productivity across seasons and maintain natural resource quality, in particular, soil fertility (Tittonell and Giller, Reference Tittonell and Giller2012). The majority of these systems are based on maize, the most important staple crop in the region. However, concerns have been raised about the threat of reduced soil fertility (Turmel et al., Reference Turmel, Speratti, Baudron, Verhulst and Govaerts2014). When maize grains are harvested, the residues are used as cattle feed. Mineral and organic fertilisers are often not available in a quantity that can replace the nutrients lost to human and animal consumption. Consequently, soil fertility often has been declining under sole maize cropping (Vanlauwe et al., Reference Vanlauwe, Six, Sanginga and Adesina2015).
Introducing legumes is seen as one of many options to improve soil fertility and simultaneously provide biomass that can be sold, consumed by the farmer or fed to livestock (Samireddypalle et al., Reference Samireddypalle, Boukar, Grings, Fatokun, Kodukula, Devulapalli, Okike and Blümmel2017). In addition, legumes can provide a range of advantages, such as adding soil nitrogen (N) through biological N fixation, serving as a break crop in narrow crop rotations and adding protein to human and animal diets. A key challenge, however, is that these legumes compete with maize crops for land. Farmers rely on the more productive maize crop in terms of calorie intake. Hence, a reduction in maize production is usually not an option. In addition, certain legumes are not directly adapted to the local soil conditions, for instance, by not developing nodules. Therefore, some legume seeds require inoculation before being sown, which can be a technological barrier for adoption (van Heerwaarden et al., Reference van Heerwaarden, Baijukya, Kyei-Boahen, Adjei-Nsiah, Ebanyat, Kamai, Wolde-meskel, Kanampiu, Vanlauwe and Giller2017).
Finally, many regions in southern Africa are hit by severe and frequently occurring droughts caused by the El Niño-Southern Oscillation (ENSO) dynamics (Reason et al., Reference Reason, Hachigonta and Phaladi2005). The ENSO and the associated strong climate variability could be exacerbated under climate change (Conway et al., Reference Conway, van Garderen, Deryng, Dorling, Krueger, Landman, Lankford, Lebek, Osborn, Ringler, Thurlow, Zhu and Dalin2015). In particular, resource-poor farmers (having no access to supplementary irrigation) cannot take the risk of complete failure of a drought-sensitive but otherwise productive legume. Taking a risk-averse attitude, farmers typically prefer a crop with reliable production across seasons but accept potentially missed gains in favourable years.
Against this background, the integration of legumes has to fulfil three criteria: (i) it should result in additional benefits for the farmer, with no yield penalty for the maize; (ii) should be adapted to local conditions of climate variability; and (iii) be accessible for farmers with poor resource endowment. Intercropping is promoted as one option with regard to the first and second criteria. The advantage, in comparison to a maize–legume rotation, could be that the farmer can harvest maize cobs from the field each year, as opposed to having a sole legume crop and no maize. It is crucial that intercropping provides production benefits for successful adoption, as more material and labour input is required. Such production benefits can be achieved through the complementary use of resources (water and nutrients via different rooting patterns), creation of more favourable micro-climatic conditions or simply improved protection against biotic stresses (Brooker et al., Reference Brooker, Bennett, Cong, Daniell, George, Hallett, Hawes, Iannetta, Jones, Karley, Li, McKenzie, Pakeman, Paterson, Schöb, Shen, Squire, Watson, Zhang, Zhang, Zhang and White2015). While it is often assumed that there is enhanced soil water conservation through biomass production and soil cover as a result of legume intercrops (Brooker et al., Reference Brooker, Bennett, Cong, Daniell, George, Hallett, Hawes, Iannetta, Jones, Karley, Li, McKenzie, Pakeman, Paterson, Schöb, Shen, Squire, Watson, Zhang, Zhang, Zhang and White2015), literature shows a wide range of intercropping performances, with more (Rusinamhodzi et al., Reference Rusinamhodzi, Corbeels, Nyamangara and Giller2012) and less successful examples (Nelson et al., Reference Nelson, Hoffmann, Vadez, Rötter and Whitbread2018) when water is in short supply. These studies illustrate that intercropping performance highly depends on the site- and season-specific environmental conditions, cultivar choice and management decisions, in particular, planting date, planting density, fertiliser application and the management of biotic stresses.
For southern Africa, a number of legumes are cultivated with the most common ones being soy bean (Glycine max), groundnut (Arachis hypogaea) and cowpea (Vigna unguiculata). At the same time, there are also local, underutilised or neglected crops. One of the latter is lablab (Lablab purpureus) (Maass et al., Reference Maass, Knox, Venkatesha, Angessa, Ramme and Pengelly2010), which is known to be drought tolerant and produces high amounts of biomass (Pengelly and Maass, Reference Pengelly and Maass2001; Sennhenn et al., Reference Sennhenn, Njarui, Maass and Whitbread2017). As an intercrop, lablab can reduce the occurrence of lepidopterous stem borers in maize (Maluleke et al., Reference Maluleke, Addo-Bediako and Ayisi2005). Commercially, only two cultivars are available in southern Africa, Rongai and Highworth, of which the first is dominant in South Africa (Maass et al., Reference Maass, Knox, Venkatesha, Angessa, Ramme and Pengelly2010). Despite only two main cultivars being used, a wide range of genotypes with diverse and distinctive growth patterns are known, highlighting that yield gains through utilising the potential genetic variability have not yet been exploited (Pengelly and Maass, Reference Pengelly and Maass2001).
Due to its drought-resistant characteristics, lablab is of particular interest with regard to the above-stated risk of climate variability in southern Africa. This combination of increasing productivity under high climate-induced risk, while maintaining or increasing soil fertility through the use of local resources, defines an approach best described as sustainable intensification (Godfray et al., Reference Godfray, Beddington, Crute, Haddad, Lawrence, Muir, Pretty, Robinson, Thomas and Toulmin2010).
We conducted trials at two distinctive sites in the Limpopo province in South Africa for two seasons, 2015/2016 (negatively El Niño affected) and 2016/2017 (neutral/normal climate conditions). We compared the productivity of sole maize (sole-maize), sole lablab (sole-lablab), intercropping where maize and lablab were planted at the same time (intercropped-SP) and intercropping maize with lablab planted 28 days after maize (intercropped-DP). We tested the basic hypothesis that maize–lablab intercropping outperforms the productivity of sole maize, and also examined a second hypothesis suggesting that the delayed planting of the legumes as part of an intercropping system is beneficial for the cereal production element of the system. The latter hypothesis is derived from experience with other intercropping trials showing that this gives the typically taller cereal, in this case maize, the necessary time to establish itself before being negatively impacted (competed with) through the addition of a legume intercrop (Mthembu et al., Reference Mthembu, Everson and Everson2018). Considering water as a potential key-yield limiting factor in the intercropping system, we evaluated both productivity and water dynamics.
Material and Methods
Study sites
The trials were conducted at two locations in the Limpopo Province of South Africa: The first site was the experimental farm of the University of Venda (Univen), Thohoyandou (22°58′49.9 S and 30°26′16.8 E, 597 m above sea level). The area receives about 847 mm of cropping season rainfall (November–April, as averaged over the period 2008–2017). The maximum average daily temperature for this period is 29.2 °C and minimum temperature is 18.9 °C. The Univen soil is a red, well-drained Rhodic Ferralsol, with a pedal structure. Clay content is generally high (49%) and the soil is acidic at pH 5.0.
The second site was at Syferkuil, the experimental farm of the University of Limpopo, Mankweng (23°50′01.5 S and 29°41′34.4 E, 1226 m above sea level). It receives a mean cropping season rainfall of 491 mm. The maximum average daily temperature for this period is 27.0 °C and minimum temperature is 14.8 °C. The soil is a sandy clay loam and classified as Chromic Luvisol with pH of 6.8.
Field trial design and management
The experiments were set up in a randomised complete block design with four replicates and the above-introduced four treatments: (i) sole-maize, (ii) sole-lablab, (iii) intercropped-SP and (iv) intercropped-DP. This led to a total of 16 plots at each site measuring 4.5 m x 4 m (18 m2) with a maize plant density of three plants m−2. The planting date for the first cropping season was 4 December 2015 at Univen and 29 November 2015 at Syferkuil. In the second season, it was 24 October 2016 and 3 January 2017 at Univen and Syferkuil, respectively. The area was ploughed mechanically using a disc plough followed by demarcation and manual seed-bed preparation before planting. Each plot was comprised of six planted rows of maize with the legume row established between the maize rows in the intercrop plots. This was therefore an ‘additive’ intercrop system. Both crops were sown using the same row spacing of 90 cm, with intra row spacing of 44 cm for maize and lablab, respectively. Phosphorus (P) was applied to sole and intercropped maize rows at a rate of 30 kg P ha−1 in the form of superphosphate (10.5% P). Nitrogen was applied in the form of limestone ammonium nitrate (LAN) (28% N) at a rate of 40 kg N ha−1 on both sole and intercropped maize rows at planting. The crop cultivars used were the hybrid PAN 6479 for maize and the commercially available lablab variety, Rongai. Planting (sowing) was conducted manually, at two seeds per hole and thinned to one after emergence. Weeding was done when necessary after planting.
Weather conditions
Weather stations at or near the sites provided daily weather data. Due to periodic malfunctioning of the stations at both sites, alternative stations, or sources, were used to complete the climatic information. For Univen, an on-site weather station was used for 2015/2016 and Makwarela station (6 km from site) was used during 2016/2017. The Syferkuil weather station was used in 2015/2016, which was complimented with the Prediction of Worldwide Energy Resource data set from the National Aeronautics and Space Administration (NASA, 2017). This source has been satisfactorily tested against measured data (van Wart et al., Reference van Wart, Grassini, Yang, Claessens, Jarvis and Cassman2015). We used these data and trained a simple linear regression model for solar radiation, maximum and minimum temperature on the days where we had actual measured data – for details, see Supplementary Material (Figures S1–S5) available online at https://dx.doi.org/10.1017/S0014479719000206. In addition, for rainfall, we first evaluated whether we can detect a rainfall event. These equations were used to fill the gaps in the weather recordings based on the NASA data.
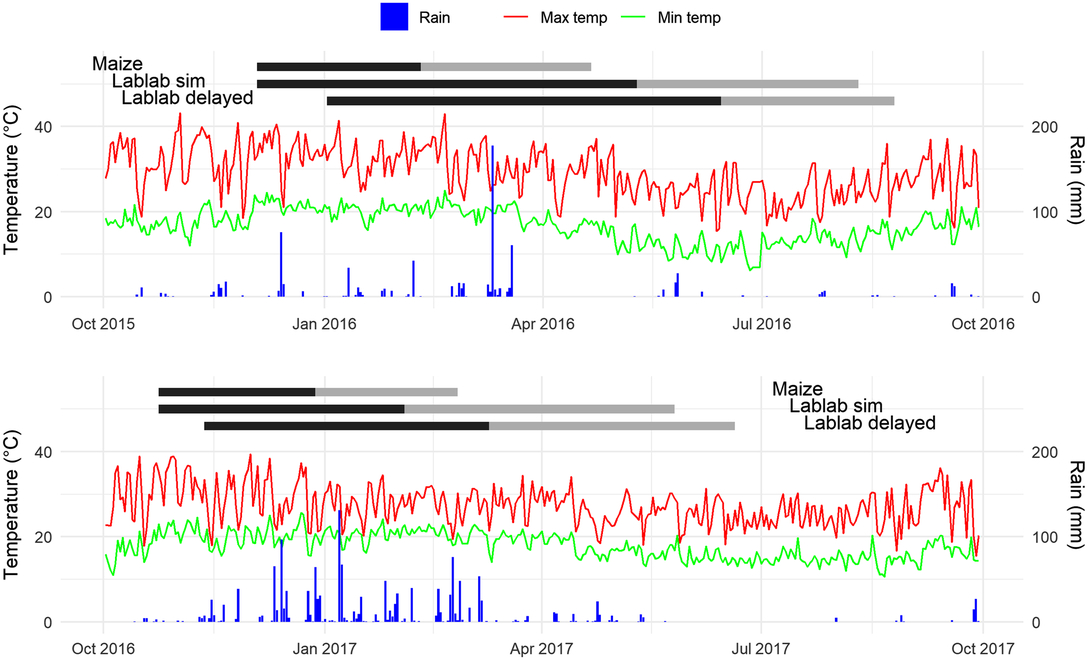
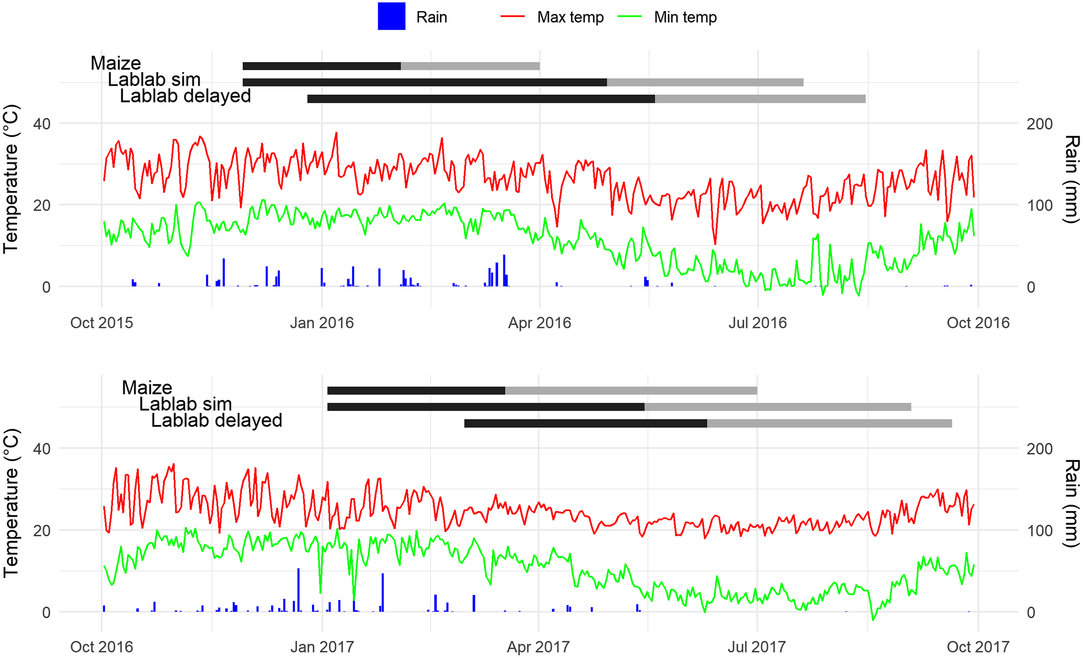
At Univen, the season 2015/2016 was characterised by low rainfall (716 mm from 01 October to 31 May) and high temperatures (on 25% of all days during that period, the maximum daily temperature was above 35 °C) (Figure 1). On 5 days, the maximum temperature was above 40 °C. Average daily temperature was 24.7 °C. The 2016/2017 season was cooler, with an average of 23.7 °C. Only 9% of all days experienced maximum temperatures above 35 °C. There were no days above 40 °C. In addition, 2016/2017 was a high-rainfall year with 1434 mm for the maize cropping period. Generally, heavy rainfall days with more than 40 mm of rain occurred nine times in 2016/2017 and four times in 2015/2016. An extreme rainfall event took place in March 2016 with >180 mm of rain per day (Figure 1). Seasonal average daily solar radiation was 19.0 MJ m−2 in 2015/2016 and 15.6 MJ m−2 in 2016/2017. Closely linked, in 2016/2017, it rained on almost 35% of all days from October to April, which was an extremely wet season for that region. In 2015/2016, it only rained on 18.6% of all days.
Univen climate in 2015/2016 (top) and 2016/2017 (bottom). The red line represents the maximum daily temperature and the green line the minimum. The bars (in blue) represent rainfall events. Horizontal bars within the plots represent the pre-flowering (dark grey) and post-flowering (light grey) stages of each crop (maize, lablab planted at the same time as maize (sim) and delayed) for both years.

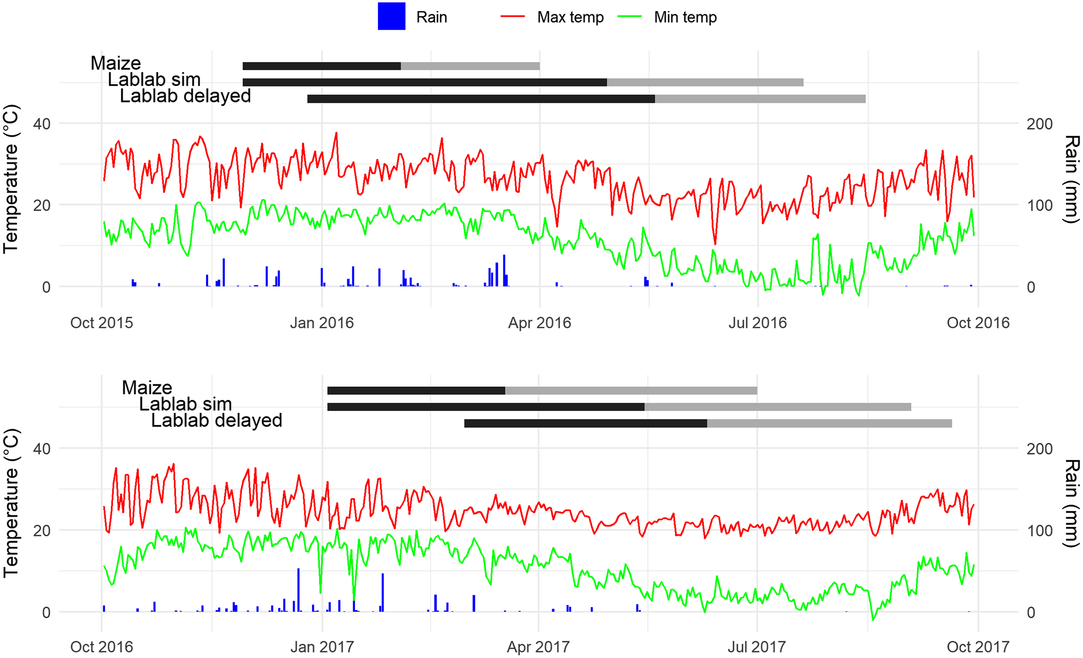
Compared with Univen (Figure 1), the weather at Syferkuil was cooler and drier (Figure 2). Average daily temperatures were 21.2 °C for 2015/2016 and 19.5 °C for 2016/2017 with 11 and 4 days above 35 °C, respectively. In general, rainfall was low in 2015/2016 (442 mm) and 2016/2017 (393 mm) for the period between October and May. In contrast to Univen, 2016/2017 was drier in Syferkuil. However, the number of rain days was interestingly higher in 2016/2017. In this season, it rained on 21% of all days, while in 2015/2016, it rained on 15% of all days. Solar radiation was high in both seasons (daily average: 21.3 MJ m−2 in 2015/2016 and 19.3 MJ m−2 in 2016/2017).
Syferkuil climate in 2015/2016 (top) and 2016/2017 (bottom). The red line represents the maximum daily temperature and the green line the minimum. The bars (in blue) represent rainfall events. Horizontal bars in the plots represent the pre-flowering (dark grey) and post-flowering (light grey) stages of each crop (maize, lablab planted at the same time as maize (sim) and delayed) for both years.
Sampling and analysis
Dry matter (DM) at flowering was assessed by sampling four plants per plot. DM and grain yield at harvest were determined from 10 plants within each plot. Samples were oven dried at 65 °C until a constant weight was reached and is reported in this study as dry weight.
Treatment effect (sole-maize, sole-lablab, intercropped-DP and intercropped-SP), year and site effect, and interaction between factors on total DM and yield of each crop were investigated using a linear mixed model (LMM). Taking the block design into account, we included block as a random effect. The assumption of normal distribution and homogeneity of variance was inspected visually.
In addition, the land equivalent ratio (LER) was calculated, which is a common approach to assess the performance of intercropping versus sole cropping (Bedoussac and Justes, Reference Bedoussac and Justes2011):
 $${\rm LER } = {\rm pLERa} + {\rm pLERb} = {{\rm Ia}/{\rm Sa}} + {{\rm Ib}/{\rm Sb}}$$
where Ia and Ib are the yields for each crop in the intercrop system, and Sa and Sb are the yields for each of the sole crops. pLERa and pLERb are the partial LER values for each species. An LER value higher than 1.0 indicates that intercropping uses the land more efficiently than the comparative sole systems under the given management. Partial land equivalent ratio (pLER) refers to the separate parts of the LER equation. Intercropping with two crops is comprised of two pLER values (maize and lablab), which are added to give the total LER value.
Gravimetric soil water content was determined biweekly (a total of nine sampling events) for the layers 0–15, 15–30 and 30–60 cm using a soil auger. Soil samples were collected between plants (within rows) and between rows, bulked together according to depths and subsampled for the determination of soil moisture content. Samples were oven dried at 105 °C. Volumetric water content (VWC) was then calculated by multiplying gravimetric water content by the bulk density. Bulk density and permanent wilting point (PWP) were estimated using the pedotransfer functions provided by Minasny and Hartemink (Reference Minasny and Hartemink2011).
Results
Yield and total DM
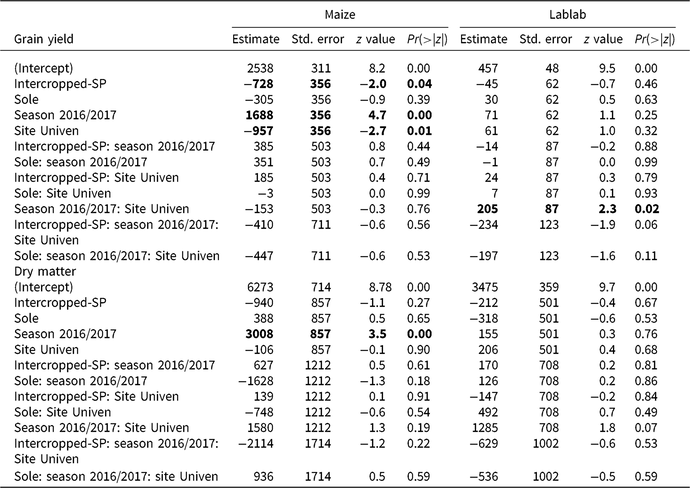
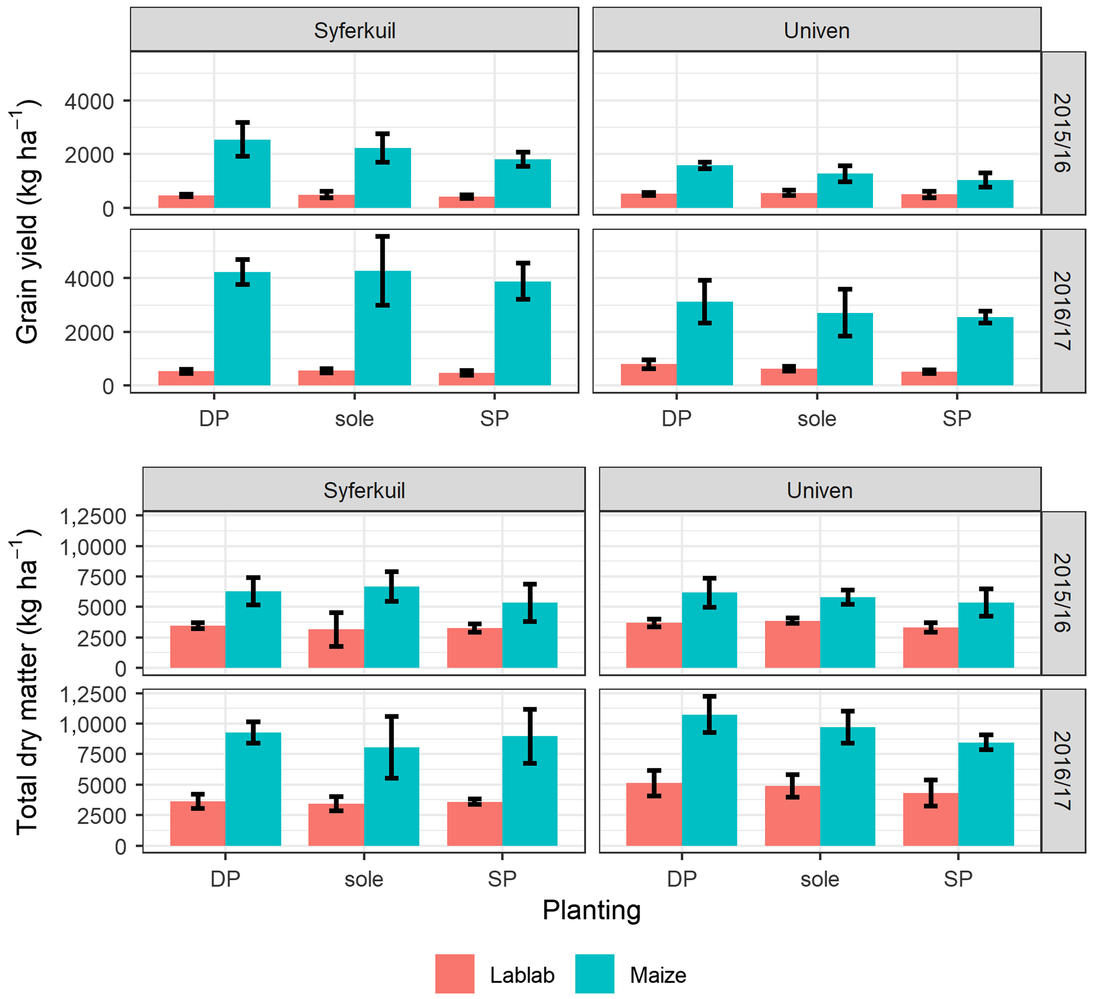
Generally, there were clear effects of treatment, site and season on maize grain yields. Maize yields in the treatment intercropped-DP (on average 2865 kg ha−1) and as a sole crop (on average 2623 kg ha−1) were not statistically different. However, the treatment with intercropped-SP led to significantly lower maize yields of 2320 kg ha−1 in comparison to maize yields in treatments with intercropped-DP and maize-sole (Figure 3, Table 1). In Syferkuil, the maize yields were on average 1116 kg ha−1 higher than in Univen (3161 versus 2045 kg ha−1). Significantly lower maize yields were obtained in the 2015/2016 season in comparison to 2016/2017 (340 versus 1746 kg ha−1). Lablab grain yields remained low at around 500 kg ha−1 regardless of the treatment, site and season. Only the site and season interaction occurred at Univen in 2016/2017, where significantly higher grain yields were produced (Table 1). Treatment did not play a role in this regard.
Responses of maize and lablab grain yield and DM to treatment, site and season using a LMM

The LMM was conducted using block as a random variable and treatment, site and season and their interaction as a fixed effect. Estimate, std. error and significance level (Pr) are shown. Significant effects are indicated in bold. Data are compared against treatment: delayed planting (intercropped-DP), site: Syferkuil, and season: 2015/2016.
Grain yield as affected by season, site and planting management. Intercropped-DP is lablab planted 28 days after maize, and intercropped-SP is maize and lablab planted on the same day. Error bars indicate standard deviation. For statistically significant differences, see Table 1.

Maize total DM was only significantly affected by season. The 2016/2017 season resulted in higher productivity (8872 kg ha−1) than the 2015/2016 season (6234 kg ha−1) (Figure 3 and Table 1). For treatment or site, no statistical difference was found. Overall, the pattern for DM at harvesting in terms of maize was reflected by the DM measured at flowering (Supplementary Material Figure S6); there were hardly any differences between treatments; the 2016/2017 season was more productive than that of 2015/2016; and the differences between sites were not as pronounced as they were for grain yield. Lablab DM was not affected by site, year or treatment. Lablab DM at flowering followed the pattern found at final harvest (Figure 3 and Supplementary Material Figure S6).
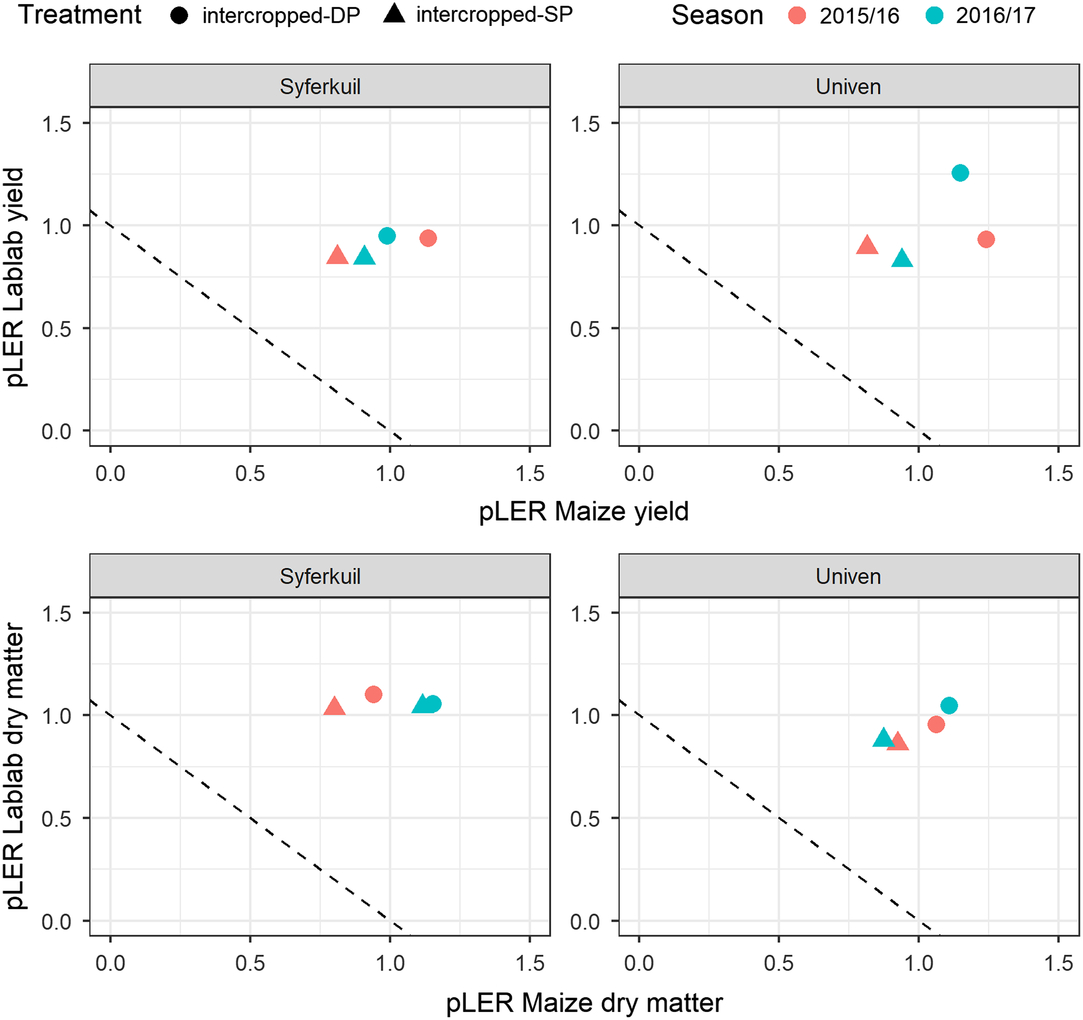
The LER for yield and DM were all well above one, indicating the higher performance of both intercropping systems in comparison to sole cropping (Figure 4). The positive result for intercropping is also illustrated by the fact that each pLER was close to or even above one, indicating similar productivity levels in the two systems for the individual crop. This result was consistent across years and sites.
pLER of yield (above) and total DM (below) for both sites (shown in different boxes) and years (shown by different colours), and both intercrop variations (shown by different shapes; see legend above plot). The dashed lines represent an LER value of one. All shapes above or to the right of this line have an LER value above one.

Soil water dynamics
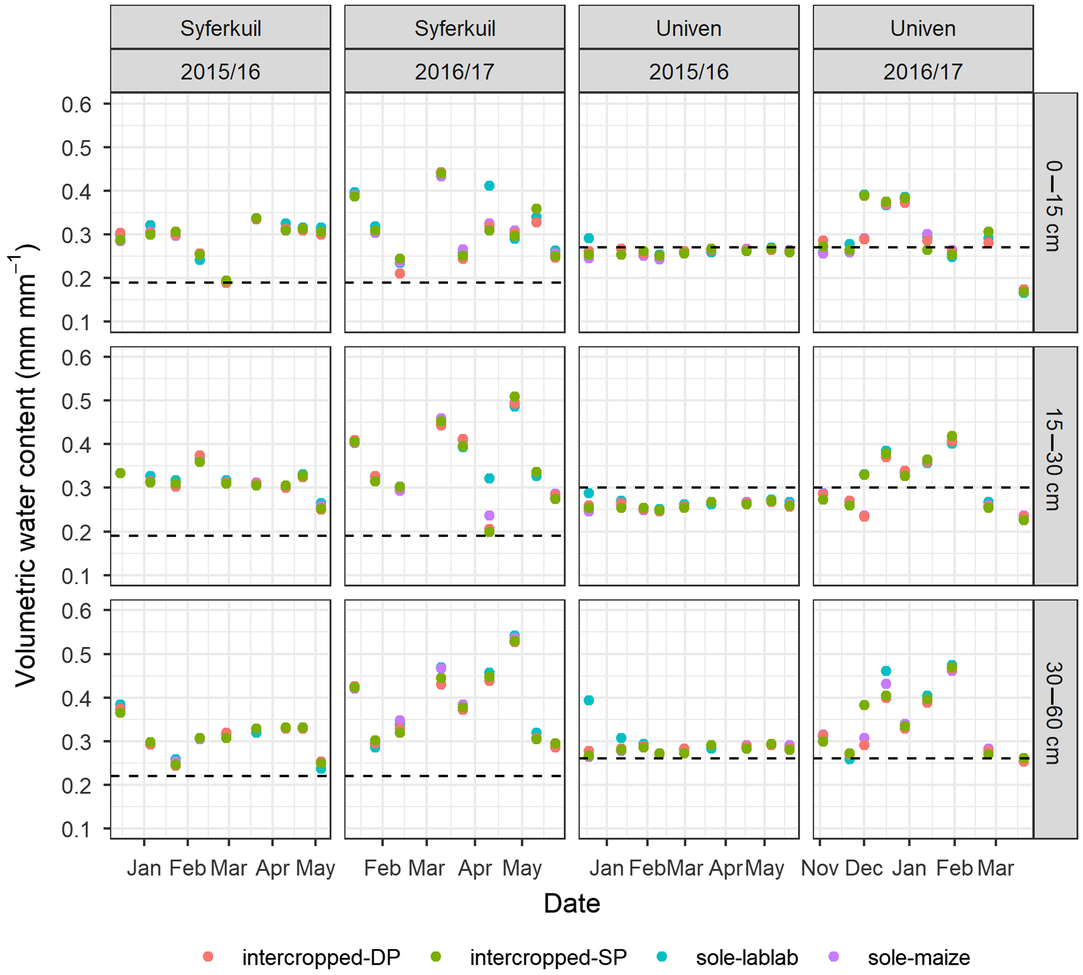
The water content measured in the soil at Syferkuil was lower in 2015/2016 than in 2016/2017 (Figure 5). There was quite a lot of variation between the measurement events in 2016/2017, as indicated by ranges of 0.2–0.6 (mm mm−1). All points measured were above the estimated PWP.
VWC for Syferkuil and Univen for the seasons 2015/2016 and 2016/2017 for 0–15, 15–30 and 30–60 cm depths. Different colours show VWC at specific sampling events for sole lablab (lablab), sole maize (maize), maize with lablab planted 28 days later (intercropped-DP) and simultaneous planting of maize and lablab (intercropped-SP). The dashed lines indicate the estimated PWP based on Minasny and Hartemink (Reference Minasny and Hartemink2011).

At Univen, we found a lower soil water content compared with Syferkuil (Figure 5), especially in the dry season of 2015/2016, where the measurements were continuously close to the estimated PWP (Figure 5). In 2016/2017, particularly during the establishment phase of the crop (Figure 5), the water content rose substantially. After March, the water content dropped close to the PWP.
Discussion
The field trials showed the higher productivity of the intercropping-DP treatment in comparison to the sole systems. The lablab yield and DM simply added to the maize DM and did not reduce the latter (Figures 3, 4; Table 1). This might be related to a more spatially efficient use of soil water (Figure 5). Interestingly, maize grain yields were reduced in the El Niño season of 2015/2016, but lablab DM and yield were not affected (Table 1). This suggests that lablab is indeed a drought-tolerant legume, as also found by Sennhenn et al. (Reference Sennhenn, Njarui, Maass and Whitbread2017) in comparison to cowpea and common bean in field experiments in Kenya. Delayed planting resulted in an improved performance for the intercropping systems, reflecting common knowledge that planting the crops at the same time leads to increased competition between crops. The soil water content did not differ between sole and mixed systems, indicating complementary water use. Both hypotheses of this study were confirmed (see previous results section for a detailed discussion). From an agronomic perspective, this cropping system appears promising, although further investigation is required, in particular, with regard to the micro-climatic effects of these systems. Another topic of interest is of how to best upscale these field-based results to farm, region and beyond, as well as for future climatic conditions. Below, experimental results and further research needs are discussed in detail.
Productivity and soil water dynamics
A key result of this study was that maize yields and DM were the same for intercropped-DP as they were for maize-sole across years and sites (Figure 3, Table 1). Hence, the DM of lablab can be regarded as an additional benefit, which can be used for forage or high-quality residue material (Figure 3). Grain yields of lablab were low and may be of less interest. Other lablab planting material, which could potentially produce more grain (Pengelly and Maass, Reference Pengelly and Maass2001), could be considered depending on the interest of the producer.
Exploring the reasons for this favourable result requires careful observation in terms of the season and site, where high maize grain yields and lablab DM were obtained (Figures 1–3). As expected in the El Niño season, the maize grain yields and DM values were significantly lower at both sites in comparison to the neutral season of 2016/2017. This can be linked to water availability and higher temperatures (Figures 1, 2, 5).
Nevertheless, there was also a significant effect of site on maize grain yields, that is, higher yields in Syferkuil as opposed to Univen. At Univen in 2015/2016, the total rainfall was 700 mm lower during the maize growth period than in the following season (586 vs. 1315 mm) (Figure 1). The lower water supply was reflected in the soil water content, which was close to PWP across the season 2015/2017. This site not only has a clay soil, which provides a relatively good water holding capacity, but also has the potential to retain the water in the top soil – the water in this layer is more prone to evaporation. In 2015/2016, temperatures were average, although there were some extremely hot days around maize anthesis (> 40 °C). The higher temperature may cause a reduction in water supply due to higher evaporation demand, and the extreme events might have resulted in less grain development (Wilhelm et al., Reference Wilhelm, Mullen, Keeling and Singletary1999). This is supported by the low harvest index (HI) of 0.2–0.25 at Univen in 2015/2016 (Figure 3). When comparing the two sites, temperatures at Syferkuil were much lower (Figure 2) and there were notably no days with temperatures of 40 °C or above. The season 2015/2016 was warmer than 2016/2017 due to the El Niño event. At Syferkuil, the HI was higher in both years with a value of around 0.4 and above (Figure 3). Interestingly, the DM at flowering and at maturity was generally comparable between both sites.
It is important to note that although there was less rain at Syferkuil, it was more equally distributed over the season. This is indicated by the higher number of heavy rainfall days at Univen at days 4 and 9 in 2015/2016 and 2016/2017, respectively, with >40 mm rain/day in comparison to 0 and 2 days at Syferkuil. In 2015/2016, which was a dry year at Univen, there was one extreme event with >180 mm/day. In addition, there may have been less evaporation due to deeper infiltration of the water (less water in the top soil) and lower evapotranspiration demand (lower temperatures) at Syferkuil. This is underlined by the fact that the soil water content in Syferkuil was higher compared with that of Univen (Figure 5). Here, it is important to note that the PWP is estimated based on an established pedo-transferfunction by Minasny and Hartemink (Reference Minasny and Hartemink2011). Solar radiation was higher in Syferkuil, which may additionally contribute to higher grain yields in Syferkuil.
This comparison between the sites makes it plausible that the extreme temperatures at Univen played an important role in the yield formation of maize. This would also explain why the intercropping system was not severely affected by the different water supplies. The high total yield (combined lablab and maize yields) and LER suggested complementary water use by the intercropping system (Figure 4). This might be related to the relatively low planting density of three plants per square metre in the maize system. Between row spacing of 90 cm leaves a significant area of bare soil until canopy closure occurs. During this period, the water in the top soil could be highly prone to evaporation. In addition, this wide spacing may result in sub-optimal spatial exploitation of the water content in the soil. Maize roots grow vertically deeper before starting to grow horizontally (Ahmed et al., Reference Ahmed, Zarebanadkouki, Kaestner and Carminati2016). The lablab crop, with a more horizontal aboveground growth pattern than the erect growing maize, covered the soil quickly and hardly left any soil bare. It could be argued that soil water was more efficiently exploited in the intercropping system.
The low planting density typically used by smallholder farmers – as also used in the field trials – is an adaptation to the high climate variability from season to season through the avoidance of spending too much money on expensive maize seeds. Such a risk aversion strategy, which results in lower gains than attainable in favourable years, helps to minimise the financial losses in years with adverse climate conditions (Hoffmann et al., Reference Hoffmann, Haakana, Asseng, Höhn, Palosuo, Ruiz-Ramos, Fronzek, Ewert, Gaiser, Kassie, Paff, Rezaei, Rodríguez, Semenov, Srivastava, Stratonovitch, Tao, Chen and Rötter2018a). This behaviour might be difficult to change and could also be beneficial depending on the socioeconomic situation in which the smallholder operates for maize cropping. Despite this, the additional lablab could work to supplement this system. Lablab is a drought-resistant and robust crop, as also seen in our trial, where season hardly had an effect. Provided lablab seeds can be sold to farmers at a reasonable price; it could be a risk management strategy to provide additional biomass to overcome the trade-off between soil fertility maintenance and fodder availability during the dry season for cattle.
Further research needed on maize/lablab intercropping in southern Africa
While we could show that maize/lablab intercropping is a promising option at the two study sites, we identified three major fields for further research:
(i) Micro-climate conditions: Results of this study suggest that microclimate conditions in terms of the interactions with planting density play a key role. In particular, the high temperatures at Univen appeared to be a limiting factor. In addition, there may be different evapotranspiration rates at the two sites and seasons, which might have had a profound effect on crop growth rate. To better understand these effects, more detailed measurements are needed. We used climate data from official weather stations. Data collection was partly interrupted and gaps had to be filled from other data sources. Actual evapotranspiration rates would be of particular interest in the future.
(ii) Labour requirements: The highest yielding treatment of maize/lablab 20 DAP comes with the cost of another round of planting. Given that planting is done by hand, there is a need to quantify the additional work load. This should to be compared against possible savings in labour effort in terms of weed suppression. In our trial, we suppressed weeds from early on, which does not allow for a clear comparison between treatments in terms of their effect on weed occurrence. However, the smallholder farmers in the region typically do not implement such a high frequency of weeding. Hence, this potential needs to be explored.
(iii) Upscaling results in time (long-term rotation effects on soil organic matter and the productivity of crops), and space (farm and regional levels) is generally assumed to be challenging due to the complexity in bio-physical and socioeconomic conditions found for smallholder systems (Tittonell and Giller, Reference Tittonell and Giller2012):
First, there is a lack of farmer awareness in terms of the potential of lablab as a crop in general. Our engagement with farmers in the region often showed that lablab is not a well-known crop. Demonstration trials are essential to convince farmers that this intercropping system can be successfully implemented in their farming activities (Mthembu et al., Reference Mthembu, Everson and Everson2018). Second, as mentioned above, only two lablab cultivars are currently commercially available. However, there is a huge variation in the genetic material when it comes to fruit development, growth pattern and phenology (Pengelly and Maass, Reference Pengelly and Maass2001). This variation offers great opportunities not only to better fine-tune the interactions within the intercropping system, but also to better fulfil the specific demands of farmers. Third, integrating lablab into the cropping system has potential long-term benefits, which we could not address within the scope our field trial, namely the input of high-quality (nutrient-rich) residues. For this, crop rotation trials over several years would be of special interest to better quantify the effects of intercropping on crop growth and soil organic carbon dynamics. While we could observe heavy nodulation of the lablab roots, our study misses the quantification of the nitrogen fixation rate.
Finally, the development of site-specific management strategies for the highly heterogeneous soil and climate conditions in southern Africa, that is, upscaling the results over larger areas and several years is necessary. Crop modelling has proven to be a useful tool in the context of such work in Limpopo. Hoffmann et al. (Reference Hoffmann, Odhiambo, Koch, Ayisi, Zhao, Soler and Rötter2018b) upscaled the effects of management on peanut yield in space and time using the Agricultural Production Systems sIMulator (APSIM) model, specifically considering the effect of ENSO on yields. This enables the development of more site-specific management strategies than the current, rather broad recommendations over larger areas and across years. Such an approach would be very helpful in the development of site-specific management practices, as well as for a rather uncommon system like maize/lablab intercropping. However, modelling intercropping is still, as elsewhere, rarely conducted for southern African scenarios, with a few exceptions (for instance Tsubo et al., Reference Tsubo, Walker and Ogindo2005). The evaluation and improvement of existing approaches for maize/lablab cropping systems are required in order to attend to this research need.
Conclusions
This study demonstrated that maize/lablab intercropping provides additional biomass production in comparison to commonly cultivated sole maize cropping in the smallholder systems of the Limpopo province, South Africa. This finding, as indicated by total DM and yield output, as well as LER, was consistent across years (covering an El Niño season and a neutral season) and two contrasting sites. Our analysis suggested that high temperatures, in addition to water limitations, play an important role for final maize yield in the region. Further research is needed to better understand the link between micro-climate differences between sole and intercropping systems, and in upscaling the results to farm and regional levels. Finally, the study highlighted potential opportunities through local, underutilised crops, such as lablab for the sustainable intensification of smallholder systems.
Author ORCIDs
Hoffmann Munir P. 0000-0002-9791-5658. Reimund P. Rötter 0000-0002-3804-9964.
Supplementary materials
For supplementary material for this article, please visit https://doi.org/10.1017/S0014479719000206
Acknowledgements
This study was conducted within the Limpopo Living Landscapes project (SPACES program; grant number 01LL1304A) funded by the German Federal Ministry of Education and Research (BMBF) (http://www.bmbf.de/en/). E.R. acknowledges the support of the German Academic Exchange Service (DAAD) in funding a research visit to TROPAGS, University of Göttingen. W.C.D.N. received support from the IMPAC3 project, funded by the German Federal Ministry of Education and Research (grant number 031A351A).