

Introduction
Since 1992, private finance has been the main source of funds for large government projects in Scotland. Some £5.4 billion of private finance has been committed under signed contracts, mostly for new schools, hospitals and water infrastructure. The annual cost of these projects to the Scottish Government will be £660 million in 2009–10, a figure that will rise year on year to 2032, before declining and finally coming to an end in 2042 (Scottish Government, 2008a).
However, the use of private finance in Scotland and the UK as a whole has been controversial. Research has demonstrated that the private finance initiative (PFI) – by far the dominant form of private financing in the UK – generates financial problems for public services (Gaffney et al., Reference Gaffney, Pollock, Dunnigan, Price and Shaoul1999; Froud and Shaoul, Reference Froud and Shaoul2001; Sussex, Reference Sussex2001) and provides poor value for money (Ball et al., Reference Ball, Heafey and King2000; Audit Scotland, 2002; Pollock et al., Reference Pollock, Shaoul and Vickers2002; Shaoul et al., Reference Shaoul, Stafford and Stapleton2008).
Before coming to power in May 2007, the Scottish National Party (SNP) had been a consistent critic of PFI. In December 2007, the SNP administration published draft plans for a Scottish Futures Trust, which it presented as an alternative to PFI. This document outlined proposals for the establishment of a new government-owned company which would fund projects through ‘bonds and other appropriate commercial financial instruments at rates which would be cheaper than PFI’ (Scottish Government, 2007: 9).
A more detailed Strategic Business Case for the Futures Trust was subsequently published in May 2008 (Scottish Government, 2008b). However, by this point the planned role for the company had been curtailed. The Futures Trust was no longer envisaged as a source of finance. Instead, it would be little more than an advisory organisation, the primary role of which would be the co-ordination of programmes of government investment. The capital funds for new projects would come from other public and private sources.
One key element of this revised approach is the Non-Profit Distributing model (NPD), described as the ‘core’ of the SNP's investment strategy by Cabinet Secretary John Swinney (Swinney, Reference Swinney2008) and presented as the realisation of the party's long-standing policy of abolishing the PFI method. Giving evidence to the Scottish Parliament Finance Committee in May 2008, Swinney said NPD would end the ‘exorbitant PFI’ pursued by its predecessor and strongly advocated by the UK Treasury, while ‘eliminating excess profits’ and ‘protecting the public interest’ (Scottish Parliament, 2008).Footnote 1
In fact, the NPD model, which was introduced to Scotland under the previous Labour-led administration, is a close relative of PFI. Under both models, a private sector ‘special purpose vehicle’ is established to take on a number of project tasks, in particular the design, construction, and operation of new or refurbished infrastructure. The SPV is typically composed of a construction firm, a facilities management firm and a private equity group. Projects are mostly financed by private debt (loans from banks, or money sourced through the capital markets), and around 10 per cent private capital from the SPV member companies.
The key difference between PFI and NPD is that, whereas in the former, the SPV capital includes a small element of private equity, in the latter its members invest only loans. In consequence, while SPV shareholders receive returns on their capital in NPD, the level of these returns is to a large extent ‘capped’ at the point at which contracts are signed, and any surpluses remaining at the end of the contract are passed to a designated charity. This is distinct from the PFI model, in which surpluses are passed to SPV members as dividends.
The principle of ‘non-profit distribution’ is a unique feature of Scotland's approach to private finance, but has not received much scholarly attention. This article addresses this by providing an analysis of the private finance initiative and private finance in general, before applying the insights to the NPD model. In doing so, the analysis is restricted to private finance specifically, rather than overall efficiency in public–private projects. The rationale for this focus is that, while greater or lesser efficiency may result from the private sector's taking on and managing project risks, such as those in construction and operation, these can be transferred through various forms of procurement, for example through publicly financed design and build contracts (Palmer, Reference Palmer2000; Jenkinson, Reference Jenkinson2003; Yescombe, Reference Yescombe2007). The efficiency of contracting for these elements is therefore beyond the scope of this paper.
Budgetary drivers behind the use of private finance
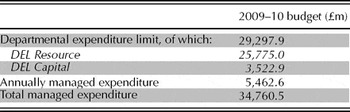
Under Section 66 of the Scotland Act 1998, the Scottish Government cannot borrow or issue bonds for investment. For publicly financed projects, therefore, it must rely on its own budget. Scottish Government expenditure on both capital (money for buildings and equipment) and revenue (money for staff and supplies) is constrained by the Total Managed Expenditure budget, which is set by the UK Treasury. TME comprises the Departmental Expenditure Limit (DEL) and Annually Managed Expenditure (AME). The latter covers expenditure such as teachers' and NHS pensions, which is variable and non-discretionary. DEL is the element of the budget over which the Scottish Government has direct control, and, as Table 1 shows, this has Resource and Capital elements.
Allocation of total managed expenditure to DEL and AME in the 2009–10 budget

Source: Scottish Government (2008a).
Under this funding regime, the Scottish Government faces two budgetary constraints on publicly financed investment. First, as it cannot borrow, the up-front cost of a project will be charged against DEL Capital, reducing the scope for alternative projects. Second, capital charges and depreciation count against DEL Revenue, reducing the money available for spending on staff and supplies. In contrast, the upfront cost of a privately financed project has no impact on DEL Capital (so long as it is accounted for ‘off-balance sheet’), and only the annual charges show up on DEL Resource. This means that, while public financing is constrained by capital and revenue budgets, private financing is limited only by the latter.
This regime creates a budgetary incentive to favour private over public finance even where the long-run cost of private finance will be higher. It is important to note that this political incentive is a consequence of financial reporting standards and does not reflect any underlying economic difference between alternative financing routes. However, there is little doubt that the ‘off-balance’ sheet nature of private finance has been an important driver behind its use in Scotland. This is a driver which is clearly vulnerable to changes in the accounting regime – a point that is returned to in below.
The cost-efficiency of private finance
Rates of return to private investors
Perhaps in recognition of the weakness of the budgetary argument for private finance, the policy is additionally justified on cost-efficiency grounds. At first blush, the economic case appears weak since the rate of interest on private money will always be higher than on government borrowing for similar projects. This is because governments, unlike private companies, do not go bankrupt or default on their payments. The risk of lending to the UK or Scottish Government is therefore low and requires a correspondingly low return.
A straight comparison of rates of return on private finance bears this out. For example, in a study of 64 PFI projects from across the UK public sector, PricewaterhouseCoopers, a leading professional advisory firm, found overall rates of return on private finance in the range of 10–13.5 per cent (PricewaterhouseCoopers and Franks, 2002). A somewhat lower range, of 7–10 per cent, was reported in an Audit Scotland (2002) study of privately financed projects for Scottish schools. If these figures are compared to the rate of return on public borrowing – of between 4 and 5 per cent over the relevant period – a significant element of ‘excess cost’ is apparent. Audit Scotland calculates that, all else being equal, the higher cost of private capital would add between £200,000 and £300,000 a year for each £10 million invested in a project.
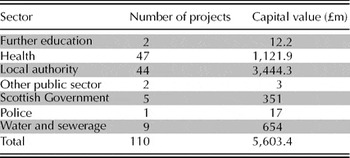
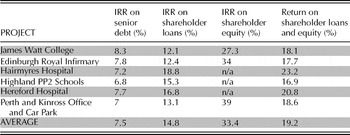
Probably the most detailed work on returns to providers of private finance has been provided by Cuthbert and Cuthbert (Reference Cuthbert and Cuthbert2008a), who looked at the projected Internal Rate of Return (equivalent to the interest rate on the projected investment cost) on all sources of private finance – senior debt, SPV shareholder loans and equity – for a group of six completed PFI schemes – five of them in Scotland, one in England (see Table 3).Footnote 2
Number and capital cost of signed private finance deals, by sector (as of November 2008)

Source: Freedom of Information response from the Scottish Government, December 2008.
Internal rates of return (IRR) on all sources of finance for six PFI contracts

Source: Cuthbert and Cuthbert (Reference Cuthbert and Cuthbert2008a).
They found that projected returns to all sources of private finance were in excess of the interest rate at which the public sector could have borrowed on its own account – 5 per cent in the relevant period. Even bank debt – money raised from banks or the capital markets with very little exposure to risk – had a rate of return more than 2.5 per cent above the Public Works Loan Board rate. The overall additional cost of finance is higher still because of the interest charged on shareholder capital (loans and equity), which was on average 19.2 per cent.
The relationship between risk and return
However, the notion that the cost of public and private finance can be directly compared is controversial. Many economists (and the UK Treasury, see HM Treasury, 2003) state that such comparisons are not valid since the public borrowing rate hides the true cost of risks involved in the related project – risks that taxpayers will have to pay for if they materialise (Klein, Reference Klein1997; Grout, Reference Grout1997; Flemming and Mayer, Reference Flemming and Mayer2003; HM Treasury, Reference Treasury2003). In contrast, the private sector makes risk explicit by discounting returns at a rate that includes a ‘risk premium’ – the rate of which is ‘competitively determined according to the risks assessed’ (HM Treasury, Reference Treasury2003: 42).
When considering an investment, a firm will estimate the magnitude of the cash-flows it expects to generate from a project year by year, and then discount these at a risk-adjusted rate to determine a present value, from which the cost of investment is then subtracted to produce a net present value (NPV). This figure will be positive (i.e. the present value will be higher than the investment cost) only if the interest rate actually charged is higher than the discount rate. And only if the NPV is positive will a rational investor take part in the project.
In a fully competitive market, a private investor's actual interest rate on finance will approximate the discount rate (that is, it will be slightly higher than the discount rate). It cannot be lower than this because this would result in a negative NPV, and a rational investor will invest his money elsewhere. It cannot be much higher because, in a maximally competitive market, other investors will be available to provide the debtor with a lower price. The argument is, therefore, that any difference between public and private sector finance costs must, in a competitive market, be a function of the risk premium.
An appropriate discount rate
While it is reasonable that a comparison of finance costs should involve an assessment of risk, it is important to be clear about what type of risk a rational investor will include when discounting. The discount rate used by a private investor is its opportunity cost of capital – in effect, the rate of return available on the next best investment opportunity presenting a similar risk profile. For a project that represents no risk, the opportunity cost of capital would be the rate of return on government bonds (or ‘gilts’). For a privately financed project for the UK public sector, then, an appropriate discount rate is constructed from the 30-year gilt rate, plus a premium reflecting the risk presented by investments of a similar type.
Importantly, corporate finance theory dictates that project-specific or ‘idiosyncratic’ risks, such as the possibility of delays, or difficulties in construction and/or operation, should not be reflected in the discount rate (Brealey and Myers, Reference Brealey and Myers2008). These risks are reflected in the ‘expected cost’ of investment, on which the interest is to be earned. The possibility that costs will be different to those estimated is real, but the related risk is diversifiable and can be pooled and spread by a diversified investor, so that it does not bear any significant risk (Quiggin, Reference Quiggin2004). To discount cash flows that have been modified to take account of idiosyncratic risks would be incorrect as doing so would double-count the cost of this risk.
The discount rate should only include ‘systematic risks’ – those that cannot be diversified because they are correlated with the market, so that all investments are exposed (even a diversified investor may lose money in a depression). For most infrastructure projects, the principal source of systematic risk concerns the demand for the services of the project – that is, the risk that demand and therefore revenue will be lower than expected (Ewijk and Tang, Reference Ewijk and Tang2003). However, for most privately financed projects in Scotland, demand risk is retained by the public sector (which agrees to pay an inflation-linked fee to the private sector regardless of numbers of users) and so this should not be included in the discount rate.
In a private finance contract in the public sector, investors are exposed to only two significant sources of systematic risk. These are: (1) that the inflation index (on which the fee paid by the public sector is based) fails to reflect actual operational costs – for example, due to above-inflation rises in the wages of construction or service staff; and (2) that a general economic downturn might place construction or service contractors in distress, and require their replacement with firms that charge a higher price than their predecessors.
These risks are non-negligible. However, there is broad agreement among experts that the level of systematic risk in a standard private finance structure will require a very small risk premium – an adjustment to the gilt rate of 1 per cent or less. The most sophisticated attempt to quantify private sector systematic risks was undertaken by the Australian government for its guidelines on project appraisal for public−private partnerships (Australian Government, 2008). This document outlines the results of a wide-ranging study into the risk matrices of standard private finance models, which are, in substance, the same as those used in the UK. It proposed a risk premium of 0.92 per cent for a standard privately financed hospital scheme.
In an authoritative consideration of this issue, Michael Spackman, an expert in public sector appraisal and the former Head of Public Expenditure Economics Group at the UK Treasury, suggested a risk premium of less than 1 per cent would be sufficient to make the private sector's cost of capital comparable with that of the public sector (Spackman, Reference Spackman2002). The same figure is proposed by Quiggin (Reference Quiggin2004) in his theoretical analysis of relative finance costs.
If it is correct that the cost of capital for private investors in privately financed schemes is around 1 per cent higher than the rate on government gilts, then it is clear that the rates of return identified by PricewaterhouseCoopers (2002), Audit Scotland (2002) and Cuthbert and Cuthbert (Reference Cuthbert and Cuthbert2008a), noted above, represent a significant element of excess cost on projects – that is, cost over and above the true cost of investment risk – and an element of bad value for the public sector. It appears that, even if the economic cost of public and private finance are the same in theory, private investors have in practice been able to earn returns well in advance of their costs of capital – and therefore significant excess profits.
Sources of inefficiency
To examine the source of excess cost, it is necessary to look at the characteristics of the private finance market. Two key assumptions in the UK Treasury's position on cost neutrality between sources of finance are: (1) low transaction costs; and (2) the existence of competitive markets. However, the empirical evidence shows that the private finance market is defined by:
(i) high transaction costs, particularly in terms of private sector bidding costs;
(ii) a highly concentrated industry, with high barriers to market entry; and
(iii) a procurement process that eliminates competitive tension between bidders.
We now turn to each of these in turn.
Transaction costs
The establishment of a private finance contract is associated with very high bidding costs for the private sector, in addition to significant negotiation costs for the public sector. A Scottish government analysis showed that procurement times for schools projects were on average 26 months, and 35 months for hospitals (Scottish government, 2008c). This implies significant expenditure on legal, financial and technical advisers, as well as internal staff, for both public and private sector parties. Dudkin and Välilä (Reference Dudkin and Välilä2005) found that the average bidding cost for successful consortia on a sample of 55 PFI procurements was 3.8 per cent of the capital value of the projects, and estimated the cost to failed bidders at a further 5 per cent. This increases interest rates on finance, as bidders seek to offset them through higher prices.
Competition in the market
In addition, the high cost of bidding provides a significant ‘barrier to entry’ to potential market entrants, preventing firms from joining the procurement process. In Scotland, according to a March 2008 Freedom of Information response from the Scottish government, the average number of bids received on signed contracts was just 2.4. The National Audit Office (NAO, 2007), found that privately financed hospitals and schools projects attracted a low number of bidders relative to other forms of procurement, and that the degree of competition for contracts had declined over time. In a sample of 46 projects that were signed between April 2004 and May 2006, one third attracted only two bidders at the point they were requested to submit detailed bids. The NAO comments: ‘it was rare for procuring authorities to choose to eliminate weaker bids: the choice was out of their hands’ (p.12).
The procurement process
Because of the complexity of privately financed schemes and the need to secure loans from banks, bidders are not required to create fully worked-up bids during the competitive phase. Instead, there is a period of exclusive negotiation following selection of a preferred bidder before the deal is signed. The National Audit Office (NAO, 2007) found, in its sample of 46 PFI schemes, that two-thirds had preferred bidder negotiations lasting over a year. The average length of this phase was some 15 months, and it was common for major changes to be made to projects during this period, including increases to prices and a re-allocation of risk.
Most authorities in the NAO's survey also identified the preferred bidder stage as the point at which advisory costs begin to escalate. During this phase, both public and private parties are making significant investments that are specific to the transaction. Given the scale of these investments, we might view this stage of procurement as a ‘bilateral monopoly’, in which the power of the monopoly seller is balanced by the monopsony power of the buyer such that a mutually advantageous contract can be developed (Williamson, Reference Williamson1985).
However, in reality, the private sector is in an advantageous bargaining position. As the NAO (2007) notes, once chosen as a preferred bidder, private consortia know that they are virtually guaranteed to win the contract. The effect of this is shown in a succession of NAO investigations (e.g. NAO, 1999, 2002, 2007) which show that bidders have been able to pass risk back to the public sector while increasing their price during the preferred bidder stage.
It should be noted that procurement regulations have changed in recent years. An EU directive, introduced into UK law from January 2006, has required the UK government to introduce a ‘competitive dialogue’ procedure, which ensures that detailed negotiations take place prior to the preferred bidder phase. It is not yet clear what impact that will have on procurements. Most practitioners expect that transaction costs will increase, but that preferred bidder periods will decrease (KPMG, 2008). In other words, the move is likely to ease the problem of monopoly pricing, but increase bidding costs and reduce competition.
Focusing on the non-profit distributing model
The high cost of private finance appears to be the result of defects in the market – high transaction costs, a highly concentrated market and exclusive negotiation in conditions of asymmetric bargaining power. The extent to which the NPD model can address these issues is likely to determine its economic success. The Scottish Government (2008b) has argued that returns to NPD investors are ‘capped’ but this is true only in the sense that returns are to a large extent fixed at the time that contracts are signed. The prices offered by the private sector are market prices, and their level will reflect conditions in the market.
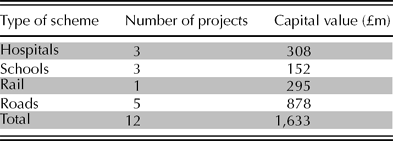
Projections of number and capital value of NPD projects in Scotland
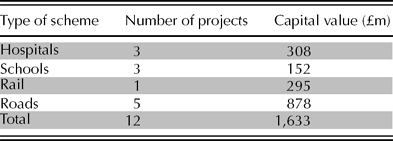
Source: Freedom of Information response from the Scottish Government, December 2008.
Transaction costs in NPDs
The NPD model is at an early stage of development and no empirical data exists on bidding costs. However, the evidence suggests that the costs of legal, financial and technical advice will be similar under NPD to those in previous private finance schemes, and indeed the very ‘newness’ of the model implies that they may be higher, at least in the short term.
Levels of transaction costs on the three NPD contracts that had been signed at the time of writing (schools projects for local authorities at Argyll and Bute, Falkirk and Aberdeen) are not known. However, documents obtained from two of these councils outline procurement time scales. (Unfortunately, access to data on the Aberdeen scheme was denied to the authors, due to ongoing ‘legal discussions’ between the council and its private partner.)
These documents show that, for Argyll and Bute, the procurement period was 30 months between the date that the project was advertised to the market and the date that the contract was signed (Argyll and Bute Council, 2004). At Falkirk, the procurement process took 26 months (Falkirk Council, 2007). These procurement timescales suggest that NPD will be associated with a similar transaction cost structure to previous privately financed projects, the direct cost of which will be reflected in the private sector's required returns.
Competition in the market for NPDs
It is not yet possible to assess the level of concentration in the supply market for NPDs, but it seems likely that, in the long term, this will be similar to past experience for privately financed schemes. In the short term, it is likely to be lower. In a memorandum to the Scottish Parliament finance committee, one accountancy firm stated – on the basis of experiential rather than research evidence – that the ‘the barring of profit distribution’ in the structure would curtail bidder interest: ‘There is clear evidence that contractors are choosing not to bid for such contracts due to these limitations’ (Grant Thornton, 2008: 2).
The documents obtained from Argyll and Bute and Falkirk councils indicate that levels of competition at project level have been similar to past experience. The Argyll and Bute project received two compliant bids, with the Falkirk scheme receiving three. In addition, a Freedom of Information response from NHS Tayside, which is in the process of procuring a hospital project, shows two compliant bidders are currently competing for the project (NHS Tayside, 2008). These numbers are comparable with the average number of bidders for all privately financed schemes in Scotland of 2.4.
The preferred bidder stage
The length of the preferred bidder stage varies significantly between Argyll and Bute (18 months) and Falkirk (nine months). The improvement in the latter scheme might point to ‘lessons learned’ through the Argyll and Bute pilot, in addition to the impact of changing procurement regulations, noted above. However, a nine month period of exclusive negotiation is clearly still a significant cause for concern. Such a long period indicates that matters of substance, rather than detail, were decided upon in this non-competitive stage.
The above discussion demonstrates that, in terms of transaction costs, market competition and the existence of exclusive negotiation, NPD does not provide any clear advantages over past experience. Transaction costs, it appears, will be high, competition is likely to be sparse and there will be scope for the private sector to secure higher prices and a lower level of risk transfer during a protracted period of exclusive negotiation.
Early evidence on rates of return
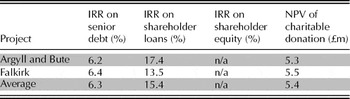
The release, under Freedom of Information, of project documents for the Argyll and Bute and Falkirk NPD schemes, has enabled the projected private sector returns to be examined, and the analysis has been undertaken by Cuthbert and Cuthbert (Reference Cuthbert and Cuthbert2008b).
Internal rates of return (IRR) on all sources of finance for two NPD contracts

Source: Cuthbert and Cuthbert (Reference Cuthbert and Cuthbert2008b).
Overall rates of returns on finance for the NPDs compared favourably with the PFI schemes they previously examined. On the Argyll and Bute scheme, the private bank debt has an IRR of 6.2 per cent, lower than any of the PFIs they had studied, where the range of IRRs on senior debt was 6.8–8.3 per cent. However, the IRR on shareholder loans, at 17.4 per cent, was relatively high – indeed, the second highest of the eight projects studied. At Falkirk, the IRR for senior debt was 6.4 per cent, but on shareholder loans the IRR was 13.5 per cent – within the range of the six PFIs.
As noted, the NPD model does not contain equity; instead, any surpluses generated through better-than-projected risk management are passed to a charity near the end of the contract period. At Argyll and Bute, the NPV of the projected charitable donation is £5.3 million; and at Falkirk £5.5 m (both figures are discounted at the 5 per cent National Loan Board rate). However, these figures are projections only, and actual donations may be lower if the private sector's performance in the contract falls below agreed standards. In this way, the donation acts as a risk buffer, so that the extent of risk transfer is less under the NPD model than under PFI.
The work of Cuthbert and Cuthbert provides early evidence that the NPD model has overall returns on finance somewhat lower than early PFI schemes. However, as the authors themselves acknowledge, it is not clear to what extent this represents a general improvement through time, and to what extent it indicates a specific benefit of NPD schemes versus the PFI model. Due to the difficulty in securing financial models for recently signed PFI schemes, this is not a question that it is possible to resolve at this time.
However, the Cuthberts' work clearly shows that both shareholder loans and senior debt were secured at a high price, relative to the opportunity cost of capital implied by these contracts – and the analysis above would suggest an overall rate of return on private finance of around 5–6 per cent. Rates of return on subordinated debt were especially high and it appears that the Scottish government expects this level of return on shareholder capital to be generalised.
Its Explanatory Note on NPD, for instance, comments that: ‘[shareholder loans are] priced akin to equity, therefore the coupon is likely to be higher than other forms of junior debt’ (Scottish Government, 2008d).
The shortfall in senior debt liquidity and the changing accounting regime
In the context of the current shortfall in banking liquidity, the cost of private capital is increasing relative to public funding. The impact of the financial crisis is two-fold. First, bond finance, hitherto much the cheapest form of senior debt finance for PFI projects, is no longer available. This is because the US ‘monoline’ insurers, such as Ambac and MBIA, lost their triple-A credit rating in the aftermath of the US sub-prime crisis. These institutions played a key role in the commercial bond market, guaranteeing repayments to bondholders in return for a fee, reducing overall financing costs, in particular for many larger projects.
Second, in the bank finance market, now the only source of senior debt for investors, liquidity has been reduced dramatically since July 2008 and, where credit is available, the cost is very high. This is partly because the banks' own cost of capital has increased due to the fact that banks are no longer willing to lend, except at high interest rates. In addition, the shortfall in liquidity has reduced competition in the senior debt market. Rather than lending individually, banks are now lending in ‘clubs’, as a result of which credit margins (the margins above the banks' own lending costs) have doubled in the last year.
Prior to July 2008, credit margins on simple accommodation schemes like schools and hospitals were between 60 and 80 basis points (0.6–0.8 per cent) above the rate at which banks themselves can borrow. This has now increased to 100–160 basis points, and is likely to increase further in 2009 (PricewaterhouseCoopers, 2008). The increase in finance costs available to the private sector comes at the same time as the level of real and nominal interest rates for long-term public borrowing has fallen to historically low levels. This was fluctuating around 4 per cent for long-term government bonds at the time of writing.
The recent financial crisis has therefore widened substantially the ‘spread’ between the costs of government borrowing and the costs of public borrowing.
At this difficult time in the financial markets, the Scottish Government's ability to keep private finance off the balance sheet, probably the major driver behind its use, is being eroded as a result of the UK public sector's move from Generally Accepted Accounting Principles to International Financial Reporting Standards (IRFS) from April 2009. In future, more private finance contracts will be accounted for according to IFRIC 12, an Interpretation of IFRS issued by the International Accounting Standards Board, the effect of which will be that most privately financed assets will be recorded on the balance sheet of the public sector and thereby score against the capital budgets of public entities (Heald, Reference Heald2008). This will substantially erode the ‘budgetary incentive’ to use private finance, noted earlier.
Conclusion
In certain situations, where contracts are easy to define, risks are well understood and competition to provide finance is active, it may be that the costs of public and private finance will be similar. However, it is clear that such conditions do not hold in the project finance market – and this applies equally well to Scotland's NPD model as to the traditional PFI structure used throughout the world.
In this market, transaction costs are extremely high, the level of competition is low and the procurement process is designed in such a way as to allow the private sector to pursue monopoly pricing. Insisting on private finance of any form in such circumstances is likely to impose significant costs on taxpayers and the users of services. The argument of the Cabinet Secretary that NPD will eliminate ‘excessive profits’ is not supported by the evidence. His claim that NPDs protect the public interest better than PFI appears to rest on the charitable donation that this model provides. But the value of this donation is uncertain.
A question may also be asked if the funding of a charity through a charge on private finance is a legitimate use of public money, given the constraints on public sector revenue in Scotland that are projected to occur over the coming years (Scottish Government, 2008a). In the context of the move to IFRS, and given that private finance is, in current market conditions, extremely unlikely to deliver good value for money, the economic rationale for continuing with private financing of any form is unclear.
The political advantage of NPD – that is, its ability to give the SNP government the appearance of doing ‘something different’ to its more business-oriented southern neighbour, while in reality responding to the same budgetary incentives that gave rise to private finance in Scotland in the first place – also looks set to be eroded.