


Introduction
Liberal democracies have experienced a significant increase in election frequency in recent decades, resulting from processes such as decentralization, European integration, growing popularity of direct democracy, and various idiosyncratic institutional reforms (Kostelka et al. Reference Kostelka, Krejcova, Sauger and Wuttke2023). While these processes expand voters’ choices, there is also evidence that they may decrease citizen participation. The existing literature finds that high election frequency is detrimental to voter turnout (Rallings, Thrasher and Borisyuk Reference Rallings, Thrasher and Borisyuk2003; Fauvelle-Aymar and Stegmaier Reference Fauvelle-Aymar and Stegmaier2008; Schakel and Dandoy Reference Schakel and Dandoy2014; Garmann Reference Garmann2017; Nonnemacher Reference Nonnemacher2021; Rivard, Bodet, and Boucher-Lafleur, forthcoming; Briatte, Kelbel and Navarro Reference Briatte, Kelbel and Navarro2024), even in legislative contests (Kostelka et al. Reference Kostelka, Krejcova, Sauger and Wuttke2023). It is thus not surprising that the ongoing proliferation of elections contributes to the global decline in voter turnout (Kostelka and Blais Reference Kostelka and Blais2021). However, the causal mechanisms remain understudied. Especially, we do not know to what extent the reduction of participation is based on conscious decisions made by citizens that would reflect their conditional perception of the participatory norm.
This paper addresses these questions and theorizes how election frequency may affect citizens’ acceptance of electoral abstention. Building on the classic voting calculus (Downs Reference Downs1957), it hypothesizes that when election frequency increases, electoral abstention becomes more socially acceptable. It tests the hypothesized mechanism through an original and pre-registered survey experiment, fielded in five countries: Czechia, France, Poland, Romania, and Slovakia. Each of these countries holds a variety of election types, ranging from presidential to European Parliament to municipal elections, and thus exposes its citizens to considerable variation in election frequency. The experiment includes 12,221 respondents interviewed between November and December 2023.
The empirical results provide pioneering evidence on the psychological effects of election frequency. They demonstrate that frequent elections make electoral abstention more acceptable to citizens, and this effect is proportional to the number of past elections. Furthermore, neither the type of past elections nor citizens’ sociodemographics and attitudes moderate this relationship. Although older citizens, those more educated, those interested in politics, and those who believe that voting is a civic duty are generally less likely to approve of electoral abstention, they are just as susceptible to the influence of election frequency as the rest of the electorate. These findings carry major implications for our understanding of voter turnout and democratic institutional engineering.
Theory and Hypotheses
According to the voting calculus (see Equation 1), the decision to cast a ballot results from a cost-benefit analysis (Downs Reference Downs1957; Riker and Ordeshook Reference Riker and Ordeshook1968; Blais Reference Blais2000). Voters participate in elections when instrumental benefits B, multiplied by the probability of casting a decisive ballot P, are larger than voting costs C. Given that P is negligible in large electorates, voting is a paradox from a purely instrumental perspective. The existing literature responds to this paradox by adding a non-instrumental term D to the equation, which stands for psychological rewards from voting (Riker and Ordeshook Reference Riker and Ordeshook1968). It reflects the fact that citizens view voting as both a duty and an ethical obligation toward their fellow citizens.
 $${\rm{Participation}} = B*P - C + D\quad$$
In empirical research, the feeling that voting is a civic duty has been found as one of the main drivers of voter turnout (Blais Reference Blais2000; Blais and Rubenson Reference Blais and Rubenson2013; Blais and Achen Reference Blais and Achen2019; Blais and Daoust Reference Blais and Daoust2020). The results of existing studies demonstrate that voters believe there is a participatory norm with which they should comply.Footnote 1 In the European Social Survey, an overwhelming majority of respondents report that good citizens vote in elections (Robison Reference Robison2023). The existence of such a norm is corroborated inter alia by the under-reporting of electoral abstention that is observed in most post-election surveys (Morin-Chassé et al. Reference Morin-Chassé, Bol, Stephenson and St-Vincent2017).
While the feeling that voting is a civic duty is fairly stable over time (Feitosa and Galais Reference Feitosa and Galais2020), its effect may depend on the context. External or personal circumstances (for example, extremely adverse weather conditions, illness, or the need to care for family members) presumably mitigate the feeling of guilt in cases of abstention. When the costs of compliance with the norm augment, citizens are not only less likely to vote but also less likely to assume that their abstention makes them bad citizens. I thus postulate that the participatory norm is best seen as conditional: good citizens have the duty to vote as long as the costs of voting remain reasonable.
Election frequency is one of the contextual factors that determine the costs of compliance with the participatory norm. When the number of separately held elections increases,Footnote 2 remaining a citizen who votes in all elections becomes much more costly compared to a situation with low election frequency. Election frequency may thus provoke voter fatigue, which corresponds to ‘a temporary reduction in willingness to act upon one’s predispositions and external incentives for voting’ (Kostelka et al. Reference Kostelka, Krejcova, Sauger and Wuttke2023, 2238). When being a good citizen becomes too costly (that is, when there are too many participatory demands), the effect of the participatory norm is partially deactivated temporarily.Footnote 3 Citizens still believe that, in normal circumstances, their duty is to participate in elections, and they disapprove of electoral abstention. However, this disapproval momentarily weakens as elections proliferate. Therefore, I hypothesize that high election frequency makes electoral abstention more socially acceptable.
Hypothesis 1 (H1) The higher the election frequency, the more socially acceptable it is to abstain in elections.
An important theoretical and empirical question is whether the effect of different types of past elections on the acceptability of electoral abstention is interchangeable. The literature has long either explicitly or implicitly suggested that first-order (national legislative and presidential) elections contribute more to voter fatigue than second-order (transnational and subnational) elections (Norris Reference Norris2002; Ezrow and Xezonakis Reference Ezrow and Xezonakis2016; Rallings, Thrasher and Borisyuk Reference Rallings, Thrasher and Borisyuk2003; Fauvelle-Aymar and Stegmaier Reference Fauvelle-Aymar and Stegmaier2008; Schakel and Dandoy Reference Schakel and Dandoy2014; Garmann Reference Garmann2017; Nonnemacher Reference Nonnemacher2021).Footnote 4 However, a systematic examination in the most extensive study of election frequency to date found that the difference in the effects of past first-order and second-order elections on current voter turnout is substantively small and statistically insignificant (Kostelka et al. Reference Kostelka, Krejcova, Sauger and Wuttke2023). These findings suggest that it is more important for participation whether any election was held recently, rather than whether this election was first-order or second-order. I, therefore, hypothesize that, when it comes to the effect of election frequency on the social acceptability of electoral abstention, it does not matter whether the past election was first-order or second-order.Footnote 5
Hypothesis 2 (H2) Election type does not matter for the relationship between election frequency and social acceptability of voter abstention.
Finally, it is plausible that election frequency exerts heterogeneous effects on citizens. Two types of attitudes are particularly conducive to participation (Blais and Daoust Reference Blais and Daoust2020): the feeling that voting is a civic duty and an interest in politics. These participation-friendly attitudes may constitute a wellspring of participatory goodwill that attenuates voter fatigue. If citizens are strongly attached to the voting norm (that is, they believe voting is a civic duty), they may resist voter fatigue and be less complacent toward abstainers. Similarly, citizens who are strongly interested in politics are likely to consider the voting act as little costly and enjoyable, thus being potentially more resistant to voter fatigue.
Hypothesis 3 (H3) Those citizens who strongly believe that voting is a civic duty are less likely to accept the excuse of election frequency for electoral abstention.
Hypothesis 4 (H4) Those citizens who are strongly interested in politics are less likely to accept the excuse of election frequency for electoral abstention.
Data and Methods
To test the new hypotheses, I pre-registered an original vignette experiment embedded in a larger public opinion survey.Footnote 6 The survey was fielded in five European countries: Czechia, France, Poland, Romania, and Slovakia. All of these countries conduct a large variety of elections,Footnote 7 which makes temporal variation in election frequency realistic and meaningful. The survey was administered via computer-assisted online interviews between November 21 and December 11, 2023. For each country, I obtained a quota-based sample defined in terms of sex, age, region, size of municipality, and education. The minimal planned sample size was 11,500 respondents (2,300 respondents per country) based on a power analysis (see Appendix E). The final sample size reached 12,221 respondents (approximately 2,450 respondents per country). This research received ethical approval from the European University Institute’s Ethics Committee.
The experiment randomly divided respondents into five equally sized groups. Each group was presented with a vignette describing a scenario about a hypothetical citizen named Peter. Peter is a regular voter, but he abstained in a recent legislative election. The vignettes varied in the degree of election frequency that preceded Peter’s abstention in the legislative election. This frequency ranged from zero (control group) to three elections. The vignettes are as follows:
-
Vignette 1 (control group): ‘In previous years, Peter regularly voted in elections. This year, one election took place: a legislative election. Peter felt busy at work and abstained in that legislative election.’
-
Vignette 2 (treatment: presidential): ‘In previous years, Peter regularly voted in elections. This year, two elections took place: a presidential election and a legislative election. After having voted in the presidential election, Peter felt busy at work and abstained in the legislative election.’
-
Vignette 3 (treatment: municipal): ‘In previous years, Peter regularly voted in elections. This year, two elections took place: a municipal election and a legislative election. After having voted in the municipal election, Peter felt busy at work and abstained in the legislative election.’
-
Vignette 4 (treatment: European): ‘In previous years, Peter regularly voted in elections. This year, two elections took place: a European Parliament election and a legislative election. After having voted in the European Parliament election, Peter felt busy at work and abstained in the legislative election.’
-
Vignette 5 (treatment: three elections): ‘In previous years, Peter regularly voted in elections. This year, four elections took place: a presidential election, a European parliament election, a municipal election, and a legislative election. After having voted in the first three elections, Peter felt busy at work and abstained in the legislative election.’
After reading their vignette, respondents were asked whether they found Peter’s decision to abstain in the legislative election acceptable or not. Their answers were given on a 0–10 scale where 0 means ‘totally unacceptable’ and 10 means ‘totally acceptable’.Footnote 8 All respondents were then invited to complete a manipulation check. They had to report how many elections took place in their vignette and in how many elections Peter abstained.
The main empirical analyses are based on an ordinary least squares regression model (see Equation 2). For each individual i from country j, abstention acceptability is regressed on a vector of country-fixed effects
 $\alpha$
and a vector of treatment dummy variables Group. The control group (Group 1) always serves as the reference category. Hypothesis 1 is tested by comparing the control to Groups 2 to 5 (variable Any Treatment), and Groups 2 to 4 (One Election) to Group 5 (Three Elections). The test of Hypothesis 2 compares the coefficients of Groups 2, 3, and 4 (variables Presidential, Municipal, and European).
 $${\rm{Acceptabilit}}{{\rm{y}}_i} = {\alpha _j} + {\beta _g}*Grou{p_i} + {\varepsilon _i}\quad$$
Respondents’ sense of civic duty and political interest are measured through two 0-10 scales (variables Duty and Interest).Footnote
9
To test Hypothesis 3, I regress the acceptability score on the variables Any Treatment and Interest, and their interaction, in addition to the country-fixed effects
 ${\alpha _j}$
(see Equation 3). The test of Hypothesis 4 replaces Duty with Interest.
 $${\rm{Acceptabilit}}{{\rm{y}}_i} = {\alpha _j} + {\beta _1}*{\rm{Any\ Treatmen}}{{\rm{t}}_i} + {\beta _2}*{\rm{Dut}}{{\rm{y}}_i} + {\beta _3}*{\rm{Any\ Treatmen}}{{\rm{t}}_i}*{\rm{Dut}}{{\rm{y}}_i} + {\varepsilon_i}\quad$$
The Appendix shows that the results are not sensitive to the exclusion of any of the five countries. Given the full randomization, the main analyses presented in the Results section do not adjust for any observables (Mutz, Pemantle and Pham Reference Mutz, Pemantle and Pham2019). However, the Appendix demonstrates that the control and treatment groups are balanced in terms of basic socio-demographics (gender, age, education, and subjective income) and that the main results are robust to the inclusion of these variables as controls or using them to adjust the analyses via propensity score matching (Abadie and Imbens Reference Abadie and Guido Imbens2006).
For many reasons, any possible effects observed in this experiment may underestimate the true effects of election frequency on individuals’ voting decisions. The experiment asks about Peter’s and not the respondents’ own hypothetical behaviour to reduce social desirability bias, endemic in surveys on turnout (Morin-Chassé et al. Reference Morin-Chassé, Bol, Stephenson and St-Vincent2017). However, respondents tend to evaluate others’ moral failures more harshly than their own. The social psychology literature shows that individuals tend to commit self-indulging attribution errors, consider situational context more heavily, and use moral license when judging their own behaviour (Jones and Nisbett Reference Jones, Nisbett, Jones, Kanouse, Kelley, Nisbett, Valins and Weiner1972; Merritt, Effron and Monin Reference Merritt, Effron and Monin2010; Ross Reference Ross2018). They are thus probably significantly more lenient toward their own abstention than the abstention of others when election frequency grows.
This experiment is also conservative in that it makes the effect of election frequency difficult to manifest. First, it focuses on participation in a legislative election, and prior research shows that voter turnout tends to be less affected by election frequency in first-order elections than in second-order elections (Kostelka et al. Reference Kostelka, Krejcova, Sauger and Wuttke2023). Second, the experiment offers a reasonable excuse for abstention: being busy at work.Footnote 10 Weaker excuses or the absence of any excuse would make respondents’ approval depend entirely on election frequency. Any observed effects in this experiment may thus be stronger for participation in second-order elections and for voters who cannot claim any legitimate excuse for their abstention.Footnote 11
Results
Figure 1 reports the means on the dependent variable for the control group and different treatment conditions. The baseline level of electoral abstention acceptance in the control group is 4.48 on the 0–10 scale. In all the treated samples, the acceptance level is higher, and in most cases, the difference is statistically significant.Footnote 12 This provides strong preliminary evidence supporting the positive effect of election frequency on the acceptance of electoral abstention.
Group Means on the Dependent Variable.
Note: 95 per cent confidence intervals.

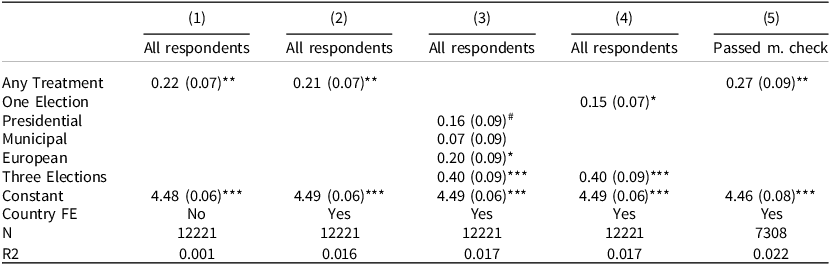
Hypotheses 1 and 2 are rigorously tested in Table 1, which includes country fixed effects. The results are graphically displayed in Figure 2. The different model specifications clearly support Hypothesis 1. According to Model 2, the treatments increase citizens’ acceptability of abstention on average by approximately 4.5 per cent (0.21 compared to the baseline level of 4.49). Model 5 reveals that the effect is even stronger (0.27, about 6 per cent) for those who passed the manipulation check. When three elections take place, the acceptability of abstaining increases according to Model 3 by 9 per cent (0.4). The difference between the effect of one election and that of three elections is substantively and statistically significant (0.25,
 $p \lt 0.001$
), which demonstrates the cumulative nature of election frequency’s effects. The more elections that take place, the more socially acceptable it becomes to abstain.
Effect of Election Frequency
Note:
OLS regression.
 $^*p \lt 0.05$
,
 $^{**}p \lt 0.01$
,
 $^{***}p \lt 0.001.$
Effects of Different Types of Treatment.
Note: Coefficients from Models 2 to 4 in Table 1. 95 per cent confidence intervals.

The results also support Hypothesis 2. A European Parliament election, which is a quintessential example of a second-order electoral contest (Reif and Schmitt Reference Reif and Schmitt1980), does not exert a substantively weaker effect than a presidential election. Although the regression coefficient of Municipal (0.07) is smaller than that of Presidential (0.16) and European (0.2), the difference is statistically insignificant (
 $p \gt 0.16$
in both cases). Altogether, there is no evidence that the type of past election matters for the effect of election frequency.
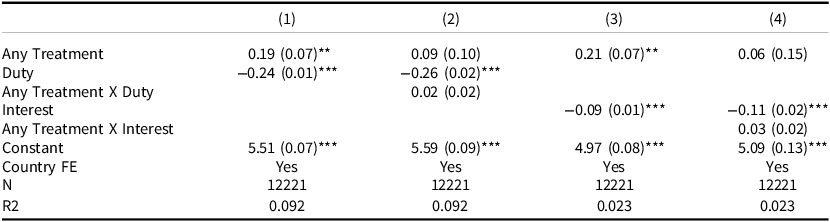
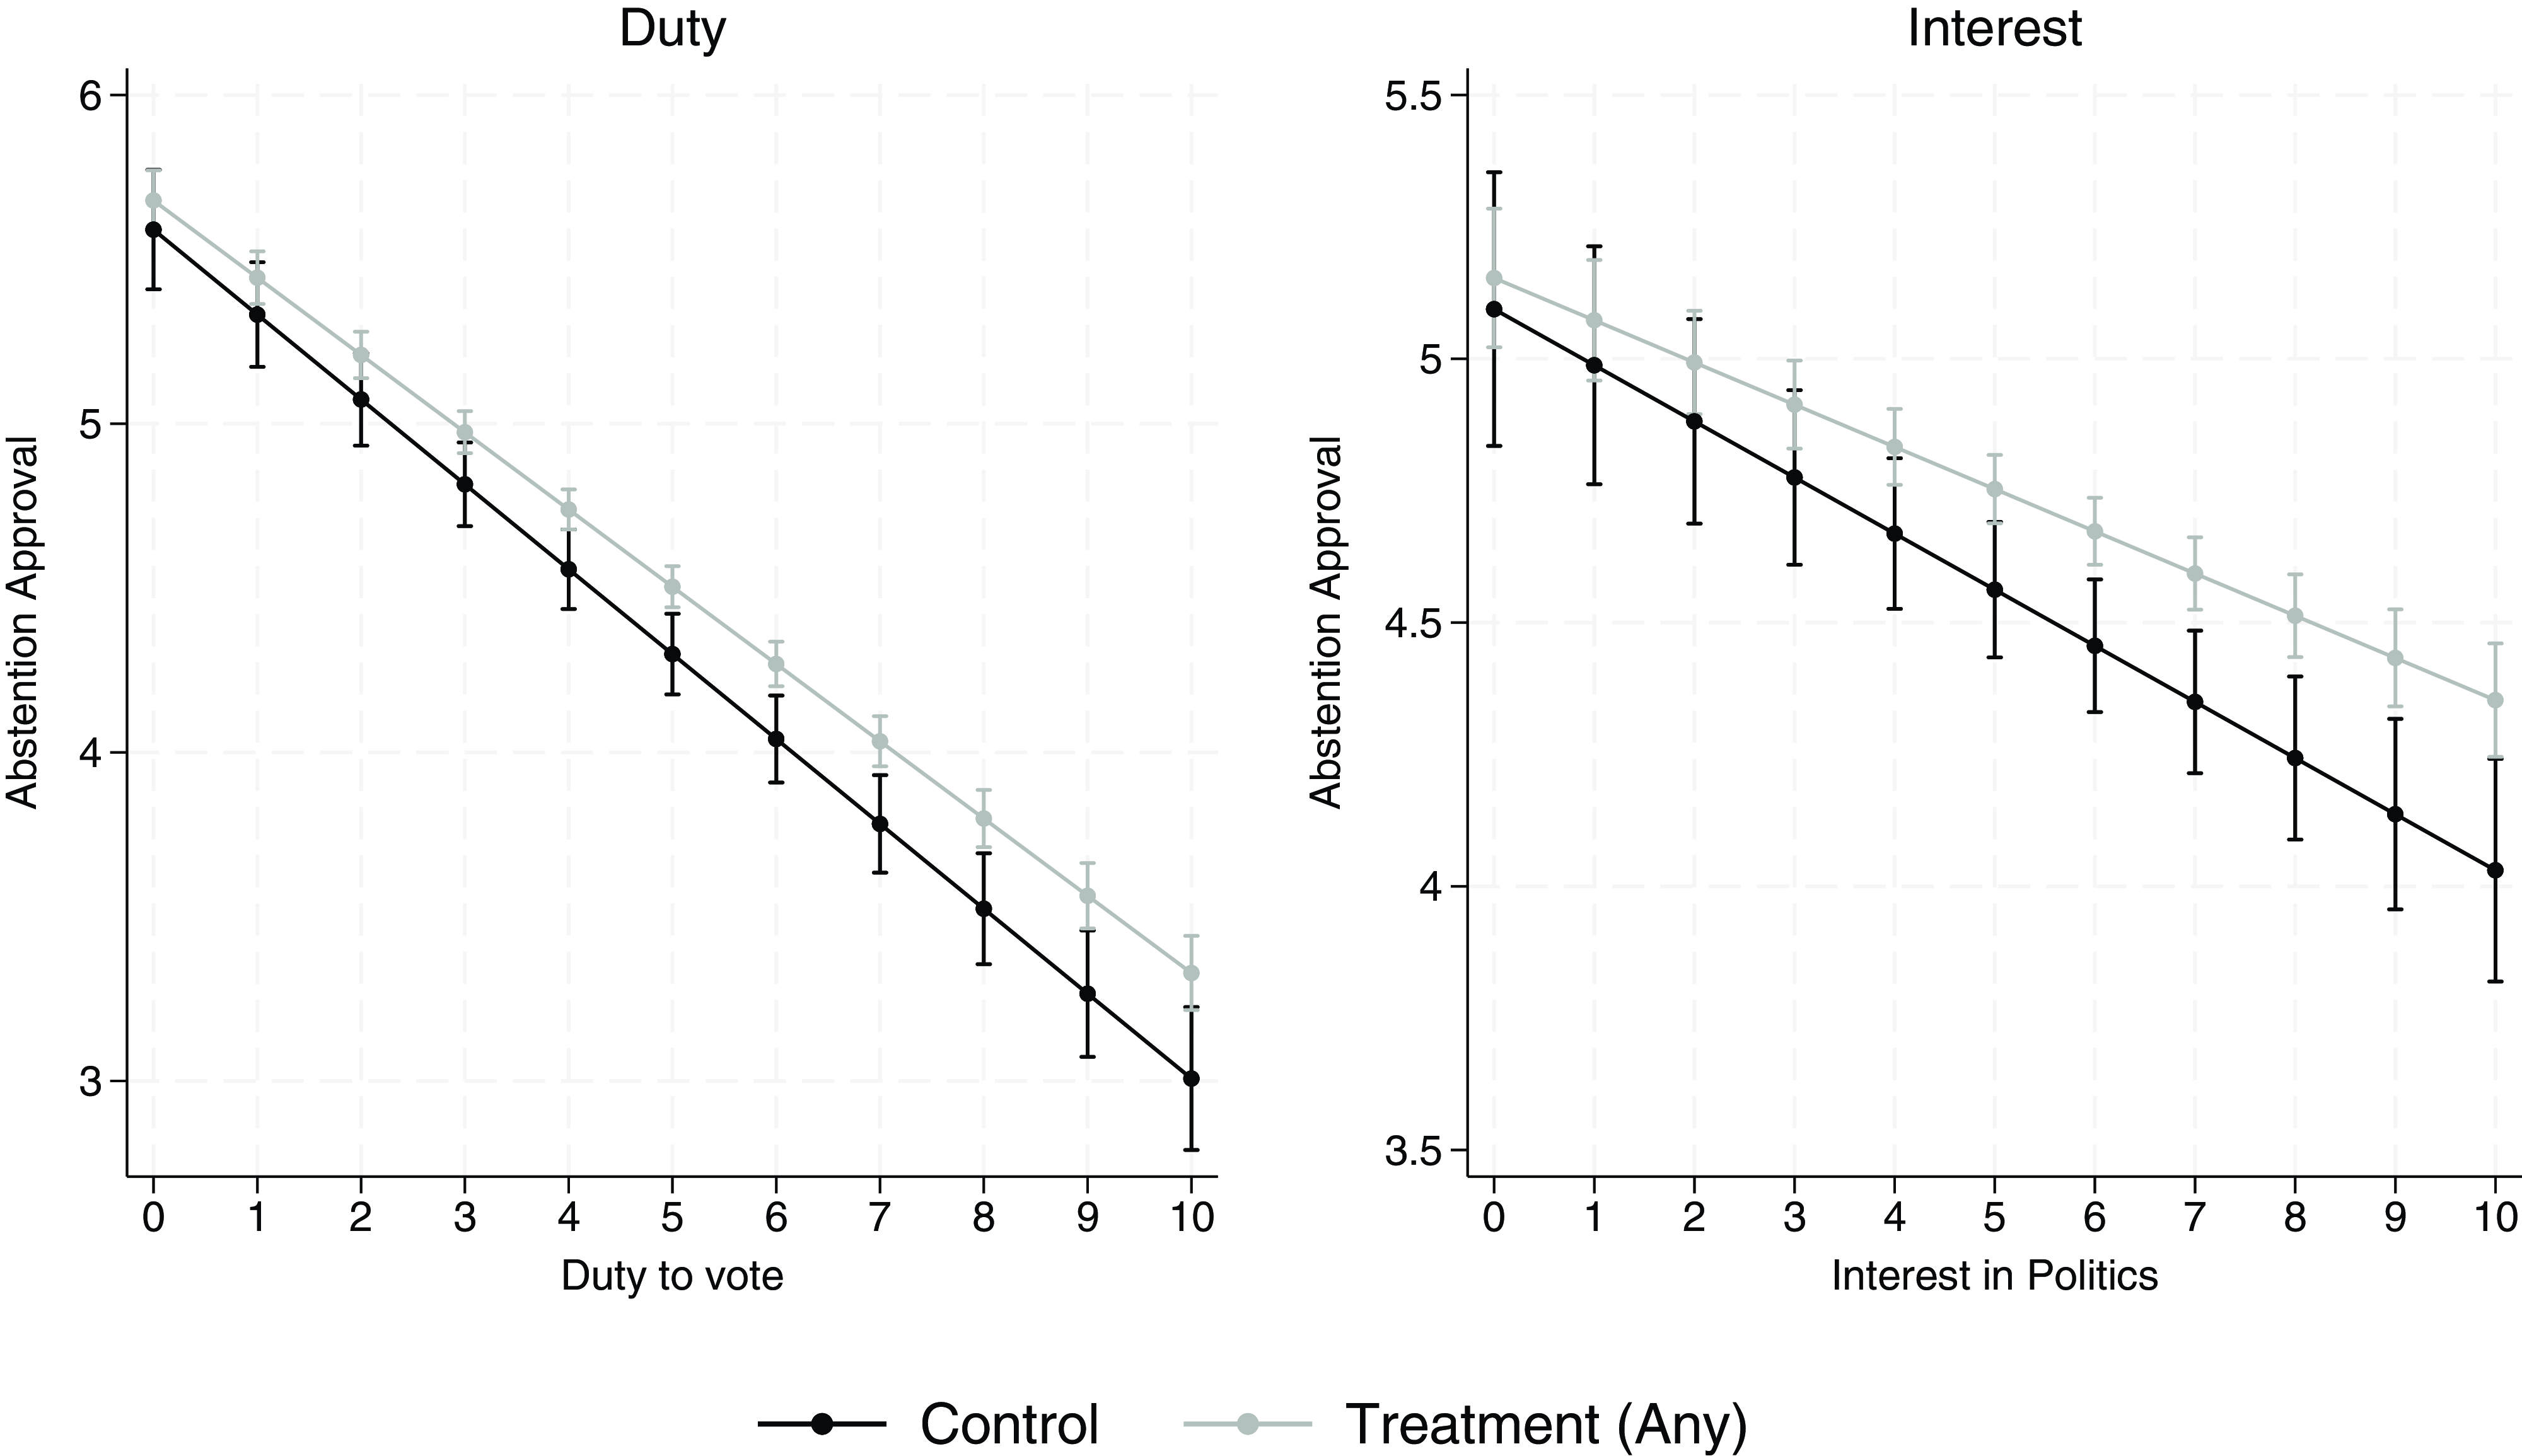
By contrast, Hypotheses 3 and 4 receive no support in Table 2. The results are graphically displayed in Figure 3. The interactions between Any Treatment and respondents’ feelings that voting is a civic duty and political interest, respectively, are substantively and statistically insignificant. Those who believe that voting is a civic duty and those who are politically interested are less likely to condone electoral abstention, but they are not less affected by election frequency. Appendix D shows that socio-demographic characteristics and reported participation in the last legislative election do not moderate the relationship either. Although female, older, more educated, and less affluent respondents, and those who voted in the last election, are less likely to approve of abstention, they are just as reactive to election frequency as anyone else.
Moderation by Political Interest and Civic Duty
Note:
OLS regression.
 $^*p \lt 0.05$
,
 $^{**}p \lt 0.01$
,
 $^{***}p \lt 0.001.$
Graphical Representation of the Results from Models 2 and 4 from Table 2.
Appendix C shows that the positive effect of election frequency on the acceptance of electoral abstention holds even when we remove any country one at a time from the sample, when we control for basic sociodemographics (gender, age group, education, and subjective income), or when we calculate average treatment effects using propensity score matching on the main sociodemographics.
Discussion
This study designed an original survey experiment to investigate how election frequency conditions the perception of electoral abstention. The analyses draw on 12,221 respondents from five countries and demonstrate a strong conditioning effect of election frequency. When abstention is preceded by participation in a recent election, it becomes significantly more acceptable to citizens. This psychological effect increases with the number of recent elections, whereas the type of recent elections does not matter.Footnote 13 No major social group is immune: the effect is observed even among those who are interested in politics and those who believe that voting is a civic duty.
The magnitude of the effect detected in this experiment is substantial (up to 9 per cent), yet it may be even stronger in the real world. As humans are subject to a variety of self-indulging biases (Jones and Nisbett Reference Jones, Nisbett, Jones, Kanouse, Kelley, Nisbett, Valins and Weiner1972; Merritt, Effron and Monin Reference Merritt, Effron and Monin2010; Ross Reference Ross2018), they are more likely to excuse their own abstention due to contextual factors than excuse that of others.
These findings align with recent analyses of voter turnout and help elucidate the mechanism behind voter fatigue. They suggest that when elections proliferate, citizens’ willingness to participate declines. There is, thus, a trade-off between the number of opportunities for electoral participation and the actual level of electoral participation. As low turnout carries undesirable consequences for equality, representation, and party competition (Blais, Dassonneville and Kostelka Reference Blais, Dassonneville, Kostelka, Rohrschneider and Tomassen2020), policymakers should strive to empower citizens without increasing the participatory burden. The most effective strategy is to reorganize electoral agendas and, when possible, hold multiple elections simultaneously, which prior research has shown to boost voter turnout (Anzia Reference Anzia2011; Fauvelle-Aymar and François 2015; Kostelka Reference Kostelka2017; Leininger, Rudolph and Zittlau Reference Leininger, Rudolph and Zittlau2018).
Future studies should corroborate the present findings with observational data and expand on them. In particular, they should explore the extent to which election frequency makes citizens perceive changes in the external social pressure to participate in their environment. They should also investigate the temporality of voter fatigue.Footnote 14 More generally, future research should investigate the degree of political participation that citizens in democracies consider appropriate and realistic.
Supplementary material
The supplementary material for this article, which includes all the appendices referred to in the text, can be found at https://doi.org/10.1017/S0007123425000171.
Data availability statement
Replication data for this article can be found in Harvard Dataverse at https://doi.org/10.7910/DVN/XY7EM6.
Acknowledgements
The experimental design used in this paper received insightful suggestions from André Blais. Furthermore, I would like to thank André Blais, Lisa A. Bryant, Eva Krejcova, Arndt Leininger, the participants of the 2024 EPSA, 2024 APSA, and 2024 SPSA conferences, and the seminar attendees at Comenius University and Matej Bel University, and three anonymous BJPS reviewers for their valuable feedback on earlier drafts of this manuscript.
Financial support
This research benefited from the financial support of the European University Institute’s Research Council.
Competing interests
The author declares none.
Ethical standards
This research received ethical approval from the European University Institute’s Ethics Committee.


 Open access

