Introduction
Clock drawing test (CDT) is a term used to describe a group of different approaches to cognitive assessment central to which is a request to draw/identify a clock face and/or its components, subsequently evaluated and scored according to predetermined criteria or concepts. Clock drawing may, in addition, be incorporated to form part of other cognitive instruments or be used in combination with other cognitive tests (Shulman, Reference Shulman2000). CDTs have been designed or used to screen for cognitive impairment (Cullen et al., Reference Cullen, O'Neill, Evans, Coen and Lawlor2007). Given its brief administration time, simplicity, confirmed validity to screen for dementia, and its ability to tap into a series of cognitive domains, especially those relating to executive dysfunction, which may be impaired early in dementia (Shulman, Reference Shulman2000; Royall et al., Reference Royall, Cordes and Polk1998; Pinto and Peters, Reference Pinto and Peters2009), it is no wonder that CDT is one of the most widely used cognitive tests (Shulman et al., Reference Shulman2006). Among the many CDT protocols introduced thus far, none has been found consistently to detect cognitive impairment under every circumstance and for every purpose, superior to the others (Shulman, Reference Shulman2000; Pinto and Peters, Reference Pinto and Peters2009). While the influence of education, language and culture on clock drawing performance has been largely acknowledged (Shulman, Reference Shulman2000; Pinto and Peters, Reference Pinto and Peters2009), there is a dearth of knowledge regarding the presumed impact of depressive disorders on CDT.
The interplay between depression and cognition is puzzling. Dementia and depression are both prevalent disorders in old age. Prevalence estimates of major depression in nondemented elderly adults vary between 1% and 10%, and the corresponding prevalence rates in elderly persons with dementia is even higher, up to 50% (Berger et al., Reference Berger, Fahlander, Wahlin and Bäckman2002).
The extent to which depression impacts on cognitive functioning, both in older subjects with and without cognitive impairment, is still debated (Fischer et al., Reference Fischer2008). The nature of objective cognitive deficits in elderly persons with depression has been demonstrated in the executive domain (Lesser et al., Reference Lesser, Boone, Mehringer, Wohl, Miller and Berman1996; Butters et al., Reference Butters2000), in short-term memory (Hart et al., Reference Hart, Kwentus, Taylor and Harkins1987), in the speed of information processing (Sheline et al., Reference Sheline2006), and in visuo-perceptive skills (Lesser et al., Reference Lesser, Boone, Mehringer, Wohl, Miller and Berman1996). Other studies could not find worse cognitive functioning in subjects with depressive symptoms, whether non-demented (Fischer et al., Reference Fischer2008) or with dementia (Berger et al., Reference Berger, Fahlander, Wahlin and Bäckman2002).
The above mentioned comprehensive reviews on CDT as a tool for cognitive screening (Shulman, Reference Shulman2000; Pinto and Peters, Reference Pinto and Peters2009) did not confront the issue of the influence of depression on clock drawing performance. Inconsistent results were found by the few studies that addressed this issue. Woo et al. (Reference Woo, Rice, Legendre, Salmon, Jeste and Sewell2004) found that CDT score was lower in elderly depressed patients with executive dysfunction than in non-depressed elderly persons or in depressed elderly persons without executive dysfunction. Bodner et al. (Reference Bodner, Delazer, Kemmler, Gurka, Marksteiner and Fleischhacker2004) reported that depressed patients differed from controls only in the clock setting task, the most difficult task, and not on easier tasks such as clock drawing, clock reading and judgment of clock faces. On the other hand, Herrmann et al. (Reference Herrmann1998) found that patients with depression did not differ significantly from controls on quantitative scores or qualitative errors, and in a study reported by Kirby et al. (Reference Kirby, Denihan, Bruce, Coakley and Lawlor2001), individuals with community-based late life depression did not perform differently on the CDT than normal controls.
Clock drawing, considered a drawing task in neuropsychological assessment, is generally analyzed only after the patient has completed the task (Shulman, Reference Shulman2000; Smith, Reference Smith2009), hence the end-stage product. Yet there is much to be gained from an analysis of the manner in which the drawing was produced (Smith, Reference Smith2009). For example, the features of drawing movements involved in clock drawing such as starting position or direction of movements, the so called “process” approach, which emphasizes the value of examining the qualitative aspects of clock drawing, might increase our understanding of brain function (Shulman, Reference Shulman2000). However, only a few of the clock drawing methods have incorporated this concept into their scoring protocols (e.g. Royall et al., Reference Royall, Cordes and Polk1998; Heinik et al., Reference Heinik2004), and data specifically concerning the role played by this observable aspect are still lacking for cognitively impaired persons as well as elderly persons with depression.
Recent developments in data collection technology enable examination of the kinematic characteristics of the drawing or handwriting process (Werner et al., Reference Werner, Rosenblum, Bar-On, Heinik and Korczyn2006) rather than its outcome. With the aid of a digitizing tablet and an instrumental pen, the researcher can monitor the drawing/handwriting in real time and store it in a format amenable to sophisticated kinematic and kinetic analysis (Slavin et al., Reference Slavin, Phillips, Bradshaw, Hall and Presnell1999). The use of such devices enables the researcher not only to measure simple temporal variables but also to achieve greater precision and detail in the assessment of the temporal and spatial dimensions (e.g. the amount of time that a person holds the pen above the drawing/writing surface or on the drawing/writing surface) and in the monitoring of other variables, such as the pressure exerted on the drawing/writing surface and the angle at which the pen is held (Werner et al., Reference Werner, Rosenblum, Bar-On, Heinik and Korczyn2006).
Kinematic assessment of handwriting or free drawings has been used to study subjects with cognitive impairment (Mattingley et al., Reference Mattingley, Phillips and Bradshaw1994; Slavin et al., Reference Slavin, Phillips, Bradshaw, Hall and Presnell1999; Schröter et al., Reference Schröter, Mergl, Bürger, Hampel, Möller and Hegerl2003; Werner et al., Reference Werner, Rosenblum, Bar-On, Heinik and Korczyn2006) and subjects with depression (Sabbe et al., Reference Sabbe, Hulstijn, van Hoff and Zitman1996; Schröter et al., Reference Schröter, Mergl, Bürger, Hampel, Möller and Hegerl2003; Mergl et al., Reference Mergl2004; Rosenblum et al., Reference Rosenblum, Dekel, Gurevitz and Heinik2010). However, to the best of our knowledge the use of kinematic analysis for clock drawings in cognitively impaired or depressed elderly patients has not yet been reported.
Therefore, in an effort to expand knowledge in this area, the aims of this exploratory study were: (a) to examine kinematically the clock drawing task in elderly patients with mild Major Depressive Disorder (MDD), as compared with healthy controls; (b) to assess the relative importance of kinematic measures for the differentiation of the groups; and (c) to analyze the associations between the clock drawing computerized measures and the cognitive and depression status of the study group.
Methods
Participants and clinical assessment
The study group included a convenience sample of 20 elderly persons with a DSM-IV (American Psychiatric Association, 1994) diagnosis of mild MDD, recruited from psychogeriatric clinic referrals following a comprehensive multidisciplinary assessment (including assessments by a geriatric psychiatrist, a geriatrician, a nurse and a social worker, and routine laboratory tests). Additionally, a control group of 20 healthy volunteers, who were recruited from among the MDD participants’ relatives and were matched for age, gender, and educational level, participated in the study. The control group underwent a similar diagnostic procedure with the exception of the laboratory tests. The study protocol was approved by the local Helsinki Committee. The participants’ sociodemographic and clinical characteristics and performance are described elsewhere (Rosenblum et al., Reference Rosenblum, Dekel, Gurevitz and Heinik2010). Briefly, the diagnosis of mild MDD was a consensus diagnosis established by two geriatric psychiatrists following interview with patients and the use of a checklist of DSM-IV operational criteria for MDD. The mild severity of MDD was characterized by the presence of only five or six depressive symptoms and only minor impairment in occupational functioning or in usual social activities or relationships with others (American Psychiatric Association, 1994). Emotional and cognitive statuses were quantitatively assessed using the 15-item version of the Geriatric Depression Scale (GDS) (Yesavage et al., Reference Yesavage1983) and the Hebrew translation of the Mini-mental State Examination (MMSE) (Werner et al., Reference Werner, Heinik and Mendel1999).
Aside from the psychiatric diagnosis, other inclusion criteria were: aged 60 years and over; living in the community in Israel for at least 20 years; right-handedness; and normal or corrected to normal vision and hearing ability. Exclusion criteria were: dominant hand tremor; weakness or sensory symptoms or signs; a history of drug or alcohol abuse; a central nervous system (CNS) disorder or a psychiatric disorder other than mild MDD. In addition, subjects with an MMSE score lower than 25 were not included in the study. The above procedure and exclusion criteria permitted us to reduce the presumed impact of treatment and medications for other conditions on the clock drawing performance.
Participants with MDD were not statistically different from controls regarding age (mean =75.70 ± 6.61 years vs. 74.55 ± 7.63, respectively), gender (75% females vs. 85%, respectively) and years of education (mean = 12.25 ± 2.69 years vs. 13.60 ± 3.57 years, respectively). MDD participants had significantly lower MMSE scores compared with controls (26.12 ± 1.02 vs 27.15 ± 0.81, t(38) 3.50, p = 0.001), and, understandably, higher scores on the GDS (7.70 ± 2.00 vs. 0.80 ± 1.05, t(38) 13.63, p < 0.001).
Equipment and clock drawing tasks
Digitizing tablet and online data collection and analysis software
An online computerized handwriting and drawing evaluation, called ComPET (Computerized Penmanship Evaluation Tool; previously referred to as POET) (Rosenblum et al., Reference Rosenblum, Parush and Weiss2003), was used to administer the stimuli and to collect and analyze the data. ComPET was developed in order to enable the collection of data on the handwriting or drawing process. The tool includes two main parts: (i) data collection, which is language-independent and easy to use for handwriting/drawing tasks; and (ii) data analysis, which was programmed via MATLAB software toolkits (see www.mathworks.com/products/matlab). The data collection is user-friendly and convenient to use. The data collection part of the software will soon be available for research purposes. The collected data will be sent to the website where the data analysis will take place (based on MATLAB) and immediately returned to the sender, with the implementation of a tele-evaluation system.
The clock drawing task was performed on A4 lined paper affixed to the surface of a WACOM Intuos 2 (model GD 0912–12×18) x–y digitizing tablet, using a wireless electronic inking pen (Model GP-110). Displacement, pressure, and pen-tip angle were sampled at 100 Hz via a 1300 MHz Pentium (R) M laptop computer. The computerized system enables the collection of spatial, temporal, and pressure data while the subject is drawing. The digitizer gives an accurate temporal measure for the total drawing performance time, both when the pen is touching the tablet and when it is in the air. Regarding the spatial measure, the digitizer gives an accurate measure when the pen is touching the tablet and/or when it is lifted up to 6 mm above the digitizer. Beyond 6 mm, the spatial measurement is not reliable, but the temporal measurement is reliable, hence only the spatial measures of drawing while the pen was in contact with the paper were included in the analysis. (For more information, visit http://www.wacom.com.)
Kinematics measures
Based on previous results (Werner et al., Reference Werner, Rosenblum, Bar-On, Heinik and Korczyn2006; Rosenblum and Werner, Reference Rosenblum and Werner2006), we focused on the following measures:
Measures for the entire task:
1. Mean number of drawn segments on the paper, where the “on paper segment” is defined as the pen trajectory from the point at which it touches the paper to the point where the pen is not touching the paper. “Touching the paper” indicates a pressure level above 50 units.
2. Mean performance time to complete the task, in seconds.
3. Mean pressure implemented towards the writing surface in non-scaled units from 0–1024. This means that the units of measurement for pressure are continuous and ranked but are not in gram per area.
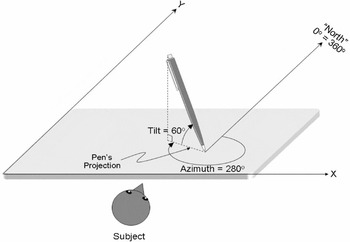
4. Mean pen azimuth for the entire task – in the range 0–360°. The azimuth is the angle between the “North” line, which is the reference line for 0° (and also 360°), and the pen's projection on the tablet. The “North” line is a line parallel to the y axis with the starting point being the pen's tip; the angle is measured clockwise.
When the pen's azimuth is near and to the right of the “North” line, the azimuth's values will be near 0°, while when the pen is near and to the left of the “North” line, the azimuth's values will be near 360°. Therefore, the azimuth range represents the motion range activating the pen while drawing (see Figure 1 for illustration).
An illustration of the pen's azimuth measure.

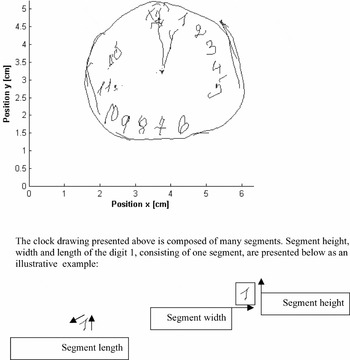
Furthermore, three representative spatial characteristics supplied by ComPET were analyzed per segment written on the paper (see Figure 2 for illustration):
1. The segment's width in centimeters (i.e. the whole segment width on the x axis)
2. The segment's height in centimeters (i.e. the whole segment height on the y axis)
3. The segment's length in centimeters (i.e. the total path length of the pen's trajectory from the point it touches the paper till the point it leaves the paper).
An illustration of the segments’ spatial measures.

Clock Drawing Task
Participants were presented with the A4 lined paper affixed to the surface of the digitizing tablet described above and given the following instruction: “I would like you to draw a clock, put in the numbers and set the time at ten minutes past eleven.” Besides the computerized kinematic analysis conducted, the clock drawings were also scored blindly by one of the investigators (J.H.) according to the criteria established by Freedman et al. (Reference Freedman, Leach, Kaplan, Winocur, Shulman and Delis1994) for the free-drawn clock. This consists of 15 critical items that constitute a total score of 15 (contour = 2 items, numbers = 6 items, hands = 6 items, center = 1 item). Optimal discrimination between well elderly and subjects with dementia was found using a cutoff of 12 out of 15 (Freedman et al., Reference Freedman, Leach, Kaplan, Winocur, Shulman and Delis1994).
Statistical analysis
Descriptive statistics (means, standard deviations) were used to describe the main variables. T-tests were used to compare the clock drawing total scores obtained using Freedman's method as well as the kinematic measures of the number of “on-paper segments” drawn.
Three MANOVA analyses were then used to test for group differences, while controlling for the participants’ cognitive status (MMSE scores). The first MANOVA was performed to assess differences in the subscores of the clock drawing task (contour, numbers, hands and center), the second MANOVA was performed to assess differences in the computerized process measures of the entire task (total performance time, pressure and azimuth), and the third MANOVA was performed to assess differences in the computerized spatial process measures per segment (segment height, width and length). Univariate ANOVA analyses were used to determine the source for the between-group differences. Pearson correlations were calculated in order to investigate the associations between participants’ clock drawing scores and computerized measures and their depression (GDS) and cognitive (MMSE) scores.
Finally, discriminant analysis was conducted in order to determine which of the clock drawing measures constitutes the best predictors of group membership. Both the clock drawing scores and computerized measures were included in the discriminant function.
Results
Comparison of clock drawing scores
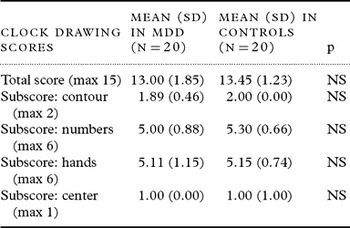
Table 1 presents the means and standard deviations of the clock drawing total scores and subscores for the two diagnostic groups. Applying the t-test to the clock drawing total score yielded no significant differences between study group and controls. Mean total scores in both were above the cut-off point of 12 suggested for cognitive impairment (Freedman et al., Reference Freedman, Leach, Kaplan, Winocur, Shulman and Delis1994). Similarly, the MANOVA yielded no statistically significant differences between the groups for each of the subscores (F(3,34) = 1.38, p =0.11).
Comparison of the clock drawing total scores and subscores

SD = standard deviation; MDD = major depressive disorder; p = significance level; NS = not significant.
Comparison of clock drawing computerized process measures
T-test results indicated that there were no statistically significant differences between the groups as for the number of on-paper segments that were drawn (mean MDD = 29.39 ± 8.45; mean controls = 28.35 ± 6.36, t (36) = 0.43, p = 0.67).
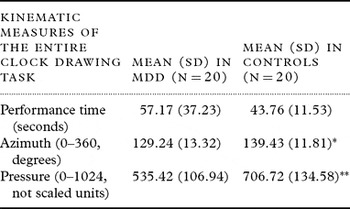
Table 2 presents the means and standard deviations of the three other computerized process measures of the entire task. The MANOVA yielded statistically significant differences between the groups across the three measures of the entire task (F(3,34) = 1.38, p = 0.011). As shown in Table 2, the subsequent univariate ANOVA analyses revealed that the significance was due to differences between the MDD group and controls on the mean pressure and azimuth measures but not in mean task performance time.
Comparison of kinematic measures of the entire clock drawing task

*Denotes a statistically significant difference between MDD and control groups at p < 0.05.
**Denotes a statistically significant difference between MDD and control groups at p < 0.01.
SD = standard deviation; MDD = major depressive disorder.
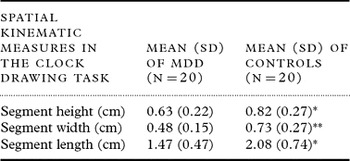
Table 3 presents the means and standard deviations of the clock drawing computerized spatial process measures per segment. The MANOVA yielded statistically significant differences between the groups across the three measures (F(3,32) = 3.14, p = 0.039). As shown in Table 3, the subsequent univariate ANOVA analyses revealed that the significance was due to differences between the MDD group and controls on all the three measures means of segment height, width and length.
Comparison of spatial kinematic measures per segment in the clock drawing task

*Denotes a statistically significant difference between MDD and control groups at p < 0.05.
**Denotes a statistically significant difference between MDD and control groups at p < 0.01.
SD = standard deviation; MDD = major depressive disorder; cm = centimeter.
Correlation analysis between the clock drawing scores, the computerized measures and the depression (GDS) and cognition (MMSE) scores
No statistically significant correlations were found between the clock drawing total score and subscores (contour, numbers, hands, center) and any of the kinematic measures studied. Additionally, no statistically significant correlations were found between the clock drawing total score, the subscores of contour, hands and center, the mean number of written segments on paper, and all the spatial measures (segments' height, width and length) and the GDS/MMSE scores. However, the clock drawing numbers subscore was moderately correlated with the MMSE total score (r = 0.33, p < 0.05) but not with the depression state as reflected in the GDS score.
Among the entire task computerized measures, performance time was significantly correlated with the MMSE score (r = −0.46, p < 0.01) but not with depression scores, and azimuth was significantly correlated with the GDS score (r = −0.43, p < 0.01) but not with the MMSE score. The pressure measure, however, was significantly correlated with both the GDS score (r = −0.55, p < 0.01) and with the MMSE (r = 0.39, p < 0.01).
Discriminant analysis
In order to assess the relative importance of the different variables in differentiating between MDD and control participants, a discriminant analysis was performed. The independent variables included were the clock drawing total score, and the computerized drawing measures of the entire task (mean performance time, pressure and azimuth) and those measured per segment (height, width, and length).
One discriminant function was found for group classification of all participants (Wilks’ λ = 0.508, p = 0.003). The variable which made the greatest contribution to group membership was the mean pressure (loading = 0.70), followed by the mean segment width (loading = −0.59), the mean segment length (loading = 0.51), the mean azimuth (loading = 0.41) and the mean segment height (loading = 0.40). Based on this function, 81.1% of the participants overall, 89 % of the MDD group, and 74% of the control group were correctly classified. A κ value of 0.623 (p < 0.001) was calculated, demonstrating that the group classification did not occur by chance.
Discussion
A computerized kinematic analysis of the entire clock drawing task (contour, numbers, hands, center) in elderly subjects with mild MDD and controls demonstrated significant between-group differences in most kinematic measures studied. More specifically, compared to healthy elderly persons, mean pressure and azimuth measures as well as the spatial measures of segment height, width and length were significantly lower in the mild MDD group, while number of paper segments and performance time did not differ.
This finding becomes more conspicuous when one considers that the scoring of the clock drawing itself, in total and for each of the components (contour, numbers, hands, center) using a traditional protocol (e.g. the Freedman method) found no differences between the groups. Given the relative “complexity” of the Freedman scoring method, and its inclusion of items sensitive to executive dysfunction (e.g. hour and minute target number indicated, hands in correct proportion) (Freedman et al., Reference Freedman, Leach, Kaplan, Winocur, Shulman and Delis1994; Heinik et al., Reference Heinik2004), we expected to find statistically significant differences between the groups using this method, especially on the hands subscore, which were, however, not found. This lack of differences may be attributed to the mild degree of depression in the depressive group.
Since the elderly partcipants in the study and in the comparison group were matched in terms of demographics (i.e. for age, sex, years of education) and controlled for cognitive status (the MMSE score), our findings suggest that the computerized system focusing on the clock drawing task might be sensitive to altered performance among people with mild MDD. The findings corroborate the results of our previous study in a same sample of elderly subjects with mild MDD and controls, which found significant between-group differences for four handwriting tasks (alphabet sequence, own name and surname, filling out a check, copying a paragraph) across temporal, spatial and pressure kinematic measures (Rosenblum et al., Reference Rosenblum, Dekel, Gurevitz and Heinik2010). Although the types of tasks in those studies were different (writing versus drawing), the same trend was found in both studies, namely a decrease in the drawing/writing pressure and sizes of output in persons with depression.
Regarding the four measures studied for the entire task, the first two (number of written segments and performance time) are considered “efficiency” measures and did not differ among the groups. Given that “psychomotor retardation” is a feature of major depression (American Psychiatric Association, 1994), we could expect the depressed participants to be slower, i.e. have a higher performance time, and consequently have a higher mean number of written segments on paper. In fact, several studies have indicated that the function of the motor system is impaired among people with depression and that considerable slowness occurs in their voluntary muscles and fine motor skills (Pier et al., Reference Pier, Hustijn and Sabbe2004). However, other authors, who applied kinematic analysis, found that drawing was not abnormally slow in depressed subjects, while handwriting was (Mergl et al., Reference Mergl2004). We may suggest that the mild nature of the MDD participants in this study might preclude manifestation of these “efficiency” measures at this stage between the groups, and that with more severe levels of depression, differences between the groups on these measures might emerge as well. Evidently, neither of the above measures in this study correlated with the GDS score. Indeed, only performance time correlated with the MMSE score, suggesting a relation between this kinematic measure and cognitive status.
On the other hand, the mean pressure and azimuth measures for the entire task were significantly different in the two diagnostic groups. The finding that lower pressure was applied by the MDD subjects on the drawing surface while grasping the pen was also found in our previous study concerning handwriting in depression (Rosenblum et al., Reference Rosenblum, Dekel, Gurevitz and Heinik2010) and described by others as well (Yanagita et al., Reference Yanagita2006). Understandably, mean pressure was significantly correlated to depression/GDS scores. While it is conceivable that lowered hand strength or handgrip strength may be a functional measure among people with depression (Yanagita et al., Reference Yanagita2006), this lower hand strength may also influence the mastery of the pen and following the pen azimuth, which essentially represents the range of motions while drawing. In fact, the azimuth measure correlated with depression/GDS in this study as well.
As a whole, the use of significantly less pressure and azimuth found in the current study means that people with depression reduce the range of their motions and the pressure implemented to the drawing surface. Literally, these objective representations may reflect the diminished energy for life of people with depression (Taft, Reference Taft1967).
The three spatial characteristics studied – segment height, width and length – were found to be significantly lower in the depressed group, and similarly smaller segments were found in mild MDD in comparison to controls, especially in longer tasks, in our previous study with handwriting (Rosenblum et al., Reference Rosenblum, Dekel, Gurevitz and Heinik2010). We may speculate that the above spatial measures have to do with requirements of the motor system and investment of energy, both presumably diminished in depression (Taft, Reference Taft1967; van Gemmert et al., Reference van Gemmert, Teulings and Stelamch2001). None of these measures, however, was correlated with either GDS or MMSE scores in this study.
The fact that none of the clock drawing scores (total and subscores) was found to be associated with any of the kinematic measures studied raises doubts about there being a meaningful specific connection between the two, not to mention that only the clock drawing numbers subscore correlated with the MMSE score but not with the GDS score. It may be claimed that kinematic analysis measures are sensitive in general to any drawing (or handwriting) task impairment whether in depressed or cognitively impaired subjects. Nevertheless, we argue that these findings are not only preferable to traditional non-sensitive methods of clock drawing assessment in depression as demonstrated in this study, but need to be considered as part of a comprehensive model of clock drawing assessment.
Discriminant analysis, in addition, found the above kinematic measures (mean pressure, segment width, segment length, azimuth and segment height, in descending order) as the best predictors of group membership. Overall 81% of the entire sample and 89% of the MDD group were accurately classified, which undoubtedly constitutes an impressive finding, especially given the mild nature of the depressive group. These results support the inclusion of the spatial measures in the discriminant analysis, even-though they did not significantly correlate with the GDS or the MMSE, as they were found to make a major contribution to group differentiation.
Several limitations are apparent in this exploratory study. First, the use of a small sample, selected from only one clinic, does not allow generalization of our findings. Second, a clock drawing protocol more suitable for the process aspects of clock drawing (e.g. Royall et al., Reference Royall, Cordes and Polk1998; Heinik et al., Reference Heinik2004) would be preferred over the technique used in the present study. Third, as already mentioned, pressure was measured in non-scaled units. A more accurate measure needs to be developed in order to further assess the influence of depression on pressure during clock drawing performance. Fourth, cognitive and depressive status could be more accurately evaluated using cognitive scales more sensitive to cognitive impairment and executive dysfunction in the elderly than the MMSE, and depression scales more sensitive to relevant specific aspects of the depressive picture, e.g. psychomotor retardation (Dantchev and Widlöcher, Reference Dantchev and Widlöcher1998) and apathy, motivation and demoralization, which are characteristic of late life depression (Cheng and Chan, Reference Cheng and Chan2007). Fifth, the current sample included only participants with mild MDD. Additional studies including participants with varied levels of depression (e.g. moderate and severe MDD) or other categories (e.g. dysthymic disorder) are necessary to evaluate the sensitivity of the suggested system for individuals along the entire depression spectrum.
Notwithstanding the above claims and limitations, we consider the present study to be a first attempt to examine kinematically – and hence more objectively – clock drawing task characteristics among elderly people with depression. This was an exploratory study designated to examine the system's sensitivity among persons with MDD in comparison to controls. Given that it appears to be sensitive to altered performance among elderly people with mild depression, two potentially useful lines of investigation emerge: the first is concerned with the pathophysiology of depression and the use of neuropsychological tools to assess as efficiently and objectively as possible the impact of major depression on neuropsychological functioning. The second is concerned with the notion of using kinematic analysis techniques of the clock drawing tasks in patients with major depression by clinicians for diagnostic and monitoring purposes (e.g. to derive meaningful cut-points for the significant variables which can be used clinically to classify patients and to estimate response to drug treatment). However, clock drawing is mostly used as an assessment instrument for cognitive disorders. Therefore, the kinematic analysis of clock drawing tasks to examine the system's sensitivity in subjects with various degrees of cognitive impairment would be another major subsequent step to pursue. We believe that a model of clock drawing performance in which end-stage product variables, process variables and kinematic variables are taken into consideration is preferable to the current CDT methods in use.
Conflict of interest
None.
Description of authors’ roles
Jeremia Heinik and Sara Rosenblum designed the study, wrote the protocol and the first draft of the manuscript. Tal Dekel performed literature searches and managed the data collection with Ilya Gurevitz. Perla Werner advised and commented on the statistical analysis and the manuscript structure. All authors contributed to and approved the final paper.