INTRODUCTION
Deposits of silt- and clay-sized material are widespread in mid- and high latitudes adjacent to present or formerly glaciated areas, where they form extensive areas of loess (Muhs, Reference Muhs2013; Li et al., Reference Li, Shi, Aydin, Beroya-Eitner and Gao2020). Less extensive deposits of a similar particle size occur in low- and mid-latitude unglaciated arid and semiarid areas, where, following Bryan (Reference Bryan1945), Smalley and Vita-Finzi (Reference Smalley and Vita-Finzi1968), Yaalon (Reference Yaalon1969), Smalley and Krinsley (Reference Smalley and Krinsley1978), Pye (Reference Pye1995), Crouvi et al. (Reference Crouvi, Amit, Enzel and Gillespie2010), and others, they have been termed “desert loess” or “nonglacial loess.” In addition, aeolian silt is incorporated in many desert and desert margin soils and slope deposits (Gerson and Amit, Reference Gerson, Amit, Frostick and Reid1987) and plays a major role in the formation of stone pavements (Amit and Gerson, Reference Amit and Gerson1986; McFadden et al., Reference McFadden, Wells and Jercinovich1987; Dietze et al., Reference Dietze, Dietze, Lomax, Fuchs, Kleber and Wells2016). Redistribution of wind-deposited material by slope and fluvial processes may accumulate in and fill ephemeral river valleys such as in Australia (Haberlah et al., Reference Haberlah, Williams, Halverson, McTainsh, Hill, Hrstka, Jaime, Butcher and Glasby2010), the Negev (Magaritz and Enzel, Reference Magaritz and Enzel1990; Enzel et al., Reference Enzel, Amit, Crouvi and Porat2010), and Namibia (Eitel et al., Reference Eitel, Blümel, Hüser and Mauz2001).
Understanding sources, transport pathways, and depositional environments of silts and loess in arid regions can constrain their paleoclimatic significance, including inference of past wind regimes (Vandenberghe, Reference Vandenberghe2013), although caution should be exercised in this process (Újvári et al., Reference Újvári, Kok, Varga and Kovács2016).
The origins of many loess deposits in areas marginal to glaciated terrains are well documented, and the processes of glacial grinding, fluvial transport, and redistribution by wind are generally well understood (Muhs and Bettis, Reference Muhs, Bettis, Chan and Archer2003) and documented by process studies of their mobilization (e.g., Nickling, Reference Nickling1978; Bullard, Reference Bullard2013). Still, the processes by which so-called desert loess deposits are generated are debated, although recent studies have added new evidence. In this article, I review the hypotheses that have been advanced to explain the nature and origins of silt-sized deposits in low- and midlatitude arid regions and discuss the processes by which this material may be generated and distributed.
Occurrence and distribution of desert loess
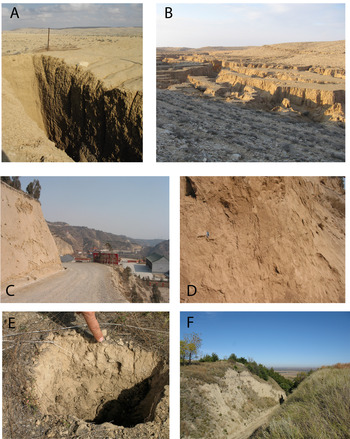
In this paper, I follow Muhs (Reference Muhs2013) and define desert loess as aeolian silt generated in and derived from low to midlatitude (10°N to 40°N) arid or semiarid regions that were not glaciated. The distribution and composition of several reported desert loess sequences is reviewed by Crouvi et al. (Reference Crouvi, Amit, Enzel and Gillespie2010), who note that typically, desert loess is usually multimodal, comprising modes in the very fine sand (63–110 μm), medium-coarse silt (20–63 μm), very fine silt (2–20 μm), and clay (<2μm) size ranges. Mineralogy is predominately quartz, with minor feldspar, and grains are often subangular; carbonates are also present in some sequences. The thickness of these desert loess sequences is variable, but often thin and discontinuous. In many cases they mantle non–quartz rich lithologies (e.g., limestone, basaltic lava flows). Figure 1 indicates the location of known and possible desert loess deposits on land. Additional silts have been identified in marine sediments from offshore areas proximal to the western Sahara (Stuut et al., Reference Stuut, Zabel, Ratmeyer, Helmke, Schefuß, Lavik and Schneider2005) and Namibia (Eckardt et al., Reference Eckardt, Washington and Wilkinson2001; Stuut et al., Reference Stuut, Prins, Schneider, Weltje, Jansen and Postma2002) and in soils and stone pavements in many arid regions (e.g., Cooke et al., Reference Cooke, Goudie and Warren1993). Many desert loess deposits occur downwind of extensive dune areas or sand seas (Crouvi et al., Reference Crouvi, Amit, Enzel and Gillespie2010), for example, in Tunisia (Coudé-Gaussen and Rognon, Reference Coudé-Gaussen and Rognon1988), Arabia (Nettleton and Chadwick, Reference Nettleton and Chadwick1996; Coque-Delhuille and Gentelle, Reference Coque-Delhuille, Gentelle, Alasharan, Glennie, Whittle and Kendall1998; Goudie et al., Reference Goudie, Parker, Bull, White and Al-Farraj2000), and the Negev (Crouvi et al., Reference Crouvi, Amit, Enzel, Porat and Sandler2008). However, desert loess is absent (e.g., Namibia, Australia) or unrecognized elsewhere. Figure 2 illustrates examples of desert loess sequences and deposits.
(color online) Global distribution of confirmed and possible desert loess deposits in relation to dune areas. Data on locations from Goudie et al. (Reference Goudie, Parker, Bull, White and Al-Farraj2000) and Crouvi et al. (Reference Crouvi, Amit, Enzel, Porat and Sandler2008).

(color online) Loess deposits in different environments: (A) loess at Mt. Haref, Israel (photograph by Dan Muhs; (B) valley fill loess NW of Mt. Keren, Israel (photograph by Dan Muhs); (C) loess sequence at Jiuzhoutai, China—overview; (D) close-up of loess deposit; (E) loess-derived soil A horizon over clayey B horizon, San Clemente Island, California (photograph by Dan Muhs); and (F) Holocene Bignell Loess, Brady paleosol, last glacial Peoria Loess, Bignell Hill, Nebraska (photograph by Dan Muhs).

Models for desert loess origins
Following the recognition of silt-sized deposits in desert margin areas, a number of hypotheses have been generated to explain their origins. All seek to provide mechanisms for the generation of silts that do not involve glacial grinding (Muhs and Bettis, Reference Muhs, Bettis, Chan and Archer2003 and references therein). The processes responsible for desert loess must be able to produce a predominance of coarse silt-sized (20–63 μm) angular quartz grains, usually with regional patterns of reduced grain size downwind. Coarse silt is one component of what is frequently referred to as “desert dust,” or just “dust,” defined as mineral aerosols derived from arid and semiarid regions. These aerosols have a wide particle-size distribution, with a prominent fine (<5 μm) component that may be distributed over long distances by wind (Mahowald et al., Reference Mahowald, Albani, Kok, Engelstaeder, Scanza, Ward and Flanner2014). The processes that produce fine mineral aerosols are distinct from those that produce quartz-rich silt and are dominated by the impact of saltating sand particles on fine-grained soils and sediments (Kok et al., Reference Kok, Eric, Timothy and Diana Bou2012 and references therein). Therefore, coarse silt is “dust,” but most “dust” is much finer and may also include minerals other than quartz and feldspar.
Siltstones are common in the rock record, and loess deposits may by derived from preexisting silt-rich rocks, such as siltstones of clastic or volcaniclastic origins, fine-grained schist, phyllite, or slate (Blatt, Reference Blatt1987; Aleinikoff et al., Reference Aleinikoff, Stafford, Muhs, Sauer and Fanning1999). Volcaniclastic origins were proposed by Zárate and Blasi (Reference Zárate and Blasi1993) for loess and sand deposits in the Pampas of Argentina. Quartz-rich silt-sized material has been proposed (but rarely tested) to be produced by a range of weathering processes that operate in arid and semiarid regions (Nahon and Trompette, Reference Nahon and Trompette1982; Wright, Reference Wright2001b; Smith et al., Reference Smith, Wright and Whalley2002; Soreghan et al., Reference Soreghan, Joo, Elwood Madden and Van Deventer2016). These include, but are not limited to, physical weathering of silicate rocks by frost action and/or salt weathering (Pye and Sperling, Reference Pye and Sperling1983). Given that the mean size of quartz grains in plutonic rocks and gneiss is around 700 μm, such processes need to be capable of reducing such grains by as much as 90% (Smith et al., Reference Smith, Wright and Whalley2002). In particular, Smith et al. (Reference Smith, Wright and Whalley2002) emphasize the importance of preexisting microfractures in the weathering of quartz grains to silt.
Detrital silt may be concentrated as a result of transport by multiple episodes of slope and fluvial processes, during which size sorting and comminution of larger clasts may occur. Deposition in distal fluvial settings, followed by deflation and aeolian transport, deposition, and reworking, may further abrade grains (Wright, Reference Wright2001a, Reference Wright2001b). Following this approach, Wright (Reference Wright2001b) developed sediment transport pathways for the production of silt-sized material for loess deposits in Tunisia (Fig. 3) and northern Nigeria using a multistage model. This multistage model was generalized by Muhs and Bettis (Reference Muhs, Bettis, Chan and Archer2003) to provide a framework for the generation of silts in arid regions (Fig. 4) that also included abrasion in dune sand environments and resuspension of fines trapped in between sand grain—“resident fines” (Bullard et al., Reference Bullard, McTainsh and Pudmenzky2004)—as a secondary process of emission of fine material driven by movement of sand by saltation.
Schematic model for origins of desert loess in Tunisia (Wright, Reference Wright2001b).

Generalized model for possible origins of nonglacial loess (after Muhs, Reference Muhs2013).

Production of silt by abrasion of sand grains during aeolian transport was initially proposed by Smalley and Vita-Finzi (Reference Smalley and Vita-Finzi1968), building on classical sedimentological arguments and the experimental work of Kuenen (Reference Kuenen1960) and others. They suggested that grain-to-grain contacts during saltation might chip and abrade angular and subangular sand-sized quartz grains produced by weathering of granite to generate particles of around 50 μm in diameter.
The efficacy of abrasion to produce silt has been debated for decades. Recently, it has been used to support the hypothesis that current and former areas of active dunes are the primary sources for present-day dust and coarse silt generation in the Negev and Sahara and for loess deposits in the Negev Desert, southwestern Arabia, Tunisia, northern Nigeria, Namibia, and Argentina, as well as silt deposited in offshore marine sediments in northwestern and southwestern Africa (Crouvi et al., Reference Crouvi, Amit, Enzel, Porat and Sandler2008, Reference Crouvi, Amit, Enzel and Gillespie2010, Reference Crouvi, Schepanski, Amit, Gillespie and Enzel2012). In addition, Amit et al. (Reference Amit, Enzel, Mushkin, Gillespie, Batbaatar, Crouvi, Vandenberghe and An2014) have suggested that abrasion of sands in proximal dune areas is a major process that provided coarse silt particles to the Chinese Loess Plateau. Using modern dust storm frequency data as an analog, they estimated that this process could provide sufficient material to account for rates and patterns of accumulation of thick late Pleistocene loess deposits. Further, the proposed abrasion process can explain the regional trends of decreasing grain size away from upwind dune areas. Geographic association, however, does not prove that the loess was derived from upwind dune areas. Extensive loess sequences occur downwind of the Nebraska Sand Hills, but isotopic and geochemical evidence indicates that the source(s) of the sand and the loess was different (Aleinikoff et al., Reference Aleinikoff, Muhs, Bettis, Johnson, Fanning and Benton2008; Muhs et al., Reference Muhs, Bettis, Aleinikoff, McGeehin, Beann, Skipp, Marshall, Roberts, Johnson and Benton2008) and that silt deflated from areas upwind of the dune field was transported across the dune area and deposited downwind (Mason, Reference Mason2001; Muhs et al., Reference Muhs, Bettis, Aleinikoff, McGeehin, Beann, Skipp, Marshall, Roberts, Johnson and Benton2008).
In the Sahara, Crouvi et al. (Reference Crouvi, Schepanski, Amit, Gillespie and Enzel2012) related the occurrence of dust storms to areas of different soil types and found that 28% of all dust storms occurred in areas of sand dunes and that 32% of dust hot spots (sensu Schepanski et al., Reference Schepanski, Tegen and Macke2012) were located in areas of sand dunes. However, dust emissions from Saharan dune areas have not been shown as containing coarse silts. The main assertion of the abrasion model is that grain-to-grain abrasion of quartz and feldspar sand grains can create coarse silt-sized particles that are then transported downwind by short-distance suspension (sensu Tsoar and Pye, Reference Tsoar and Pye1987). Despite field evidence to support the abrasion model (Crouvi et al., Reference Crouvi, Amit, Enzel, Porat and Sandler2008; Enzel et al., Reference Enzel, Amit, Crouvi and Porat2010; Amit et al., Reference Amit, Enzel, Mushkin, Gillespie, Batbaatar, Crouvi, Vandenberghe and An2014), the kinematics of abrasion are uncertain, and laboratory experiments for the generation of fine particles by grain-to-grain impacts provide conflicting results.
Sedimentary and geomorphic evidence for desert loess provenance
The particle-size distribution, mineralogy, and geochemistry of desert loess deposits can provide important information on their provenance and potentially constrain the processes by which the sediments originated. However, there are few studies that provide the information necessary to reliably establish the origins of coarse silt deposits in arid regions. In many cases, geochemical and grain-size parameters are considered separately, leading to different interpretations of provenance. When combined, they provide a powerful tool to examine loess composition, source(s), and transport pathways, as shown by Muhs (Reference Muhs2018, Fig. 13).
This section summarizes information from the localities with the most robust data sets and briefly discusses additional candidate areas. Loess deposits downwind of the Grand Erg Oriental (Tunisia) and the Negev–Sinai sand seas provide good evidence for the importance of these dune areas as a source of coarse silt-sized material. Other possible examples include silt deposits in Yemen, northern Nigeria, Argentina, central Asia, and northwestern Namibia (Crouvi et al., Reference Crouvi, Amit, Enzel and Gillespie2010), as well as the Channel Islands of California and the Canary Islands.
Studies of the desert loess of Matmata in southeastern Tunisia (Coudé-Gaussen and Rognon, Reference Coudé-Gaussen and Rognon1988) showed that these coarse (median grain size: 63 μm), quartz-rich (30%–65%) loess sequences have a composition and heavy mineral assemblage similar to the sands of the Grand Erg Oriental which lies 20-50 km to the west (see data in tables 1 and 2 in Crouvi et al., Reference Crouvi, Amit, Enzel and Gillespie2010). New dating and magnetic susceptibility measurements of the loess sequence indicate that the loess accumulated 100–250 ka (Dearing et al., Reference Dearing, Livingstone, Bateman and White2001), much earlier than suggested by Dearing et al. (Reference Dearing, Livingstone and Zhou1996) and Coudé-Gaussen and Rognon (Reference Coudé-Gaussen and Rognon1988).
Widespread loess adjacent to the Negev–Sinai dune field (Fig. 2A and B) is quartz rich and has a bimodal grain-size distribution (Fig. 5) with fine (3–8 μm) and coarse (50–60 μm) modes (Crouvi et al., Reference Crouvi, Amit, Enzel, Porat and Sandler2008; Enzel et al., Reference Enzel, Amit, Crouvi and Porat2010). The fine mode is interpreted to represent far-traveled dust from Saharan sources, while the predominant coarse mode is suggested to have a proximal source in the dune fields to the west, which is the only possible source of quartz in the region. Whereas the dune sands are rounded, the silt is angular, and many grains show evidence of chipping and fracturing (Crouvi et al., Reference Crouvi, Amit, Enzel, Porat and Sandler2008). The loess deposits coarsen upward, primarily as a result of the increasing proportion of the coarse mode in these sediments. This is interpreted as a result of the increasing proximity of the dune field as it prograded eastward. Crouvi et al. (Reference Crouvi, Amit, Enzel, Porat and Sandler2008) concluded that abrasion of sand in the dune field is the only potential source of the coarse silt. Optically stimulated luminescence (OSL) ages for the loess and for dune deposits suggest that enhanced sand transport and abrasion occurred during the last glacial period, when winds may have been stronger and a source of sand was exposed in the Nile River delta region by eustatic sea-level lowering (Enzel et al., Reference Enzel, Amit, Crouvi and Porat2010; Amit et al., Reference Amit, Enzel, Crouvi, Simhai, Matmon, Porat, McDonald and Gillespie2011; Muhs et al., Reference Muhs, Roskin, Tsoar, Skipp, Budahn, Sneh, Porat, Stanley, Katra and Blumberg2013).
Particle-size distribution of representative samples from the Negev loess units in (A) Mt. Harif, (B) Ramat Beka, and (C) Hura village sequences. All samples show bimodal distribution with modes at 50–60 μm and 3–8 μm. Vertical rectangles mark the boundary between the modes, located at 15–20 μm (from Crouvi et al., Reference Crouvi, Amit, Enzel, Porat and Sandler2008).

The Chinese Loess Plateau is the largest single deposit of what could be nonglacial loess (Fig. 2C and D). The Quaternary sequence of loess and paleosols represents an important archive of climatic conditions in Asia and has been studied extensively (Maher, Reference Maher2016), although the source(s) of sediment is still being explored and a mix of glacial and nonglacial loess has been proposed (Muhs, Reference Muhs2018). Recent particle-size analyses and end-member modeling (Prins et al., Reference Prins, Vriend, Nugteren, Vandenberghe, Lu, Zheng and Jan Weltje2007) show that the loess is composed of two main components: (1) a fine-grained (clayey silt) that could have been derived from far-traveled dust (modal grain size: 19 μm); and (2) a coarse silt (modal grain size: 40–63 μm) derived from proximal sources. The proportions of these two components vary spatially and temporally, with a general fining of the loess toward the southeast. Similar results were obtained by Wen el al. (Reference Wen, Wu, Tan, Li and Fu2019) from the adjacent Mu Us desert, with the addition of a locally derived fine sand component. Amit et al. (Reference Amit, Enzel, Mushkin, Gillespie, Batbaatar, Crouvi, Vandenberghe and An2014) present evidence from natural field experiments and spatial analyses of published information on particle size on the Chinese Loess Plateau that aeolian abrasion of sand grains in the Mu Us, Tenegger, and Badain Jaran sand seas could have provided the bulk of sediment for the Chinese Loess Plateau. This is consistent with rare earth element (REE) data that suggest that these dune areas (and the loess) were sourced from alluvial sediments derived from the Altay and Quilian Shan Mountains (Sun, Reference Sun2002a, Reference Sun2002b; Muhs, Reference Muhs2018). This contrasts with the evidence from geochemical and mineralogical provenance studies that indicate that at least some of the loess was derived by deflation of Yellow River fluvial sediments (Stevens et al., Reference Stevens, Carter, Watson, Vermeesch, Andò, Bird, Lu, Garzanti, Cottam and Sevastjanova2013). It is likely that this source contributed to the sands of the Mu Us dune field (Licht et al., Reference Licht, Pullen, Kapp, Abell and Giesler2016; Wang et al., Reference Wang, Wu, Tan, Fu, Wen and Li2019) and, via their abrasion, to the loess (Xu et al., Reference Xu, Stevens, Yi, Mason and Lu2018). Reworking of preexisting loess deposits (Kapp et al., Reference Kapp, Pullen, Pelletier, Russell, Goodman and Cai2015; Licht et al., Reference Licht, Pullen, Kapp, Abell and Giesler2016) and intercalation of dune sand and loess deposits on the northern margin of the Chinese Loess Plateau (Xu et al., Reference Xu, Stevens, Yi, Mason and Lu2018) indicate that loess accumulation and sources likely varied over time (Bird et al., Reference Bird, Stevens, Rittner, Vermeesch, Carter, Andò, Garzanti, Lu, Nie, Zeng, Zhang and Xu2015).
Loess deposits are widespread in the foothills and piedmonts of the mountains of central Asia, but their source(s) is poorly known (Schaetzl et al., Reference Schaetzl, Bettis, Crouvi, Fitzsimmons, Grimley, Hambach and Lehmkuhl2018). In the Illi basin of southern Kazakhstan, Fitzsimmons et al. (Reference Fitzsimmons, Nowatzki, Dave and Harder2019) analyzed the relationships between potential sediment sources, wind regimes, and loess deposits and concluded that most of the loess is derived from areas within 50 km of the deposit location. Back-trajectory analyses suggest the main sources for loess in southern Kazakhstan lie in areas where dunes and fine-grained sediments are juxtaposed, as in river source–bordering dune fields and alluvial plains. In the eastern part of the basin, local sources also dominate, based on particle size and geochemistry of the loess and potential sources (Li et al., Reference Li, Song, Fitzsimmons, Chen, Wang, Sun and Zhang2018).
McTainsh (Reference McTainsh1984) provides particle-size data to indicate that fine-grained soils mantling Precambrian metamorphic and igneous rocks near Zaria in northern Nigeria have a trimodal distribution with prominent modes at 75, 44, and <2μm, within the range of particle sizes in modern Harmattan dust sampled in the region. McTainsh argued that the coarser modes represent remobilization of fines deposited on vegetated aeolian sand sheets and dunes of late Quaternary age (Stokes and Horrocks, Reference Stokes, Horrocks, Alsharan, Glennie, Whittle and Kendall1998) to the east of the area; while the finer mode represents primary deposition of Harmattan dust, derived from the Bodélé Depression and the area of paleo-Lake Chad. Similar and discontinuous loess-like deposits have been described from several areas on the Sahel margins of Mali and Senegal, but have yet to be studied in detail (Crouvi et al., Reference Crouvi, Amit, Enzel and Gillespie2010).
Deposits of coarse silt have been identified in two areas of the Arabian Peninsula—northeastern parts of the United Arab Emirates (UAE) (Goudie et al., Reference Goudie, Parker, Bull, White and Al-Farraj2000) and eastern Yemen (Nettleton and Chadwick, Reference Nettleton and Chadwick1996; Coque-Delhuille and Gentelle, Reference Coque-Delhuille, Gentelle, Alasharan, Glennie, Whittle and Kendall1998). In the Ras al-Khaimah area of the UAE, loess deposits occur adjacent to the Oman Mountains and are carbonate rich (mean 58.5 wt. %). Median (carbonate-free) grain size is 59 μm (Goudie et al., Reference Goudie, Parker, Bull, White and Al-Farraj2000), and the coarse silt-sized grains are dominantly quartz. Although the loess occurs downwind of the extensive linear dunes of the northern Rub’ al Khali, Goudie et al. (Reference Goudie, Parker, Bull, White and Al-Farraj2000) argue that the loess was derived by deflation from distal alluvial fan and coastal plain surfaces (where there are extensive dune fields), with salt weathering of quartz grains and short transport distances indicated by surface textures. Studied silt deposits of inferred aeolian origin in Yemen appear to have been reworked, forming fills in bedrock valleys and other topographic depressions, and thus appear similar to deposits of a similar nature described from Namibia (Eitel et al., Reference Eitel, Blümel, Hüser and Mauz2001) and Australia (Haberlah et al., Reference Haberlah, Williams, Halverson, McTainsh, Hill, Hrstka, Jaime, Butcher and Glasby2010). Given the location of these loess deposits, their occurrence may indicate a source in the extensive dune fields of the Rub’ al Khali.
Loess is widespread in the Pampas region of Argentina (Zárate and Tripaldi, Reference Zárate and Tripaldi2012) and occurs adjacent to extensive areas of dunes. Information on sand and loess composition indicates a dominant volcaniclastic origin in the Andean cordillera with minor contributions from local sources, with dunes forming in proximal locations and the loess deposits forming in distal (eastern) areas (Zárate and Blasi, Reference Zárate and Blasi1993; Zárate and Tripaldi, Reference Zárate and Tripaldi2012). End-member analysis of the particle-size distribution of loess sequences and comparisons to modern dust storms by Torre et al. (Reference Torre, Gaiero, Cosentino and Coppo2020) indicate that the fine-silt component dominates the loess deposits, and its median grain-size fines to the southeast from 20 to 10 μm. Torre et al. (Reference Torre, Gaiero, Cosentino and Coppo2020) interpret this component as representing far-traveled dust from the Puna–Altiplano Plateau. Coarse silt (median grain size ranging from 51 to 34 μm) makes up 26%–50% of the loess and is interpreted as being sourced from areas in central-west Argentina—especially the distal Andean piedmont, where multiple periods of fluvial and aeolian deposition are recorded (Tripaldi et al., Reference Tripaldi, Zárate, Brook and Li2011; Tripaldi and Forman, Reference Tripaldi and Forman2016).
Silt-sized sediments are widespread in the ephemeral river valleys of northwestern Namibia, as are silt mantles on adjacent hillslopes (Eitel et al., Reference Eitel, Blümel, Hüser and Mauz2001). These authors suggested that the silts represent material derived from both local and distant sources. These include weathering of locally occurring metamorphic and volcanic rocks and far-traveled carbonate-rich dust from outcrops of Cenozoic calcretes and playas such as Etosha Pan located to the east. Crouvi et al. (Reference Crouvi, Amit, Enzel and Gillespie2010) also suggested that extensive stabilized dune fields in the northwestern Kalahari may also be a source of silt-sized material for areas of northwestern Namibia.
Silt mantles in the Channel Islands of California (Fig. 2E) with a modal grain size of 20–40 μm represent a further example of coarse silt deposits downwind of a major desert source. Their mineralogy and geochemistry indicate that they were likely derived from the Mojave Desert (Muhs et al., Reference Muhs, Budahn, Reheis, Beann, Skipp and Fisher2007). Similar silt mantles occur offshore of the northwestern Sahara in the Canary Islands (Muhs et al., Reference Muhs, Budahn, Skipp, Prospero, Patterson and Bettis Iii2010).
Experimental evidence for silt generation by grain-to-grain impacts and abrasion
A number of laboratory experiments have been conducted over the years to examine the processes and effectiveness of grain-to-grain impacts and abrasion during simulated saltation transport of sand grains. Two major processes can be identified: (1) chipping and spalling of the exposed vertices of initially angular grains and (2) abrasion of iron and clay-mineral coatings on grains.
Kuenen's laboratory experiments on abrasion (Kuenen, Reference Kuenen1960, Reference Kuenen1969) provided evidence of abrasion of crushed quartz grains with a diameter of 1.6 mm. The experiments determined a loss of up to 20% by weight in the equivalent of 64 km of travel. The cumulative loss of material increased asymptotically with distance traveled, and the overall magnitude of loss increased significantly with the applied wind speed (Fig. 6A). However, the loss of material by abrasion decreased with initial particle size and roundness, with larger and more angular grains experiencing more abrasion. Kuenen hypothesized that chipping of angular and subangular quartz grains was the major process in aeolian abrasion as a result of the brittle nature of quartz, but abrasion decreased and was ineffective when grains reached 50 μm. Importantly, he also pointed to the significance of mixed particle sizes in transport, where impacts of larger grains on smaller grains was hypothesized to be more effective compared with those involving a uniform size range. Kuenen's experiments with feldspar grains, however, showed a much more rapid (3–5 times) rate of abrasion, again with a decrease with grain size.
(color online) Generation of fine sediment by abrasion: (A) data from Kuenen (Reference Kuenen1960); (B) redrawn from Wright et al. (Reference Wright, Smith and Whalley1998); and (C) redrawn from Bullard et al. (Reference Bullard, McTainsh and Pudmenzky2004); numbers refer to different sand samples.

Whalley et al. (Reference Whalley, Marshall and Smith1982) provided a fresh impetus for experimental studies of abrasion of quartz grains using a newly developed experimental apparatus in which grains are agitated in an airstream and the fine particles released are trapped by an electrostatic precipitator. These investigators were able to demonstrate chipping and fracturing of grains to produce both fine and coarse silt-sized particles. Initial results (Whalley et al., Reference Whalley, Smith, McAlister, Edwards, Frostick and Reid1987) indicated that originally angular grains are rapidly rounded by chipping of edges and corners, producing coarse- and medium-silt attrition fragments. Further abrasion experiments using crushed quartz (Wright et al., Reference Wright, Smith and Whalley1998) and Hungarian sandstone (Smith et al., Reference Smith, Wright and Whalley1991) showed that simulated aeolian abrasion can rapidly produce silt (10–60 μm) particles, with more than 40% of the fines generated in the first 16 h of the simulations, decreasing thereafter as grains become more rounded and chipping and fracturing of grains decreases (Fig. 6B). Based on their experiments, Wright et al. (Reference Wright, Smith and Whalley1998) estimated that as much as 287 g/kg fines could be produced in this manner in an aeolian transport event of 96 h duration. The mass of the particles generated is, however, much greater than observed in any other experiment, so these estimates should be treated with caution.
Using similar experimental procedures and subangular to rounded sand from active dune crests in the Simpson Desert, Bullard et al. (Reference Bullard, McTainsh and Pudmenzky2004, Reference Bullard, McTainsh and Pudmenzky2007) reported the generation of only 0.41%–0.98% (mean 0.6%) weight percent fines after 72 h of abrasion, most of which (58%–87%) was generated in the first 16 h of the experiment (Fig. 6C). Coarse silt (10–63μm) made up 11%–32% of the released fine particles. Many of the coarser particles released in this period were likely contained in the original sample, which was not washed before the experiment. Although the initial experiments showed that silt-sized particles could be generated in this way, abrasion of clay coatings was identified as a source of very fine (<10 μm) particles, which made up 80%–90% of the released material (Bullard et al., Reference Bullard, McTainsh and Pudmenzky2004, Reference Bullard, McTainsh and Pudmenzky2007; Bullard and White, Reference Bullard and White2005).
A different experimental approach was adopted by Swet et al. (Reference Swet, Elperin, Kok, Martin, Yizhaq and Katra2019), who used wind tunnel experiments with natural dune sands containing a variable content of fine (<63 μm) material. They concluded that resuspension of existing fine particles contributes the majority of fine-particle emissions; abrasion of grains in active desert dune environments can also generate fine material, mostly through loss of clay coatings.
Modeling of the processes of grain abrasion and chipping can provide valuable insights into the processes that can generate fine particles. For example, Dutta et al. (Reference Dutta, Zhou and dos Santos1993) provide evidence from kinematic modeling to indicate that the crystal structure of common feldspars can be disrupted by impacts generated by winds of 10 m/s or higher. The processes of chipping and spalling can also be evaluated via simple experiments that show that protruding areas of high curvature abrade more rapidly, resulting in rounding of initially square particles (Durian et al., Reference Durian, Bideaud, Duringer, Schröder and Marques2007). Such processes can also be modeled numerically by simulating repeated chipping of the exposed corners of target grains to produce an anisotropic shape with a wide range of angles and facets (Krapivsky and Redner, Reference Krapivsky and Redner2007).
Field studies of dust emissions and abrasion from dune areas
Dune areas, especially those stabilized by vegetation, and/or soil formation may be a reservoir of fine particles (<63 μm) deposited from upwind sources and/or generated by weathering during soil formation. Field studies of the particle-size composition of such areas and wind tunnel and sediment transport experiments provide insights on landscape-scale generation of fine particles. The majority of these field studies indicate that the measured emitted material is much finer than the coarse silt that is characteristic of desert loess deposits.
Vegetated dune fields in the southwestern Kalahari may release significant quantities of fine material if reactivated by drought or climate change, as measured by dust generator experiments (Bhattachan et al., Reference Bhattachan, D'Odorico, Okin and Dintwe2013). Resuspension of PM10-(particulate matter <10 μm diameter) particles increases by an order of magnitude from bare (active) dune crests (mean 15.2 mg/m3) to interdune areas (mean 239.6 mg/m3), with vegetated dune crests intermediate in response (51.8 mg/m3). The resuspended material contains 0.662–0.814 mg/g of iron compounds, suggesting that it is derived from abrasion of clay coatings on quartz sand grains. An example of the potential for reactivation of vegetated dune fields in drought conditions is given by Bolles et al. (Reference Bolles, Forman and Sweeney2017), who estimated that during the severe Dust Bowl drought of the 1930s on the southern High Plains of Kansas, more than 60% of total suspended particles in 1939 were derived from uncultivated dunes and sand sheets as a result of a decreased vegetation cover.
Field experiments in the Mojave, Negev, and Chinese deserts using a field wind-erosion simulator indicate that although silt- and clay-sized material is largely absent (3% or less) from the sediments of active dunes, they are efficient emitters of dust with an aerodynamic diameter of 10 μm or less (Sweeney et al., Reference Sweeney, McDonald and Etyemezian2011, Reference Sweeney, Lu, Cui, Mason, Feng and Xu2016). Dune areas rank second to dry riverbeds as potential dust sources. Sweeney et al. (Reference Sweeney, McDonald and Etyemezian2011) hypothesize that the high and uniform rates of dust emission from dune areas (mean 0.1443 g/m2/s) are related to the constant reworking of the upper few centimeters of the surface sand by the wind, exposing more sediment for emission of dust. In a geographically extensive study of dust emission potential in Chinese deserts using the same methodology, Cui et al. (Reference Cui, Lu, Wiggs, Etyemezian, Sweeney and Xu2019) found that the highest dust emissions in dune areas were from coppice dunes, where abundant fine material trapped by vegetation exists in conjunction with actively saltating sand. Emissions from active dune areas were 5 times lower than from coppice dunes as a result of a low (2%) content of fines. These experiments indicate that although emissions of fine (<63 μm) particles from dune areas may be significant, the rates measured by the experiments cited relate to material <10 μm in diameter, much of which is likely from resuspension of previously deposited material (resident fines) or abrasion of grain coatings.
Field studies in the Nellis dune field of southern Nevada show that the sediments of active (unvegetated) dunes contain an average of 3.23% silt (2–63 μm); with vegetated dunes containing 4.95% of this size class (Goossens and Buck, Reference Goossens and Buck2011). However, these studies showed that both unvegetated and vegetated dunes emitted “nearly no” material in the coarse silt size range.
The Oceano coastal dune field of south-central California is unusual, in that it is a source of fine particulate matter (PM10 and PM2.5) that gives rise to exceedance of state and federal air-quality standards downwind (Huang et al., Reference Huang, Kok, Martin, Swet, Katra, Gill, Reynolds and Freire2019). Oceano dune sands are mineralogically immature and are characterized by a high content (46% by mass) of feldspar grains, which may be partially weathered in this salt-rich environment, as well as clay minerals. Scanning electron microscopy indicates that abrasion of sand-sized feldspar grains is a possible source of fine particles, in addition to removal of clay coatings on other (mostly quartz) grains. Dust emissions are mostly in the very fine (PM2.5) range and likely result from a combination of abrasion of feldspars, removal of clay coatings, and resuspension of fines by saltation impacts.
Although not fully representative of processes in quartz- and feldspar-dominated dune fields, irregularly shaped, elongated coarse gypsum grains at White Sands, New Mexico, were found by Jerolmack et al. (Reference Jerolmack, Reitz and Martin2011) to become more equant with distance downwind and that abrasion and spalling of larger particles generates smaller, less equant grains. Grain size and shape change asymptotically and change little beyond 5–6 km downwind of the primary source area. Analyses of particle size in relation to available wind energy indicate that the larger grains move by saltation, whereas the smaller grains are transported in suspension, and the latter likely make up the fine loess-like sediments found downwind of this dune field (Ewing, Reference Ewing, Lancaster and Hespin press).
Correlations between periods of dune activity and loess accumulation
Evidence for dune areas as possible sources of coarse silt and fine particles requires coeval loess accumulation and intervals of dune activity (Crouvi et al., Reference Crouvi, Amit, Enzel and Gillespie2010). For example, comparison of records of dune activity in western Mauritania and dust deposition offshore (Fig. 7) indicates that the maximum dust flux occurred at 18–17 and 13–12 ka (McGee et al., Reference McGee, deMenocal, Winckler, Stuut and Bradtmiller2013), similar to OSL-dated dune accumulation at 25–15 and 13–10 ka (Lancaster et al., Reference Lancaster, Kocurek, Singhvi, Pandey, Deynoux, Ghienne and Lo2002). Even with good correspondence between the timing of dust deposition offshore and dune activity on land, there is no evidence to indicate that the linear dunes of western Mauritania were the source of the dust, as modern analogs indicate a wide range of possible source areas in the northwestern Sahara desert (Stuut et al., Reference Stuut, Zabel, Ratmeyer, Helmke, Schefuß, Lavik and Schneider2005).
(color online) Relationships between dust deposition in marine sediments offshore of NW Africa (McGee et al., Reference McGee, deMenocal, Winckler, Stuut and Bradtmiller2013) and periods of optically stimulated luminescence–dated dune accumulation in the Sahara and Sahel (data from INQUA Dunes Atlas Chronologic database – Lancaster et al., Reference Lancaster, Wolfe, Thomas, Bristow, Bubenzer, Burrough, Duller, Halfen, Hesse, Roskin, Singhvi, Tsoar, Tripaldi, Yang and Zárate2016). Dune activity index is the number of ages for each time period.

Similar relationships between ages of dune accumulation and loess deposition exist in the Negev–Sinai area (Crouvi et al., Reference Crouvi, Amit, Enzel, Porat and Sandler2008; Enzel et al., Reference Enzel, Amit, Crouvi and Porat2010). The very fine sand components of loess in locations close to the present dune field became prominent only after 19 ka, with maximum accumulation at 13–11 ka, when dunes reached the site (Enzel et al., Reference Enzel, Amit, Crouvi and Porat2010). The upper coarse unit in neighboring loess deposits is OSL-dated to 50–14, 44, 14, and 19–11 ka at different sites (Crouvi et al., Reference Crouvi, Amit, Enzel, Porat and Sandler2008). OSL ages for dune sands and archaeological evidence indicate that the last major phase of the Negev–Sinai dune field accumulation occurred after 23 ka, with major periods of rapid dune development during 16–13.7 and 12.4–11.6 ka (Enzel et al., Reference Enzel, Amit, Crouvi and Porat2010; Roskin et al., Reference Roskin, Porat, Tsoar, Blumberg and Zander2011a, Reference Roskin, Tsoar, Porat and Blumberg2011b). Proximity to the dunes and the chronology of the loess indicates that the dune field was likely the source of the coarse mode of the loess deposits, generated by abrasion of grains in intense wind events during the late Pleistocene and Younger Dryas stade. Differences between the bulk mineralogy of the dune sand and loess provide further evidence that the dunes provided material for the loess deposits. The loess is enriched in softer minerals (K-feldspar, plagioclase, and calcite) indicating that abrasion depleted these minerals in the dunes (Muhs et al., Reference Muhs, Roskin, Tsoar, Skipp, Budahn, Sneh, Porat, Stanley, Katra and Blumberg2013).
In the Nebraska Sand Hills and vicinity, the Peoria Loess was deposited at the same time that dunes upwind were active (Mason et al., Reference Mason, Swinehart, Hanson, Loope, Goble, Miao and Schmeisser2011), but the dunes were not the source of the loess (as discussed earlier) and acted as a zone of sediment bypassing for silts deflated from areas upwind and in transport to depositional sites to the southeast (Mason, Reference Mason2001; Muhs et al., Reference Muhs, Bettis, Aleinikoff, McGeehin, Beann, Skipp, Marshall, Roberts, Johnson and Benton2008). Similarly, the Holocene Bignell Loess (Fig. 2F) was deposited at the same time as periods of dune activity in the Nebraska Sand Hills (Miao et al., Reference Miao, Mason, Swinehart, Loope, Hanson, Goble and Liu2007). Both dune activity and loess deposition occurred in periods of dry, windy, and dusty conditions, but without a genetic linkage.
DISCUSSION
Wind-transported coarse silts in arid regions display considerable variability in their characteristics and actual and potential sources. A common feature of many desert loess sequences is their location downwind of major dune areas, although as discussed earlier, geographic proximity is not proof of origin. There is a lack of well-constrained particle-size, mineralogical, and geochemical data sets to make inter-comparisons and determination of sources possible. Consistent information on the processes of coarse silt generation, transport, and deposition is similarly limited, with a range of laboratory simulations and few attempts to quantify the kinematics of coarse silt production by grain-to-grain impacts. Many field studies have concentrated on the environmentally significant fine silt and smaller particle sizes (e.g., PM10, PM2.5) that may be transported long distances, and it is unclear how much, if any, coarse silt is actually emitted in present-day conditions from dune areas or other potential sources.
The formation and accumulation of desert loess deposits can be considered in the conceptual framework of Kocurek and Lancaster (Reference Kocurek and Lancaster1999). This includes a supply of sediment of coarse silt size, conditions that make this material available for transport by wind, sufficient wind energy to transport the sediment from source areas to depositional areas, and conditions therein that promote deposition.
Sediment supply
Production of material of coarse silt size primarily involves either weathering of primary bedrock, comminution of preexisting grains of a larger size, or derivation from primary silt-sized materials such as volcanic ash. Generation of silt by weathering is constrained by defects in the crystalline state of quartz crystals (Blatt, Reference Blatt1967) resulting from tensile stresses generated during the cooling and crystallization of quartz in plutonic igneous rocks (Smalley and Marković, Reference Smalley and Marković2019). In this scheme, cooling and crystallization of quartz in granitic rocks produces crystals that weather primarily to sand size (>63 μm); formation of silt-sized grains is possible via breakage of these grains at preexisting defects, which are strongly affected by tectonic processes (Blatt, Reference Blatt1967; Smalley and Vita-Finzi, Reference Smalley and Vita-Finzi1968). Coarse silt-sized grains can also be produced by weathering and erosion of metasedimentary rocks. Silt is abundant in fluvial and aeolian deposits derived from the Himalayas and adjacent mountain ranges of central Asia, demonstrating the importance of uplift and intense weathering (plus a contribution from glacial grinding) in a tectonically active mountain region to silt production (Assallay et al., Reference Assallay, Rogers, Smalley and Jefferson1998; Sun, Reference Sun2002b; Muhs, Reference Muhs2018). Silts on the southern sides of these mountains are deposited by distributed alluvial systems (mega-fans) or in submarine fans (e.g., the Bengal Fan). On the northern margins of the ranges, rivers contribute sediment to arid regions with largely internal drainage, from which it is redistributed by wind, contributing to the extensive, and in places thick, loess deposits from Kazakhstan to China.
Comminution of sand-sized grains by abrasion and chipping has been widely advocated as a mechanism to produce coarse silt particles in deserts. Apart from the Negev and possibly the Chinese Loess Plateau, there really is not much evidence to support or reject the abrasion hypothesis. Chipping and reduction of angular sand-sized grains has been demonstrated theoretically and numerically. Laboratory experimental studies have, however, produced variable results and may not be comparable to natural processes. For example, relatively high rates of chipping and coarse silt generation have been reported from studies using crushed vein quartz that may have crystal structures and angularity that are different from those in naturally occurring sands (e.g., Wright, Reference Wright2001a; Smith et al., Reference Smith, Wright and Whalley2002). Production of abundant coarse silt by reduction of angular particles to those that are subangular or subrounded appears to require a constant source of more angular grains and is self-limiting, as demonstrated by the exponential decay of silt production in the results of abrasion experiments. The subangular to subrounded nature of most dune sands (Goudie and Watson, Reference Goudie and Watson1981) is a good indication that that chipping and spalling are an effective process, given high rates of sand transport. Natural field experiments confirm that this form of abrasion can produce coarse silts from dune sands (e.g., Amit et al., Reference Amit, Enzel, Mushkin, Gillespie, Batbaatar, Crouvi, Vandenberghe and An2014). Studies using natural dune sands (e.g., Bullard et al., Reference Bullard, McTainsh and Pudmenzky2007) suggest that abrasion of clay and iron coatings is also a viable process, but produces only very fine particles (<10 μm), and is also likely to be self-limiting. Furthermore, this process is not really silt production from sand, but release of material produced elsewhere and adhered to sand grains during periods of aeolian stability.
Sediment availability
Fluvial processes are the main way that silt is transported from weathering sites to desert basins, where it is deposited on distal alluvial fans and basin floors. Mobilization of coarse silt-sized particles from alluvial sources typically requires that surfaces are impacted by saltating sand grains which eject fines into the airstream (Kok et al., Reference Kok, Eric, Timothy and Diana Bou2012), although direct entrainment of silt has been demonstrated by Sweeney and Mason (Reference Sweeney and Mason2013). Thus alluvial plains and dry riverbeds with mixed grain-size sediments are a possible source of coarse silt. Such surfaces have been identified as major sources of fine sediment for aeolian transport to desert soils in the Mojave Desert (Sweeney et al., Reference Sweeney, McDonald and Markley2013; Cui et al., Reference Cui, Lu, Wiggs, Etyemezian, Sweeney and Xu2019) and for loess deposits in the Illi basin (Fitzsimmons et al., Reference Fitzsimmons, Nowatzki, Dave and Harder2019). In the Sahara and its margins, patchy interdune lacustrine and playa deposits dating to the African humid period are widespread (Lézine et al., Reference Lézine, Hély, Grenier, Braconnot and Krinner2011) and may be an important source of silt (e.g., Ehrmann et al., Reference Ehrmann, Schmiedl, Beuscher and Krüger2017).
Although the sands of active dunes frequently contain only 2%–3% grains <63 μm, studies indicate that dunes are effective emitters of fine sediment as a result of the continual reworking of surface sediments. This suggests that much of the emitted material from dune areas is composed of previously deposited fines. The available information suggests, however, that much of this material is much finer (PM10, PM2.5) than coarse silt (e.g., Sweeney et al., Reference Sweeney, Lu, Cui, Mason, Feng and Xu2016; Huang et al., Reference Huang, Kok, Martin, Swet, Katra, Gill, Reynolds and Freire2019), but the instrumentation to produce these data only measured the finer particles.
Resuspension of fines as a result of reactivation of vegetation-stabilized dunes represents a further potential source of silt for loess deposits downwind. The availability of abundant saltating sand grains and a high content of trapped fines results in high emissions from such landforms (Cui et al., Reference Cui, Lu, Wiggs, Etyemezian, Sweeney and Xu2019). Many dune areas in the southern and western Sahara and its margins were stabilized by vegetation and soil formation during the early Holocene African Humid Period (Felix-Henningsen et al., Reference Felix-Henningsen, Kornatz and Eberhardt2009). Wind erosion of the paleosols was a major contributor to enhanced dust emissions from the Sahara during and after modern drought episodes (Mulitza et al., Reference Mulitza, Heslop, Pittauerova, Fischer, Meyer, Stuut and Zabel2010). This indicates the potential for dust emissions from the reactivation of dunes and/or erosion of paleosols as contributors to desert loess formation.
Sediment transport capacity
Tsoar and Pye (Reference Tsoar and Pye1987) provide a comprehensive analysis of the constraints on transport of silt-sized material for desert loess formation. Their work provides a framework for estimating transport distances from source areas to depositional sinks for particles of different sizes under a range of wind velocity and turbulence conditions (Table 1). Given the size range of coarse silt (20–63 μm), it is to be expected that this size grade would be transported in short-term suspension for distances of up to a maximum of several hundred kilometers during dust events.
Maximum transport distance for silt-sized particles.

Reanalysis of transport distances for different particle sizes using eq. 8 in Tsoar and Pye (Reference Tsoar and Pye1987) provides important constraints on possible source areas for desert loess deposits.

where L is transport distance; $\bar{U}$ is mean wind speed; ε is the coefficient of turbulent exchange; K = ρsg/18m (where ρs is the grain density; μ is the dynamic velocity of air; and g is gravity), and D is the grain diameter.
Transport distance scales with mean wind speed (Fig. 8A) and decreases exponentially with particle size for a given wind speed (Fig. 8B). The magnitude of transport distance for a given set of boundary conditions is highly dependent on the coefficient of turbulent exchange (ɛ) (Fig. 8B). This lends support to the hypothesis that dust transport was significantly enhanced during glacial episodes, when pressure and temperature gradients are modeled to be higher than preindustrial values (McGee et al., Reference McGee, Broecker and Winckler2010).
Maximum transport distances: (A) under conditions of increasing mean wind speed for coefficient of turbulent exchange of 104 and mean particle size of 30 and 50 μm; and (B) in relation to particle size for wind speeds of 16 m/s for values of coefficient of turbulent exchange of 104 (blue) and 105 (orange). (For interpretation of the references to color in this figure legend, the reader is referred to the web version of this article.)

Under moderate wind speed (12 m/s) and turbulence exchange (ɛ = 104) conditions, very fine sand components of desert loess are likely to be derived from sources within 2–3 km of the deposit; and coarse silt (30–50 μm) from up to 50 km away; while 20 μm particles could be transported from as far as 228 km away. However, with elevated values of ɛ (105), very fine sand could be derived from areas up to 30 km distant. The probable range increases exponentially with decreasing particle size, up to 450 km for 30 μm particles.
A similar analysis conducted by Amit et al. (Reference Amit, Enzel, Mushkin, Gillespie, Batbaatar, Crouvi, Vandenberghe and An2014) indicates that the sources for the coarse silt component of late Pleistocene Chinese Loess Plateau sequences must be nearby and not in sources thousands of kilometers away. These distal sources could only have provided the finer grains (clay size), and isotopic and geochemical indicators point to distant sources for this size range (Sun, Reference Sun2002a; Muhs, Reference Muhs2018). Analyses of modern dust particle size and composition on the loess plateau show that the modal size of dust near the surface (10 m height) is 25–35 μm, decreasing to 12–15 μm at a height of 140 m, suggesting that the majority of the silt composing the loess sequences was transported at very low levels of the atmosphere by strong spring northwesterly winds (Sun et al., Reference Sun, Chen, Bloemendal and Su2003) and was likely derived from proximal sources. These observations also provide support for the derivation of the coarse silt in Negev loess deposits from adjacent dune areas. They also indicate some of the challenges in assessing source areas for the coarse silt component of desert loess, which could be derived from a wide area, with diverse sources. However, modern and paleo-wind direction data from independent sources (e.g., sand dune orientations) can be used to develop pathways for sediment transport in conjunction with back-trajectory modeling, as demonstrated by Fitzsimmons et al. (Reference Fitzsimmons, Nowatzki, Dave and Harder2019).
Deposition site characteristics
Assuming a supply of coarse silt and winds of sufficient strength to transport it, deposition will occur when and where the particle-settling velocity exceeds the upward turbulent motions of the lower part of atmospheric boundary layer or where precipitation washes out the silt.
Increases in surface roughness as a result of vegetation cover and/or topography promote reductions in sediment transport capacity by extracting momentum from the airflow (Wolfe and Nickling, Reference Wolfe and Nickling1993), leading to rapid deposition of sediment (Tsoar and Pye, Reference Tsoar and Pye1987). As a result, desert loess deposits occur in desert margin areas with increased precipitation and vegetation cover compared with potential source areas (e.g., Sahel, Argentina, Chinese Loess Plateau, Negev) or in areas of complex topography (e.g., Tunisia, Illi basin). The importance of vegetation as a trap for loess deposition is indicated by the relationships between millennial-scale changes in climate and vegetation cover and spatial and temporal variations in the accumulation rate of loess on the Chinese Loess Plateau (Xu et al., Reference Xu, Stevens, Yi, Mason and Lu2018).
A composite model for the occurrence and formation of desert loess sequences
Although many desert loess sequences occur downwind of dune fields and sand seas, geographic proximity does not necessarily provide a genetic link between dune activity and loess accumulation. A composite model, based on field evidence from the Nebraska Sand Hills (Mason, Reference Mason2001; Muhs et al., Reference Muhs, Bettis, Aleinikoff, McGeehin, Beann, Skipp, Marshall, Roberts, Johnson and Benton2008) and the Chinese Loess Plateau (Amit et al., Reference Amit, Enzel, Mushkin, Gillespie, Batbaatar, Crouvi, Vandenberghe and An2014; Xu et al., Reference Xu, Stevens, Yi, Mason and Lu2018), suggests that dune fields may be both generators of coarse silt and transport pathways for coarse silts derived from upwind sources (Fig. 9). As many dune fields and sand seas lie downwind of alluvial source areas, coarse silt from alluvial sources can be transported long distances by repeated mobilization and deposition in dunes and in interdune areas. Such a model may help to explain the multiple hypotheses put forward for the formation of the loess sequences of the Chinese Loess Plateau, with alluvium deposited by rivers draining to areas upwind of the Badain Jaran and Tenegger sand seas providing both coarse silt- and sand-sized material. The sand is incorporated in the dunes, releasing coarse silt by abrasion; while the silt is episodically transported downwind, especially during periods of dune activity.
A conceptual model for the production, transport, and deposition of desert loess deposits, based in part on Muhs et al. (Reference Muhs, Bettis, Aleinikoff, McGeehin, Beann, Skipp, Marshall, Roberts, Johnson and Benton2008).

CONCLUSIONS AND FUTURE RESEARCH NEEDS
Very significant gaps in our knowledge of the processes involved in the formation of coarse silt loess sequences in arid and semiarid regions are evident from a review of the literature. Field studies of loess sequences and their provenance have provided many insights, the most significant of which is the geographic proximity of areas of loess deposits and dunes. Improvements in the characterization of the particle size, mineralogy, and geochemistry of the loess sequences and potential source areas have constrained sources and sinks of coarse silt, especially when combined with back-trajectory analysis of transporting winds, but these multidisciplinary approaches need to be applied more widely. Although the processes involved in the production of coarse silt are still debated, field and laboratory evidence points to the effectiveness of chipping and spalling of sand grains during intense transport events in sand dune areas as a source of coarse silt particles. In addition to further natural experiments of coarse silt generation from dunes and other source areas, properly scaled laboratory experiments and modeling of particle collisions are needed to isolate the effects of energy transfer and grain shape on abrasion for a range of mineral compositions. These should be combined with simulation of shape reduction (Durian et al., Reference Durian, Bideaud, Duringer, Schröder and Marques2007; Krapivsky and Redner, Reference Krapivsky and Redner2007), coupled with modeling of the kinematics of grain-to-grain collisions (Werner and Haff, Reference Werner and Haff1988). Such an approach would complement field studies and provide a rigorous framework for understanding the generation of silt-sized and finer particles in arid regions.
ACKNOWLEDGMENTS
I thank Dan Muhs for inspiring this review and providing images of loess deposits and Dan Muhs and Yehouda Enzel for their valuable comments on a draft of this article.