I. INTRODUCTION
Wearing is one of the main failure modes of metal materials. The rapid consumption of wear-resistant materials will lead to a great waste of energy and resource. Reference Andersson, Finnstrom and Nylén1 Wide use of alloy elements and gradually increased alloying degree of materials are the developing tendencies of metal wear-resistant materials in the manufacturing industry. At present, high chromium white cast iron and boron-added high chromium white cast iron are acknowledged as wear-resistant materials with high performance. Reference Spuzic, Strafford, Subramanian and Savage2–Reference Wu and Wang4 China is a boron-rich country. In recent years, there are more and more researches on various alloys with boron addition. Reference Lv, Fu, Xing and Ma5–Reference Liu, Cheng, Long, Wei and Zhang11 As a new-type alloying element, boron can improve the microstructures and properties of materials, such as reducing the cell size, producing finer hard phases, decreasing the cost of production, simplifying the production process, as well as obtaining excellent properties like hardenability, tensile strength, bending strength and wear-resistance. Reference Astini, Prasetyo and Baek7,Reference Gu, Zhang, Fu and Lei12 However, generally, Fe–B–C alloy has awful toughness due to its brittle and continuous net-like distributed Fe2B borides.
For the purpose of improving the brittleness of borides, various alloying elements such as chromium, molybdenum, vanadium, tungsten, cobalt, and niobium are added. Reference Christodoulou and Calos13–Reference Ma, Xing, Fu, Gao and Zhang15 Fu Reference Fu10 studied the solidification microstructures and mechanical properties of 1.5 wt%–2.0 wt% B and 0.4 wt%–0.77 wt% C alloys, which indicated that the as-cast Fe–B–C alloy consisted of ferrite, pearlite, martensite and Fe2B with high hardness. After normalizing treatment, the microstructure became martensite and Fe2B, resulting in the increase of hardness to 60 HRC. Ma et al. Reference Fu16 investigated the microstructures and heat treatment properties of Fe–B–C steel with chromium, molybdenum and nickel addition and revealed that borides would have various shapes due to the segregation of different alloy elements inside and secondary precipitates appeared during destabilization process. Gu et al. Reference Liu, Cheng, Long, Wei and Zhang11 evaluated the microstructure and macrohardness of Fe–B–C steel and the results showed that alloy with 1.5 wt% B added had the best comprehensive performance.
By now, chromium had been deeply investigated by many researchers and they all found that chromium addition in Fe–B–C alloy could change the morphology of borides and obviously improve their fracture toughness. Reference Guo and Kelly17–Reference Wang, Guo and Kelly20 Jian Reference Jian, Huang, Xing, Zheng, Sun, Liu and Liu21,Reference Jian, Huang, Xing, Guo, Wang and Lv22 emphatically studied the two-body wear behavior of Fe–3.0 wt% B alloys with various chromium or manganese concentrations and indicated that wear rate dropped with the addition of above-mentioned elements which presented the opposite trend to the fracture toughness of borides. As a kind of common alloying element, molybdenum could also be added to Fe–B–C steel, so that the fracture toughness and heat treatment properties of alloy were improved. Reference Asahi23 Though chromium, molybdenum and other elements were necessary in Fe–B–C alloy, Reference Li, Hou, Qu and Fu24,Reference Liu, Li, Li, He, Gao and Nieh25 boron was the most important factor to influence the properties of alloy. It is significant to explore the suitable combination of boron and other elements. This work investigated the effect of various boron concentrations on microstructures and properties of Fe–x wt% B–0.4 wt% C–6.0 wt% Cr–4.0 wt% Mo–1.0 wt% Al–1.0 wt% Si–1.0 wt% V–0.5 wt% Mn alloy (x = 1.0, 2.0, 3.0).
II. EXPERIMENTAL PROCEDURE
A. Materials and specimens
Pig iron, scrap, aluminum, ferroboron, ferrovanadium, ferrosilicon, ferromanganese, ferromolybdenum and ferrochrome were smelted in 10 kg vacuum induction furnace under the vacuum degree of 10−4 torr. Then, the melt was discharged into preheated metal mold at 1500 °C. Ceramic foam filter screen was used to keep the melt clean during pouring. The cooling rate of melt in metal mold during solidification was approximately 240 °C/min. Bottom part near the center of the casting was cut into 15 × 15 × 15 mm cubes as samples for microstructure analysis and φ5.8 × 15 mm cylinders as pin samples for two-body abrasive wear test.
B. Characterization
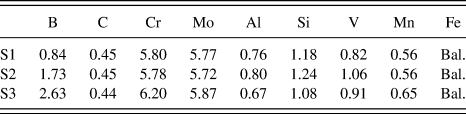
Atomic spectrometry analysis was used to obtain the compositions of the samples. The chemical compositions of studied alloys are shown in Table I. S1, S2, and S3 refer to alloys with boron content of 1.0, 2.0, and 3.0 wt%. The optical microscopy (LEICA DMI5000M, Leica Microsystems, Wetzlar, Germany), electron microscopy (Tescan VEGA II XMU, TESCAN, Brno, Czech Republic), electron probe microanalyzer (JXA-8100 JEOL Ltd., Tokyo, Japan), and transmission electron microscopy (JEM-2100, JEOL USA Inc., Peabody, Massachusetts) were used to characterize the microstructure and phase composition. Differential scanning calorimetry (NETZSCH STA 449C, NETZSCH-Gerätebau GmbH, Selb, Germany) was used to confirm the solidification process of the studied alloys through detecting the solidus temperature with a cooling rate of 10 °C/min from 1400 to 500 °C. The macrohardness was measured by HR-105A Rockwell hardness tester (Guangdong Great Changan Test Co., Ltd., Dongguan, China), and MX 1000 type Vickers hardness tester (Dongguan Hansheng Precision machinery Co., Ltd., Dongguan, China) was used to measure the microhardness of different phases in each of the studied alloys. Phase volume fractions were calculated by image analyzing software ImageJ using the samples etched by No. 1 Carlin corrosive. All of the specimens were polished and etched using 5% nital.
Chemical compositions of the alloys (wt%).

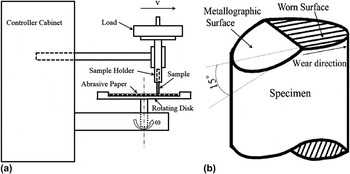
The microstructure and two-body abrasive wear behavior of heat-treated samples were also studied. Samples were austenized at 1050 °C for 2 h and quenched by water, 15 W–40 engine oil, and air. The rate of water cooling, oil cooling, and air cooling is 40 °C/s, 15 °C/s, and 6 °C/s, respectively. After quenching treatment, samples were tempered once followed by furnace cooling. The tempering temperature is 500 °C and the soaking time is 1 h. Figure 1(a) shows the schematic diagram of ML-100 pin-on-disk abrasion tester (Jinan Yihua Tribology Testing Technology Co. Ltd., Jinan, China) which was used to investigate the two-body wear behavior of the alloys. A 240 mesh SiC abrasive paper was fixed on the disk with a rotation rate of 60 r/min, where samples slid on from the center of the disk along radical direction at 4 mm/r under contact loads of 15 and 35 N. Before tests, samples were worn down under the load of 10 N. Weight loss of samples measured on electronic balance with the accuracy of 0.1 mg was defined as the average value of three experimental results under the same load. Worn surfaces were observed by SEM, and VK-9700 3D laser scanning microscopy (Keyence Corporation, Osaka, Japan) was utilized to measure surface roughness. Wear mechanism of alloys was analyzed through observing worn surface and oblique section. Figure 1(b) shows the schematic diagram of oblique section. A polished metallographic surface was prepared as a 15° angle with worn surface, so that worn surface and subsurface could be observed simultaneously.
Schematic diagram of: (a) two-body abrasive wear tester; (b) wear test sample with oblique section.

III. RESULTS AND DISCUSSION
A. Effect of boron content on solidification microstructure of Fe–B–C alloy steel
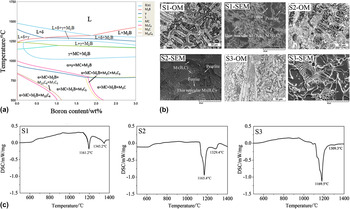
Figure 2(a) shows the Fe–B pseudo-binary phase diagram calculated by Thermal-calc. Reference Yang, Fu, Lei, Wang, Zhu and Jang14 Compared with Fe–B binary alloy, the studied alloy has more complicated phase regions, higher eutectic temperature and lower eutectic point due to boron content. M refers to Fe, Cr, Mo, V, and Mn because Fe atoms in various borocarbides will be substituted by other metal atoms during solidification. According to the diagram and Ref. Reference Ma, Xing, Fu, Gao and Zhang15, it can be proved that the main borocarbides in studied alloys should be M2(B,C).
Fe–B pseudo-binary phase diagram (a); OM and SEM morphologies of S1, S2, and S3 (b); differential scanning calorimetry cooling curves of S1, S2, and S3 (c).

The as-cast microstructures of S1, S2, and S3 are shown in Fig. 2(b). It can be observed that alloys S1, S2, and S3 consist of dendritic metal matrix (pearlite included) and eutectic borocarbides which distribute as a continuous network. Morphology of pearlite is irregular due to various compositions of M3C [SEM images in Fig. 2(b)]. Borocarbides M2(B,C) have four types of typical morphologies, i.e., cluster-like, fish bone-like, bulk-like and thin reticular borocarbides. Comparing the morphologies of borocarbides in alloys with different boron contents, it can be observed that with the increase of boron addition, fish bone-like and bulk-like M2(B,C) appear and their amount rises, because of the different size of eutectic molten pool in alloys with various boron contents. When boron content in alloy is hypoeutectic, boron will be discharged into residual liquid phase during the precipitation of primary austenite because solute distribution coefficient of boron in liquid steel is below 1. Then, eutectic reaction starts when boron content in residual liquid phase increases until eutectic composition. In sample S1, till eutectic reaction starts, the molten pool has become quite narrow leading to the corresponding finer network structure of borocarbides. When boron content rises, the molten pool is wider, so larger borocarbides and fish bone-like borocarbides form. Reference Guo and Kelly17 In sample S3, boron content is close to eutectic point. Thus, eutectic borocarbides are larger and more compact.
The solidification processes of S1, S2, and S3 are similar to Fe–B binary alloy. Reference Gu, Zhang, Fu and Lei12,Reference Ma, Xing, Fu, Gao and Zhang15,Reference Fu16 Primary phase austenite precipitates from liquid phase first. Then, eutectic reaction L → γ + M2(B,C) occurs (M = Fe, Cr, Mo, V, Mn). With the decline of temperature, pro-eutectoid ferrite precipitates at the grain boundary and the rest of austenite turns into pearlite through eutectoid reaction. From the DSC cooling curve in Fig. 2(c), samples with various boron contents have different exothermic peak temperature and intensity.
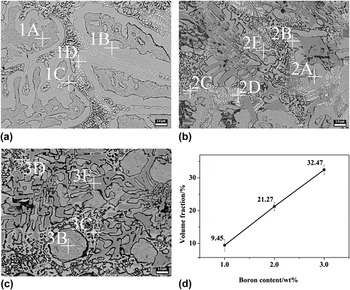
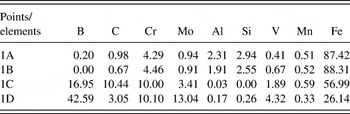
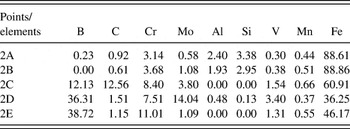
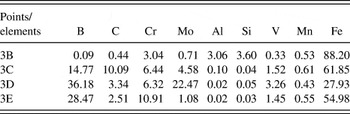
Ma et al. Reference Ma, Xing, Fu, Gao and Zhang15 suggested that the difference between the morphologies of M2(B,C) is attributed to inhomogeneous distribution of the alloying elements. Thus, the compositions of M2(B,C) with different morphologies as well as matrix were investigated by electron microprobe analyzer (EMPA) and the results are shown in Fig. 3 and Tables II–IV. From these results, phases at points xA and xB are pearlite and ferrite, and xC, xD, and xE are M2(B,C) with different compositions (x = 1, 2, 3). According to the chemical compositions of each point, Fe is the main component in each phase. B and C mainly form borocarbides. Most of Cr, Mo, and V exist in phase M2(B,C). Bulk-like M2(B,C) has the highest Cr content, while thin reticular M2(B,C) has the highest Mo content. Al and Si exist in the matrix. Mn distributes in the alloy homogeneously. From Refs. Reference Ma, Xing, Liu, Yi, Fu, Zhang and Li18 and Reference Putatunda26, solubility of Cr in M2(B,C) is higher than that in austenite, so most of Cr atoms diffuse into M2(B,C) and replace part of Fe atoms during eutectic reaction. Existence of Mo in alloy will result in the formation of Mo-rich thin reticular M2(B,C) during eutectic reaction. Reference Ma, Xing, Fu, Gao and Zhang15,Reference Guo and Kelly19,Reference Asahi23 Moreover, solubility of Mo in matrix decreases with the decline of temperature, Reference Li, Hou, Qu and Fu24,Reference Hou, Fu, Jiang, Zhou and Cen27–Reference Voort29 so Mo content in matrix is lower than that in borocarbides.
BSE morphologies of S1 (a), S2, (b) and S3 (c); calculation results of volume fraction (d).

EMPA quantitative analysis results of S1 (at.%).

EMPA quantitative analysis results of S2 (at.%).

EMPA quantitative analysis results of S3 (at.%).

For the purpose of calculating the borocarbide volume fraction, samples were etched by No. 1 Carlin corrosive which could etch metal matrix to black. Reference Voort29 Figure 3(d) shows the average volume fraction of 15 testing values. From these results, with boron content increase, volume fraction of borocarbides increases based on the approximate linear relationship, because most of the boron atoms form borocarbides during solidification due to the low solubility of boron in austenite and ferrite. Reference Fu and Hu30
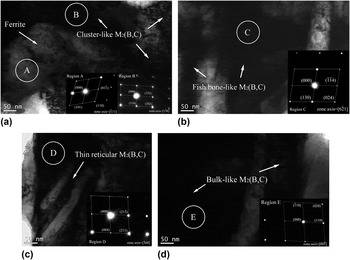
Figure 4 shows the TEM bright-field micrographs and corresponding selected area diffraction patterns (SADPs) of matrix and borocarbides in alloy S2. From the SADP results of region A, it can be seen that the ferrite matrix with various alloying elements (Cr, Mo, Al, Si, V, and Mn) dissolved still presents a typical body-centered cube (bcc) structure. The SADP results of regions B, C, D, and E reveal that bulk-like M2(B,C) has body-centered orthorhombic (bco) structure with a lattice parameter of space group Fddd, a = 1.4583 nm, b = 0.7379 nm, c = 0.4245 nm. Cluster-like, fish bone-like and thin reticular M2(B,C) have body-centered tetragonal (bct) structure. However, the lattice parameters of cluster-like M2(B,C) (space group I4/mcm, a = b = 0.5109 nm, c = 0.4249 nm, c/a = 0.83), fish bone-like M2(B,C) (space group I4/mcm, a = b = 0.5132 nm, c = 0.8532 nm, c/a = 1.66), and thin reticular M2(B,C) (space group I4/mcm, a = b = 0.5547 nm, c = 0.4739 nm, c/a = 0.85) are different from each other. This phenomenon results in the morphology difference of M2(B,C).
Bright-field TEM micrographs and corresponding SADPs of S2: (a) Matrix and cluster-like M2(B,C); (b) fish bone-like M2(B,C); (c) thin reticular M2(B,C); (d) bulk-like M2(B,C).

B. Effect of boron content on microstructures and properties of quenched Fe–B–C alloy steel
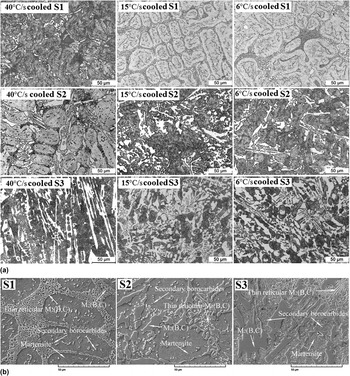
Generally, hardenability of steel is improved by Cr, Mo, and W. Reference Ma and Ma31 However, as a strong element to improve hardenability, effect of boron on hardenability improvement is dozens of times better than that of the above-mentioned metal elements. Reference Gusejnor32–Reference Hara, Asahi, Uemori and Tamehiro34 Martensite structure can be obtained in steels with a small quantity of boron addition even under air cooling condition. Reference Fu, Wu and Xing35 Figure 5 shows the structures of quenched alloys S1, S2, and S3 under different cooling rates of 40 °C/s (water cooling), 15 °C/s (oil cooling), and 6 °C/s (air cooling). It is seen that complete martensite matrix can be obtained even under air cooling and no cracks or other defects are observed in the samples. Quenching treatment has little effect on the morphology of large-size eutectic borocarbides. Besides, secondary borocarbide particles appear. The reason for the precipitation of secondary borocarbides is the solution of Cr, Al, and Mo, which results in large lattice distortion of matrix and then thermodynamic instability. For the decrease of distortional energy during heat preservation, B, C and other metal elements will precipitate in the form of borocarbide particles. Furthermore, Al weakens the bonding force of C atoms with other metal atoms which results in the increase of their activity. This phenomenon attributes to the precipitation of secondary borocarbides. Reference Yu, Fu, Du, Li and Lei36,Reference Yang, Zhao, Wang and Chen37 The SEM morphologies of quenched alloys with different boron contents are shown in Fig. 5(b). Continuous network of phase M2(B,C) is broken at a weak place especially in thin reticular M2(B,C), because of dissolving and re-precipitating of borocarbides during heat preservation. The thermodynamic driving force of this process is due to the decrease of borocarbides/matrix interface energy and diffusion of boron atoms leads to the kinetic driving force. Reference Ma, Fu, Chen and Lei38–Reference Wu, Cheng and Fu40 Besides, neither boron content nor cooling rate has effect on the phase types of secondary borocarbides.
OM morphologies of quenched S1, S2, and S3 with different cooling rates (a); SEM images of quenched S1, S2, and S3 (b).

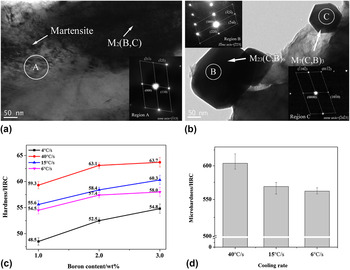
Figure 6 shows the bright-field TEM micrographs and corresponding SADPs of quenched alloys. From Fig. 6(a), the matrix of quenched alloy is lath martensite with a body-centered tetragonal (bct) structure and the lattice parameter is space group I4/mmm, a = b = 0.2846 nm, c = 0.3053 nm (c/a = 1.073). Figure 6(b) reveals that some secondary borocarbides present a spherical morphology and other shapes like hexagon. From the results of corresponding SADPs, it can be proved that secondary borocarbides are M23(C,B)6 which presents a face-centered cube (fcc) structure with a lattice of Fm3m space group, a = 1.0591 nm, and M7(C,B)3 which has the hexagonal-close-packed (hcp) structure with space group P31c, a = b = 1.3980 nm, c = 0.4523 nm. References Reference Iwashita and Wei41–Reference Jiang, Yao, Guan and Hu45 indicated that the secondary borocarbides precipitate dispersedly but not randomly. M23(C,B)6 may preferentially precipitate around the original martensite where there exists high density regions of dislocations and stacking faults resulting from lattice distortion owing to Cr, Mo, and Al dissolution. Besides, the secondary borocarbides grow by a displacive transformation mechanism in which their lattice is yielded by a deformation of supersaturated α-Fe lattice. Reference Wiengmoon, Pearce and Chairuangsri46,Reference Thomson and Miller47
Bright-field TEM micrographs and corresponding SADPs of quenched S2: (a) Matrix and M2(B,C); (b) secondary precipitated phase M23(C,B)6 and M7(C,B)3 and effect of boron content and cooling rate of quenched alloy on (c) macrohardness; (d) microhardness of martensite in S2.

Figures 6(c) and 6(d) show the effect of boron content and cooling rate (40, 15, and 6 °C/s) on macrohardness and microhardness of martensite in S2 after quenching treatment. From Fig. 6(c), when boron content changes from 1.0 to 2.0 wt%, the increasing amplitude of macrohardness is higher than that from 2.0 to 3.0 wt%. It is proved that the effect of boron content on macrohardness weakens with its rising. Moreover, with the increase of cooling rate, macrohardness rises obviously. Solubility of boron in the matrix is quite low, so it hardly has effect on microhardness of martensite. From Fig. 6(d), it is seen that water-cooled sample has the highest microhardness and the difference in the values between oil-cooled and air-cooled samples is relatively small.
C. Effect of boron content on microstructures and properties of tempered Fe–B–C alloy steel
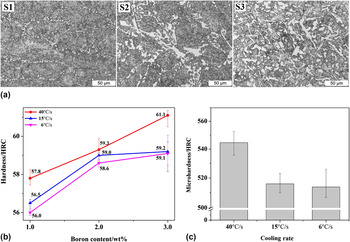
The microstructures of one-time-tempered alloys after quenching treatment with different boron content are shown in Fig. 7(a). Martensite structure of the matrix, secondary borocarbide particles and eutectic borocarbides which become finer and more dispersed compared with quenched alloys are observed. Continuous network structure of borocarbides is almost entirely broken. Figures 7(b) and 7(c) show the macrohardness of the alloys with different boron contents and cooling rates (40, 15, and 6 °C/s), and martensite microhardness of S2. It can be seen that secondary hardening phenomenon occurs in both oil-cooled and air-cooled samples. During tempering process, transformation of martensite will result in the decrease of macrohardness and precipitation of secondary borocarbide particles will increase the macrohardness. When the growth of the former is larger than the decreasing amplitude of the latter, secondary hardening phenomenon occurs. Comparing the microhardness of martensite in quenched and tempered samples, it is seen that the microhardness of water-cooled sample decreases the most and the corresponding decreasing amplitude of macrohardness is larger than the growth resulted from secondary borocarbides precipitation. Thus, after tempering treatment, the macrohardness decreases in the water-cooled sample. Besides, effect of boron content on macrohardness variation is similar to those of quenched and as-cast alloys.
Tempered OM morphologies of S1, S2, and S3 (a); effect of boron content and cooling rate of tempered alloy on (b) hardness; (c) microhardness of martensite in S2.

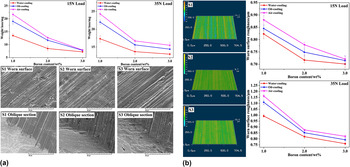
The two-body wearing test results, SEM morphologies of worn surface, and oblique sections through worn surfaces of tempered samples with different boron contents are shown in Fig. 8(a). It is observed that with the increase of boron content, the weight loss of alloys decreases and the larger the load, the higher the wear loss. Furthermore, compared with S1, wear resistance of S2 and S3 is significantly improved. Variation trend of wear loss is exactly opposite to the macrohardness results, which indicates that macrohardness is the main influencing factor of wear resistance. Worn surfaces of S1, S2, and S3 are full of ploughings. Furthermore, pits and scratches are also observed in S1. As is known to us, borocarbides act as hard phase to resist abrasive particles, protecting matrix from being damaged directly, while matrix supports borocarbides. The synergistic reaction has a positive effect on wear resistance of alloy. Reference Jian, Huang, Xing, Zheng, Sun, Liu and Liu21 According to the theory of Ref. Reference Richardson48, the ratio of hardness of abrasive SiC (HV2600) and borocarbide M2(B,C) (HV1400-1800) Reference Fu and Hu30 is below 0.8, which means that SiC can be regarded as hard abrasive. In alloy S1, only small-size borocarbides exist and are easy to be fractured by moving abrasives. Thus, pits and scratches caused by broken borocarbides appear on the worn surface of S1. When boron content increases to 2 or 3 wt%, only ploughings are observed because the size of borocarbides becomes larger and it is difficult to be broken by abrasives.
Weight loss of alloys with different boron contents and cooling rates on load 15 and 35 N, worn surfaces, and oblique section through worn surfaces under load 35 N of air-cooled alloys (a); three-dimensional morphologies of worn surfaces of air-cooled S1, S2, and S3 under load 35 N and average roughness of alloys with different boron contents and cooling rates under load 15 and 35 N (b).

By observing the oblique sections together with worn surface morphologies, the wear mechanism ofalloy S1 is micro cutting accompanied with the spalling of borocarbides and of alloy S2, S3 is single micro cutting From Ref. Reference Jian, Huang, Xing, Zheng, Sun, Liu and Liu21, borocarbides with Cr, Mo, and V addition have excellent toughness, so no cracks form on borocarbides. From the three-dimensional morphologies of worn surfaces of S1, S2, and S3 [Fig. 8(b)], it is seen that deep ploughings and pits exist in S1. The depth of ploughings declines when boron content rises and no pits or scratches are observed in S2 and S3. Moreover, variation trend of average roughness reflects the degree of wear. Reference Jian, Huang, Xing, Guo, Wang and Lv49 According to the results shown in Fig. 8(b), water-cooled alloy with higher boron content exhibits better wear resistance because of its lower roughness of worn surface.
IV. CONCLUSIONS
-
(1) The as-cast microstructure of Fe–B–C alloy steel consists of dendritic ferrite, pearlite, and eutectic borocarbide M2(B,C) which distributes as continuous network at the grain boundary of matrix. Borocarbides with various elements possess different morphologies. The volume fraction of borocarbides rise with the increase of boron content.
-
(2) After quenching treatment, secondary borocarbide particles precipitate in the alloys. Continuous network of eutectic borocarbides is broken. When boron content or cooling rate rises, the macrohardness of alloys increases significantly. Microhardness of martensite is positively correlated with cooling rate.
-
(3) After tempering treatment, the phase type of alloy is not changed compared with quenched alloy. Continuous network of eutectic borocarbides is further broken. Secondary hardening phenomenon occurs on oil-cooled and air-cooled alloys. The macrohardness and microhardness of martensite decrease slightly. The wear resistance is improved with the rise of boron content or cooling rate and the wear mechanism changes from micro cutting accompanied with the spalling of borocarbides to single micro cutting when boron content increases.
ACKNOWLEDGMENTS
This work was supported by National Natural Science Foundation of China (51475005 and 51641105), Natural Science Basic Research Plan in Shaanxi Province of China (2014JQ2-5028), Scientific Research Program Funded by Shaanxi Provincial Education Department (15JK1486), the Science and Technology Project of Guangdong Province in China (2015B090926009), the Science and Technology Project of Guangzhou City in China (201604046009), and Project Supported by the Open Research Subject of Key Laboratory of Special Materials and Manufacturing Technology in Sichuan Provincial Universities (szjj2016-089).