Introduction
Males predominate at the extremes of intellectual achievement, securing more Nobel prizes, full professorships and science citation counts (Deary et al., Reference Deary, Thorpe, Wilson, Starr and Whalley2003; Murray, Reference Murray2003). Males are over-represented in gifted education programmes (Freeman, Reference Freeman2003) and particularly excel in mathematics-based fields such as physics (Ceci & Williams, Reference Ceci and Williams2010). Most recognized geniuses are male.
An important question is why (Nyborg, Reference Nyborg and Nyborg2003; Hunt, Reference Hunt2011). The question is interesting for theoretical reasons and for informing societal efforts to decrease female under-representation at the top, particularly in mathematics and science (Ecklund et al., Reference Eklund, Lincoln and Tansey2012).
One view attributes the female under-representation only to social factors. These may include discrimination by gatekeepers in education and the workplace (the ‘glass ceiling’), greater social pressure on women to rear children, different socialization experiences, gender stereotyping (Lindberg et al., Reference Lindberg, Hyde, Linn and Petersen2010) and too few female role models (Wilgosh, Reference Wilgosh2001). Penner (Reference Penner2008) links female under-representation in mathematics and science in different nations to gender inequality in each nation's labour market. Another view holds that some innate gender differences partly are responsible (Geary, Reference Geary1998). The argument goes that natural selection pressures are somewhat different on the sexes and females traditionally invest more time in child-rearing, resulting in differences in some cognitive abilities (Lynn, Reference Lynn1999; Benbow et al., Reference Benbow, Lubinski, Shea and Eftekhari-Sanjani2000; Lynn & Irwing, Reference Lynn and Irwing2004), personality traits such as competitiveness (Kanazawa, Reference Kanazawa2003) and interests. Differences may be only at the extremes and/or gender means may differ. Indeed, evidence suggests that males are more variable in various traits. Deary et al. (Reference Deary, Thorpe, Wilson, Starr and Whalley2003), with IQ scores of Scottish children born in 1921, found more males at both IQ extremes. Males score higher on average in visuospatial ability and particularly excel at mental rotation (Halpern et al., Reference Halpern, Benbow, Geary, Gur, Hyde and Gernsbacher2007). Ceci et al. (Reference Ceci, Williams and Barnett2009) say that women prefer careers unrelated to mathematics and are more likely to drop out of mathematics-based careers. Of course, both social and innate factors may impact.
Chess as a model real-world domain for investigating the issue
Chess-playing is an intellectual activity par excellence and was dubbed a ‘drosophila’ for cognitive psychology (Simon & Chase, Reference Simon and Chase1973). Skill may rest partly on IQ and visuospatial ability (Horgan & Morgan, Reference Horgan and Morgan1990; Frydman & Lynn, Reference Frydman and Lynn1992) and on creativity and extensive domain-specific knowledge. Women are greatly under-represented at top-level chess. There never has been a female world champion and females constituted only about 1.9% of grandmasters in January 2012. Understanding why is interesting in its own right and may help illuminate why males predominate in other intellectual domains. Organized chess has some special characteristics that allow controls over various extraneous factors. There is an objective performance measure (a numerical rating described below), extensive longitudinal population performance data and virtually no glass ceiling. Most chess tournaments are open to all and any player can rise quickly.
Studies of gender differences in chess skill
Howard (Reference Howard2005) examined performance of international chess players from 1975 to 2004. The male advantage in the top 10, 50 and 100 players of each sex was large and remained roughly constant over nearly three decades. The male distribution of performance ratings in the January 2004 international rating list was more variable than the female distribution. Howard also examined career patterns of players entering the domain from July 1985 to July 1989. Women in this group on average played many fewer rated games (a median 67.5 games with the male median being 104 games) and were more likely to drop out. The 100 top-rated females played a median 302.5 games and the 100 top-rated males played a median 936.5 games.
Anecdotally, a key to success in any domain is persistence and perhaps the latter male predominance was due to greater persistence, to playing many more games. Extensive practice can improve cognitive skills greatly and comparing highly-practised and less-practised individuals (e.g. the top 100 males and females above) may mislead. Indeed, subsequent research by Howard (Reference Howard2009, Reference Howard2012) showed that the number of rated games played is a crucial factor in developing chess skill. Practice other than playing games had little apparent impact. Players on average improve continually from domain entry, reaching a performance asymptote after around 750 rated games, which may take a decade or longer. It took a median 390 rated games to become a grandmaster and most players played far fewer than 390 games. Most who persisted to 900 games became grandmasters.
Furthermore, Baltes (Reference Baltes1998) stressed the importance of studying individual differences at participants' performance limits. These limits are asymptotic performance levels, levels beyond which no additional practice may propel them. Indeed, Galton (Reference Galton1979, originally published 1869) argued that individuals have differing, fixed asymptotic performance limits for various skills. Training can improve skill level only to a certain level, and then level of ‘maximum performance becomes a rigidly determinant quantity’; there is an immutable limit on performance ‘where he cannot by any education or exertion overpass’ (Galton, Reference Galton1979, p. 15).
Not studying individual differences at such performance limits may mislead. For example, say one is studying the effects of IQ on chess performance. One pits an average club player (IQ score=90) who had played 750 rated games against Garry Kasparov (IQ score of 135 on one test according to Der Spiegel, 1987, and expanded on later), widely considered one of the greatest-ever players. The comparison would be sound if both players were studied at their performance limits, say after 750 games, or at least were equated on number of rated games. It would be unsound if Kasparov played the experienced club player immediately after learning the chess moves. Kasparov doubtless would lose quickly because chess skill takes years to develop. One might erroneously conclude that IQ was irrelevant or even detrimental to developing chess skill.
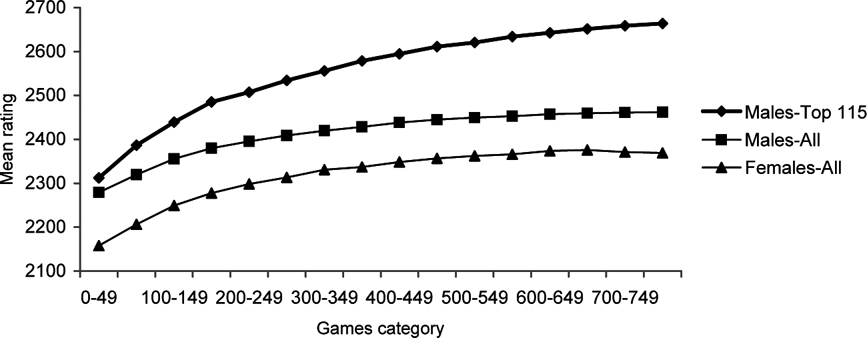
Not controlling for differences in games counts and/or not testing players at performance limits may mislead about gender differences. Howard's (Reference Howard2005) study and other studies described below need interpretation in this light. To illustrate further this key point, consider Fig. 1 of the present study and the mean rating for all males at 50–99 games. Conclusions about gender differences might vary according to how well-practised the comparison females are. The mean female rating at 0–49 games numerically is lower than the male mean at 50–99 games, at 350–399 games it is about the same and at 650–699 games it is higher.
Mean ratings in each game category for players who had played over 750 games.

Chabris & Glickman (2006) examined United States Chess Federation (USCF) rating data spanning 13 years. They reported that male players on average had higher ratings, entered the domain rated higher and had lower dropout rates, but that the male rating distribution was not more variable. They concluded that the male predominance was due to greater numbers of males entering at the lower levels. They tried to control statistically for number of rated games in some component studies but did not examine players only at performance limits. They also did not study only highly skilled players, and gender differences are greatest at the top of the distribution.
Bilalic et al. (Reference Bilalic, Smallbone, McLeod and Gobet2009) examined the April 2007 German Chess Federation rating list, which rated 113,386 males and 7013 (about 5.82%) females. Males predominated at the top but the researchers argued that this mainly was because the greater percentage of males meant a greater likelihood of some having extreme scores. This notion that males predominate because many more play chess is the ‘participation rate hypothesis’. The implication was that the difference at the top would disappear if the percentage of females had been 50%. They did consider that females on average might have less innate talent for chess and may be less inclined to participate and persist due to less success (see Gardner, 1995). They countered that there is little evidence of greater dropout rates for females but such evidence does exist (Howard, Reference Howard2005; Chabris & Glickman, 2006). Furthermore, Knapp (Reference Knapp2010) argued that Bilalic et al.'s statistical approach was inappropriate. His analysis with another statistical approach suggested that differing participation rates explained only two-thirds of the male predominance.
The Bilalic et al. study had other problems. There was no evident control for number of rated games and males may have played more on average, as in the international domain. They also evidently assumed that male and female chess players are drawn randomly from, or from equivalent parts of, each gender chess talent distribution. But the few women who play chess may have come from a quite different section of the female distribution than males do from the male distribution. For instance, females mostly might come from their top and males from their middle. Widening the percentage of females from 5.82% to say 25.82% might actually increase the gender rating gap if the additional females had less talent than the 5.82%.
Finally, Maass et al. (Reference Maass, D'Ettole and Cadinu2008) argued that the female under-representation at the top in chess mainly is due to ‘stereotype threat’. Females perform worse against males because of gender stereotypes that males are more skilled. In an experiment in which participants played online games against unseen opponents, females were more likely to lose when told they were playing a male. But the players evidently were not very skilled and the games were brief (15 minutes a side). Rated tournament games normally last several hours. Whether stereotype threat is a significant factor at the top in chess is unclear. Female grandmasters can easily defeat almost all male players.
Aims of the present study
Previous studies have not adequately controlled for the factor that Howard (Reference Howard2009, Reference Howard2012) found to be crucial: number of rated games. Chabris and Glickman did try to control for it statistically in some component studies but purely statistical methods still may confound key variables (see Howard, Reference Howard2013). It is far better to examine players at their performance limits, or at least to follow their development over equivalent numbers of rated games. Perhaps the apparent male predominance is just an artefact of greater male persistence. Would it still occur with top players at their performance limits, at 750 rated games?
Answering this question would allow a test of the hypothesis that sex differences in chess performance are caused mainly by social factors. Gender differences in interest, opportunity and persistence can be controlled for by examining players at performance limits. Anyone who plays 750 rated games must have a strong interest in chess and males and females who play that many games probably differ little in interest for the game. Some researchers on gender differences implicitly assume that if these factors disappeared in science and mathematics the male preponderance at the top would disappear. Whether this is so in chess was tested here.
The present Studies 1 and 3 examined whether the male predominance still occurs with players at their performance limits. Study 2 compared indirect signs of natural talent in male and female grandmasters. Studies 4 and 5 tested the participation rate hypothesis.
International Chess Federation (FIDE) rating data
The FIDE rates players' skill on a scale from 1200 to about 3000. A rating may change after each game according to result and the opponent's rating and it thus gauges skill at a given time. For example, if a player rated 2300 beats one rated 2400, her rating rises some points while her opponent's rating falls some points. Defeating a much higher rated player adds more points, up to a maximum of 25 points per game. Defeating a much lower rated player adds relatively few points. A series of wins against higher rated players will increase a player's rating progressively while losses to lower rated players will decrease it. A rating is considered reliable after 25 initial games (Elo, Reference Elo1986).
The first FIDE rating list appeared in 1970. The FIDE initially issued one list a year, then two (in January and July), in 2000 issued three, until 2009 issued four, and until 2012 issued six. The rating lists include all players active in international tournaments who achieve and stay at a minimum performance level. Players in rated tournaments who lack an initial FIDE rating enter the list if they achieve and do not drop below that specified minimum performance level.
Numbers of games played in a rating period are tallied only from July 1985. Rules to get on and stay on the rating list have changed. Females once needed a minimum rating of 2000. Males once needed a minimum 2200, but FIDE dropped the minimum periodically from 1993 and it now is a very modest 1200. The ratings in a given list are approximately normally distributed. The mean rating in January 2012 was 1956.66 (SD=239.05, N=138,995, with 11,834 females). Howard (Reference Howard2006) placed FIDE data into the database used here. Elo (Reference Elo1986) and Howard (Reference Howard2006) give more detail about ratings.
Study 1: Gender differences at performance limits
Do males still predominate when players are equated on number of rated games and are studied at performance limits?
Method
Participants
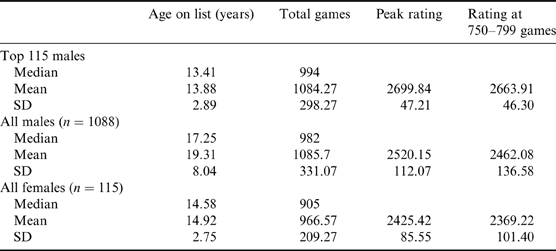
These were taken from the population of all 139,399 players (11,791 of these female, about 8.46%) who entered the international domain from July 1985 (when FIDE first reports games counts) to January 2012. The Study 1 sample consisted only of those who had played at least 750 FIDE-rated games by January 2012. Data only up to and including those in the January 2012 list were used. There were 115 females and 1088 males. Data for the top 115 males of the 1088 were also examined separately, i.e. those males with the 115 highest ratings at the 750–799 games category. Table 1 presents some career and demographic data.
Data for Study 1 participants
Procedure
The FIDE lists do not give ratings after each game played, only after the total played in the previous rating period. This total could vary from zero to over 100. Therefore, it is not possible to get a precise rating after, say, 50 or 100 games. So, for each player, game totals from July 1985 to their latest list were divided into 50 game categories (starting with 0–49 games, and then 50–99, etc.) and the final rating of each player in each 50-game category was determined. For instance, say a player had the following data in successive lists: 2321 rating and 123 cumulative games and 2360 rating and 149 games. Only the value of 2360 was used for the 100–149 games category.
About 2.63% of values in game categories were missing due to some players being very active. Missing values were estimated by taking the mean of values in a player's adjacent categories. Two players had no value for 0–49 games (they played over 50 games initially) and were assigned their value for the 50–99 games category. Mean ratings for males and females in each game category were calculated up to the 750–799 games category. Relatively few played many more than 800 games.
Results and discussion
Table 1 shows that on average the females entered the domain younger than the mean of all 1088 males (F (1,1202)=33.8, p<0.001) but about a year older than the mean of the top 115 males (F (1,228)=7.74, p<0.01). The females played slightly fewer rated games by January 2012 (F (1,1202)=14.28, p<0.001) and had a lower peak rating (F (1,1202)=77.39, p<0.001).
Figure 1 presents mean ratings in each games category. It suggests that, on average, males and females reached an asymptotic rating after around 750 games. To test this, separate ANOVAs for males and females compared ratings in the 700–749 and 750–799 games categories. There was no significant difference for all males (F (1,1087)=2.36, power=0.34) or for females (F (1,114)=0.51, power=0.11).
Figure 1 suggests that the average male rating is higher in all games categories. An ANOVA with the variables of sex and games category (repeated measures for the latter) showed a significant effect of gender (F (1,1201)=94.56, p<0.001) and with Greenhouse–Geisser correction a significant effect of game category (F (2.43,2916.7)= 542.26, p<0.001) and a significant interaction (F (2.43,2916.7)=4.36, p<0.01). The figure suggests the interaction is a greater gender difference at 0–49 games than at subsequent points. The gender difference is significant at 750–799 games (F (1,1201)=50.22, p<0.001).
Comparing the top 115 males with all 115 females gives a somewhat similar picture. The effect of gender is significant (F (1,228)=752.17, p<0.001) and with Greenhouse–Geisser correction so are the effects of games category (F (3.68,838.43)=845.19, p<0.001) and the interaction (F (3.68,838.43)=48.36, p<0.001). Figure 1 suggests that the interaction is a relatively small initial difference that gets progressively larger.
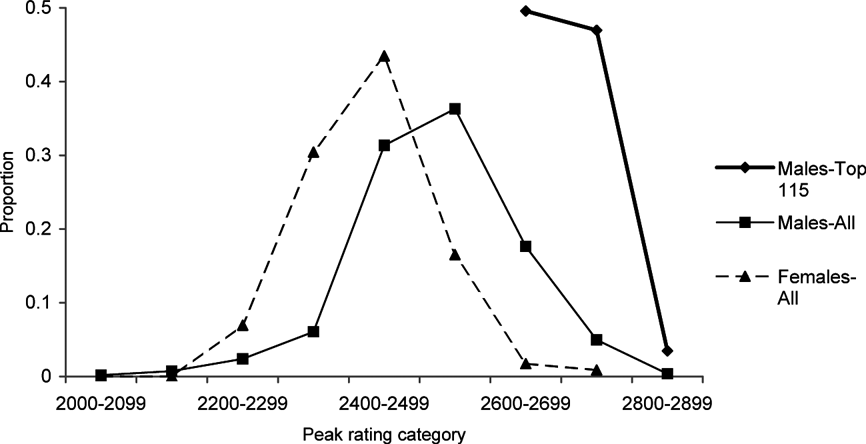
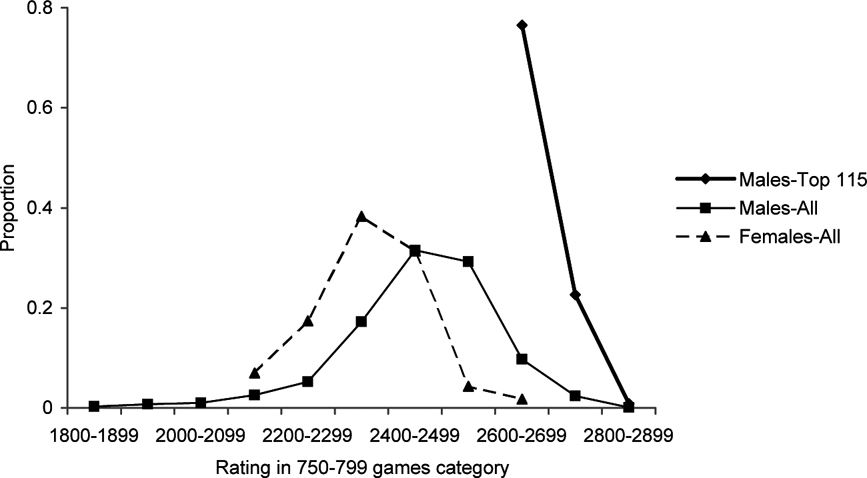
Figures 2 and 3 present the male and female distributions of peak rating and rating in the 750–799 games category, respectively, expressed as a percentage of the total for each group. Table 1 shows that these distributions for all males numerically are more variable. The peak rating distributions for the top 115 males and all 115 females do not overlap at all, except for one female. Her peak rating is 2735 and she is the only female ever to reach the top ten. The next highest peak female rating is 2635; 154 males had a peak rating above that. Figure 3 shows similar patterns for ratings at 750–799 games.
Distributions of peak ratings for all players who had played over 750 games.
Distributions of ratings in the 750–799 games category.
The male preponderance at the top still occurs when numbers of games are equated. Females constitute 9.56% of the players who played over 750 games and if they were drawn from the same population as males natural talent-wise, many more should be in the top 115 players.
Study 2: Female grandmasters
Howard (Reference Howard2009) analysed data of players acquiring the grandmaster title from 1985 to 2006. Those grandmasters eventually making the top ten showed various signs of greater natural talent for chess according to three criteria of Howe et al. (Reference Howe, Davidson and Sloboda1998) for the existence of natural talent in a domain. On average, they showed a higher peak rating, greater precocity (entering the domain and gaining the grandmaster title younger) and greater learning speed (gaining the grandmaster title faster and with fewer rated games). These measures correlated with each other and a factor analysis found evidence for an underlying natural talent factor.
Some women who entered the domain from July 1985 had become grandmasters by January 2012. Study 2 examined whether on average, according to these three criteria, these women had more or less apparent natural talent for chess than the males who became grandmasters.
Method
Participants
These were all 958 players who entered the domain from July 1985 and who had secured the grandmaster title by January 2012. Not all had played 750 games.
Procedure
Age of entering the domain, age at gaining the grandmaster title, games to title and peak rating were calculated for all players, as in Howard (Reference Howard2009).
Results and discussion
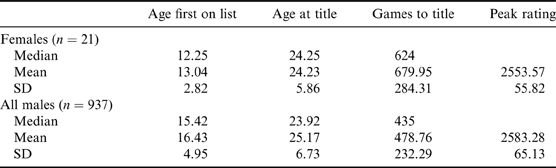
Table 2 presents summary data. Of the 958 players, only 21 were female. Females constitute about 8.46% of the 139,399 players entering the domain from 1985 but only 2.2% of grandmasters.
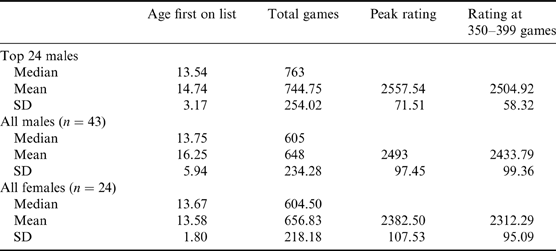
Data for Study 2 grandmasters
The 21 female grandmasters entered the domain younger on average than the mean of all males (F (1,956)=9.75, p<0.01) and gained the grandmaster title at about the same age (F (1,956)=0.52, power=0.1) but took more rated games to gain the title (F (1,956)=15.25, p<0.001) and had a lower peak rating (F (1,956)=4.3, p<0.05).
The data do not show precocity but perhaps only because of the lower minimum rating requirements for females. The data do show other signs of greater natural talent in the males on average: a faster learning rate and higher peak rating, even compared with this select group of women.
Study 3: Matched pairs
Using USCF data from 1992 to 2004, Chabris & Glickman (2006) performed a matched pairs study, partly concerned with effects of reaching adolescence. Each of their 647 pairs had a young male and a young female matched as closely as possible on rating at the end of 1995, age, number of rated games played in 1995, and number played in 1992–94. These pairs were tracked over 10 years and showed no significant mean rating difference. Male and female attrition rates were similar in matched pairs, but not in the overall USCF population. They concluded that matched males and females were equally likely to drop out and to improve skill at the same rate.
The finding is intriguing and several papers cite this study as showing similar gender dropout rates and similar expertise development patterns if males and females are matched from the start. But it is open to various interpretations. Males on average start at a higher rating level and removing such males from possible pairings would result in a less-selected male sample. It also is uncertain how many rated games these players actually played. Furthermore, participants evidently entered the domain in 1992 but were matched on ratings in 1995. Chabris and Glickman say that the results were similar with different starting years but it is unclear if 1992 was used, and they do not give the actual data. It would seem preferable to match on initial ratings and to follow pairs over equal numbers of games.
Study 3 partially replicated their study with some improvements. Players were matched by initial rating in the 0–49 games category and were followed to 750 games. Rating differences were compared in each game category. Players were not matched on age, however.
Method
Participants
These were, from the Study 1 participants, the 115 females matched to 115 males, as described below.
Procedure
All players were ranked by rating in the 0–49 games category. Each female was then matched as closely as possible to a male by rating in the 0–49 games category. Often the ratings were identical or differed only by a few points in either direction. If more than one potential male was rated identically to a given female, then the closest male rating in the 50–99 games category was used to make the pairing.
Ratings were determined for each games category to 750–799 games and the rating difference in each pair in each category was calculated (male rating−female rating). The mean difference in each games category then was calculated.
Results and discussion
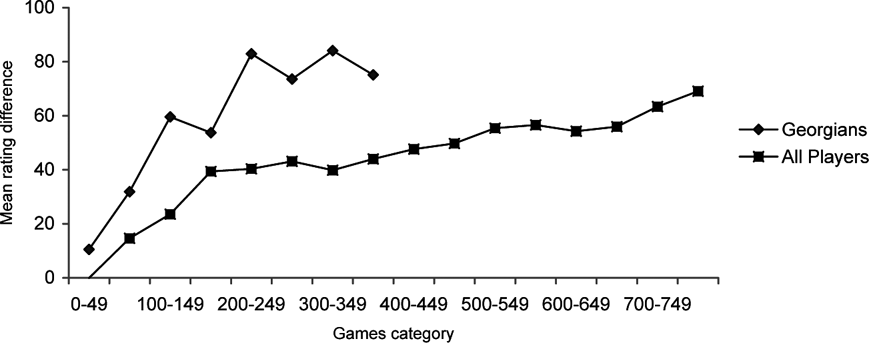
Figure 4 presents the mean difference in each games category. The figure suggests an increasing gender difference with rising numbers of games. An overall ANOVA showed a significant effect of games category with Greenhouse–Geisser correction (F (2.71,308.64)=6.97, p<0.001). The genders did not differ on rating in the 0–49 games category (F (1,228)=0.00003, power=0.05) but males had a higher rating at the 350–399 (F (1,228)=9.78, p<0.05) and 750–799 games categories (F (1,228)=15.64, p<0.001).
Mean ratings differences between males and females in each matched pair for Georgians and all players who had played 750 games.
The results differ from Chabris and Glickman's. The participants here probably were much more skilled and were taken to performance limits. There were no dropouts. In the data reported, Chabris and Glickman matched ratings after 3 years and did not take players to their performance limits. If players here had been matched on rating only after, say, 3 years, the males probably would have had an initial lower rating in the 0–49 games category and might have just caught up after 3 years. Study 3 results suggest that matched males and females have different chess skill development patterns.
Study 4: Nations with differing percentages of females
Chabris and Glickman (2006) compared gender rating differences in players from US postcodes with differing percentages of female players. Most of their data point postcodes had about 30% or less of players being female, but in four postcodes at least 50% of players were female. In one locale, Oakland, California, 68% of players were female. They combined data of all four locales in which at least 50% of players were female and on average the males numerically still were rated about 35 points higher, but the difference was not significant. However, sample size and statistical power were not given. They stated only that each postcode used had at least ten players.
The finding was interpreted as supporting the participation rate hypothesis. But their study has limitations. They used only each player's initial rating and there was no evident control for number of games played to get that initial rating. Furthermore, why did these four out of the thousands of US postcodes have such high female percentages? Perhaps some local organizers, coaches or family members specifically encouraged females to participate and they played many more initial games than males. It is also unclear how skilled the players were and performance differences are greatest at the top.
Study 4 partially replicated this study, but with international players and with nations instead of postcodes, with a large, more skilled sample, and with controls for number of games. If the participation rate hypothesis is correct, increasing proportions of female players in nations should decrease the gender rating difference.
No FIDE member nation has 50% or more females so the whole range could not be examined. Furthermore, nations differ greatly in player numbers and number of games each has played. So, to maximize the chance of finding an effect of different percentages of females, players in nations with differing percentages were pooled into three spaced categories. If the gender rating difference is due to smaller percentages of females, then the gender rating gap should decline as the proportion of females increases. Numbers of games were controlled for by examining participants' ratings at the 350–399 games and 750–799 games categories.
Method
Participants
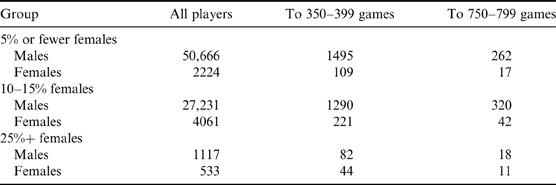
These were all players who had entered the domain from July 1985 to January 2012, who had a rating in at least one list, and whose designated country in their latest rating list fell into a category as described below. Table 3 gives sample sizes.
Sample sizes in each Study 4 group
Procedure
The FIDE lists the nation of each player in each rating list. A few listed nations are not fully independent (e.g. Guernsey and Scotland). Players move between nations and sometimes are listed in their new country. For all players entering the domain from July 1985, the nation listed in their latest available rating list was determined, which was the January 2012 list for most. Nations that no longer existed in 2012 (e.g. USSR, Yugoslavia, Czechoslovakia) were not used. Players listed only in a now-defunct nation (e.g. USSR in 1990 as latest rating list) were not included. All rating data of players in an existing nation who had appeared in rating lists under a defunct nation were used. For example, if a player listed in Belarus in 2012 entered the domain in 1986 and was listed as in the USSR from 1986–1991, then all that player's data from 1986 were used.
Percentages of female players in each of the 178 existing FIDE member nations were calculated. The 45 nations with no female international players were excluded and the rest were ranked by their percentage of females. Three groups were then constructed: nations with 25% or more females (Vietnam, Georgia, Turkmenistan, Seychelles, China, Mongolia and Guatemala), the 20 nations with between 10 and 15% females (examples are Indonesia, Albania and Mexico) and the 27 nations with no more than 5% females (examples are Spain, Argentina and Nepal). The pooled groups had an average of 32.3%, 12.98% and 4.2% females, respectively.
Peak ratings for all players in each category, regardless of numbers of games played, were calculated. Within each category, players who had played at least 350 games and those who had played at least 750 games were determined. These groups could overlap. The sample size for players playing 750 games is quite low so the 350 games group was also used. Ratings in the 350–399 and 750–799 games categories were calculated. Only players with a value at 750–799 games were used, but for the 350–399 games category players about 0.9% of values in the 350–399 games category were missing and were estimated as in Study 1.
Results and discussion
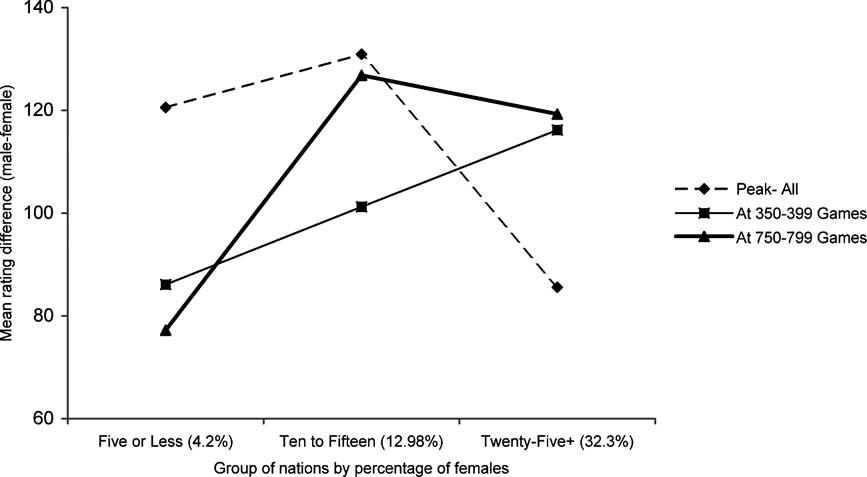
Figure 5 presents the mean rating difference (mean male rating–mean female rating) in each category for peak ratings and ratings at 350–399 games and 750–799 games. Except for the peak ratings (with no control for number of games), the figure shows no decreasing rating difference as the percentage of females rises. Indeed, data for the well-practised groups suggest the opposite trend.
Mean gender rating differences in groups of nations with differing percentages of female players.
The data were analysed with three ANOVAs. Each had two variables: group and gender. The key concern is whether the interaction between group and gender is significant. In other words, does the gender rating difference vary at different levels of the group variable? For peak ratings the effect of group was significant (F (2,85826)=221.34, p<0.001), as was that of gender (F (1,85826)=602.91, p<0.001), and the interaction was significant (F (2,85826)=6.79, p<0.01). The interaction appears to be a smaller gender difference in the 25%+ group but that gender difference still is significant (F (1,1648)=39.94, p<0.001).
For the well-practised groups, the pattern is slightly different. For the 350 games group, both group (F (2,3235)=47.26, p<0.001) and gender (F (1,3235)=74.97, p<0.001) significantly impacted but the interaction was not significant (F (2,3235)=0.53, power=0.14). For the 750 games group, group (F (2,664)=6.97, p<0.01) and gender (F (1,664)=26.69, p<0.001) impacted but the interaction was not significant (F (2,664)=0.84, power=0.19).
In other words, for the well-practised groups, the gender rating difference is the same despite quite different percentages of females. This finding does not support the participation rate hypothesis.
Study 5: Georgia
Study 5 tested the participation rate hypothesis by examining gender differences in a nation in which the percentage of female players is high and social factors such as gender stereotyping in relation to chess are weak. Studies 1, 2 and 3 were replicated with players from the Caucasus nation of Georgia. This nation has a long tradition of strongly encouraging women to play chess and has produced several women's world champions. Of the Georgian international players who entered the domain from July 1985, about 31.78% were female, compared with 8.46% females of all such international players. Vietnam has the highest national percentage of females at 38.46% of its 299 players but it is a recent entrant to international play. Georgia has extensive data over a much longer period and has more players.
If the participation rate hypothesis is correct, gender rating differences in Georgia should be much less than in the overall FIDE population.
Methods
Participants
These were all players (365 male, 170 female) with Georgia as nation in their latest rating list and who entered the domain in July 1985 and later. Only nineteen had played at least 750 games by January 2012 so players who had played at least 350 games also were used (43 males, 24 females).
Procedure
Peak ratings for all Georgians and ratings for the 350 games group in the 350–399 games category were determined. For the 350 games group, about 0.6% of values were missing and were estimated as in Study 1. The matched pairs study was replicated but matching players proved difficult. Two females had much lower initial ratings (1863 and 1978) than the lowest rated male (at 2050) and they were dropped. The next female was rated 2039 and was matched to the male rated 2050. Overall the rating difference at 0–49 games was a very small 10 points, but it was significantly higher for males (F (1,21)=22.96, p<0.001). Players were not matched on age but the absolute value of the age first on the list difference was small (median difference=2 years, mean=2.84 years, SD=4.69).
Results and discussion
The overall pattern of results is essentially the same as in Studies 1, 2 and 3, despite the greater percentage of females. Table 4 presents some career data for players who had played at least 350 games. Males on average entered the domain older (F (1,65)=4.56, p<0.05) and did not play more games on average (F (1,65)=0.02, power=0.05) but had a higher peak rating (F (1,65)=18.39, p<0.001) and a higher rating at 350–399 games (F (1,65)=23.74, p<0.001).
Data for Georgians who had played at least 350 games
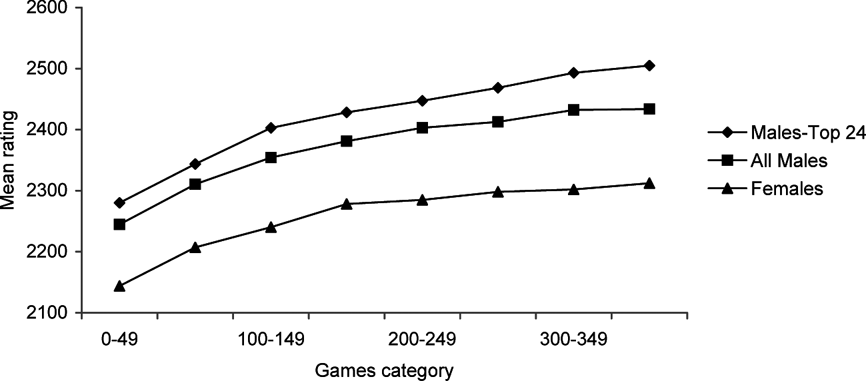
Figure 6 shows much the same pattern as in Study 1, with males starting slightly higher in the 0–49 games category. The overall ANOVA to 350–399 games showed a significant gender effect (F (1,46)=73.35, p<0.001) and with Greenhouse–Geisser correction an effect of games category (F (3.49,160.76)=118.48, p<0.001) and a significant interaction (F (3.49,160.76)=3.1, p<0.05). The interaction appears to be a widening rating difference from 0–49 games. The rating difference at 0–49 games is significant (F (1,65)=17.09, p<0.001).
Mean ratings in each game category for Georgians who had played over 350 games.
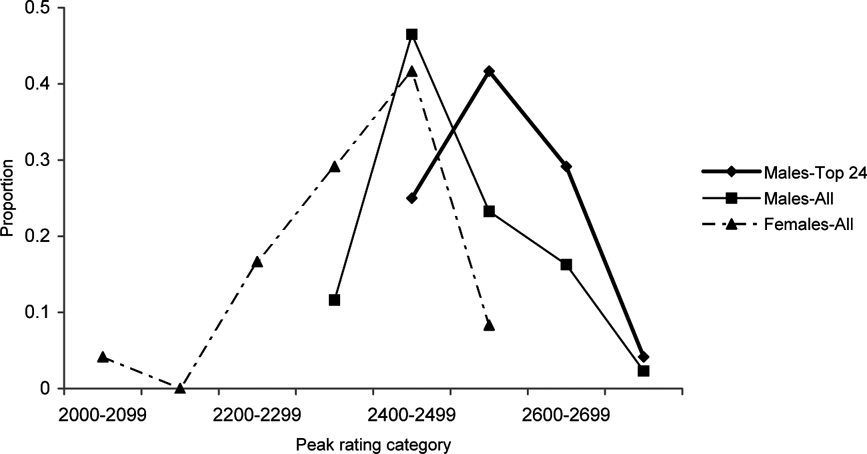
Figure 7 presents the distributions of peak ratings and shows a similar pattern as in Study 1, although with more overlap between the top 24 males and the females.
Distributions of peak ratings for all Georgians who had played 350 games.
Of all 535 Georgians, seventeen males but only one female had attained the grandmaster title by January 2012. Of the nineteen players playing 750 games or more, ten of the twelve males, but only one of the seven females, had become grandmasters by January 2012.
Figure 4 presents the matched pair data. The gender difference progressively widens from the initial 10-point difference. An ANOVA with Greenhouse–Geisser correction found a significant effect of games category on ratings differences (F (4.25,89.28)=3.65, p<0.01). The figure suggests that the rating difference is even greater for Georgians than for all players, but the difference is not significant. The overall group in Study 3 had no Georgian males but had seven Georgian females, and their seven pairs were eliminated for an ANOVA. The ANOVA comparing the matched pair gender differences from the 0–49 to 350–99 games categories for Georgians and all other pairs without the Georgians found no significant effect of group (F (1,128)=2.44, power=0.34) and with Greenhouse–Geisser correction found no significant interaction (F (3.23,412.81)=0.65, power=0.19).
As in Study 4, increasing the percentage of female players did not lessen the gender ratings differences, contrary to the participation rate hypothesis.
General Discussion
Extensive practice can greatly improve chess skill in females. But the male predominance in chess still persists at the extremes of performance and capability. The present data suggest that the male predominance is not due only to social factors, to different interest levels or dropout rates, or to males playing more games.
It does not appear to be due to greater male participation rates. Certainly proportionately fewer women persist to 750 games, but even then males predominate disproportionately. For instance, in Georgia with nineteen players playing 750 games or more, ten of twelve males, but only one of seven females, became grandmasters by January 2012. With all players persisting to 750 games, there was virtually no overlap between peak ratings in the top 115 males and all females. Increasing the percentage of female participants did not decrease the gender ratings gap. Conversely, the data actually sometimes suggest the opposite trend, although not significantly. One explanation is that females who persist in chess are mainly from the top of the female talent distribution, and increasing the percentage of females mobilizes less-talented females and thus widens the gender rating gap. The finding is only partly consistent with the results of Deaner (Reference Deaner2011), who examined sex differences in road race running speed from 1981 to 2006. Participants were not elite runners, however. More males ran relatively fast in most races but as the proportion of female runners participating increased, the difference in the proportions of relatively fast men and women decreased. However, the male advantage remained stable after 1993, with about three or four times as many men as women running relatively fast.
The present study might be criticized on several grounds. First, deliberate practice was not measured and perhaps men just study chess more. As noted, in chess skill development, deliberate practice appears to be a weak factor at best (Howard, Reference Howard2012, Reference Howard2013). It only appeared to be important in some studies because it was confounded with number of games. Aside from that, the genders often were compared here at their performance limits. How much or how little deliberate practice each needed to get there is irrelevant and there is no evidence that any more practice of any kind would propel them beyond their asymptotes. Howard (Reference Howard2009, Study 5) found that the five most active players from 1985–2007 stayed at asymptote over that entire period. None could get beyond a rating of 2600, despite whatever practice they may have undertaken.
A second criticism is that natural talent was not measured here and perhaps the female players represented the lower reaches of the talent distribution. This is possible but unlikely. If the gender talent distributions are the same, there should be more females at the top in nations such as Georgia. Furthermore, no one knows what constitutes natural talent for chess. It is likely to be a mix of IQ, specific abilities, memory and personality factors such as competitiveness. In other intellectual domains, top performers typically have IQ scores over 120 and certain personality factors (Simonton, Reference Simonton2008). An extremely high IQ score – say one over 160 – is not essential. As mentioned, in 1987, the German news magazine Der Spiegel asked some psychologists to test abilities of Garry Kasparov, then world champion. He did two tests and his highest score was 135. Studies examining links between chess skill and IQ and visuospatial ability have mixed results but typically do not control effectively for different numbers of games (Howard, Reference Howard2009). In addition, different traits may be more salient at different skill levels. One might need good visuospatial ability to get to grandmaster level, for instance, but beyond that perhaps extreme competitiveness is crucial. Players who reach the top ten may be those who take extreme efforts to win games and salvage draws from objectively lost positions. Further research should find out by comparing skilled and less skilled players at performance limits and then examining gender differences in such traits.
The present results support the evolutionary psychology view that males on average may have some innate advantages in developing and exercising chess skill. Indeed, males on average have a higher peak rating. The male distribution of peak ratings is more variable, just as for some traits such as IQ score. Social factors may impact but evidently are not the only reason for the gender differences.
What implications might the present study have for understanding the under-representation of women at the top in such domains as science and mathematics? The present chess data suggest that extensive practice can propel females far but that males may have some partly innate advantages, at least at the extremes. If an analogous study to the present Study 5 could be run in, say, mathematics, with the female participation rate increased greatly and interest and opportunity equated, the gender difference at the top might diminish but eventually might stabilize and become intractable. There is some evidence already for this possibility. Ceci & Williams (Reference Ceci and Williams2010) state that in 1960 females secured 5.9% of all US doctorates in mathematics and in 2006 secured 29.6%. However, females currently hold only 7.1% of full professorships in mathematics in top US universities. In the early 1980s, thirteen males for every one female seventh grader scored over 700 on the SAT mathematics test, while by the mid-1990s the ratio had shrunk to 4–1, where it has remained since. Speculation by analogy from the present study might suggest that, if 50% of doctorates in mathematics went to females and no social factors operated, even after decades the female proportion of full professorships still might stabilize well below 50%.
However, in other domains, males may have fewer or no innate advantages. Female under-representation at the top is less in literature, for example (Murray, Reference Murray2003). If all females were taken to performance limits in some other domains, gender differences might disappear. Furthermore, perhaps in some intellectual domains females have some innate advantages.