Nomenclature
- AI
-
artificial intelligence
- AR
-
augmented reality
- CMOS
-
complementary metal-oxide-semiconductor
- CNN
-
convolutional neural network
- DJI
-
Da-jiang innovations
- GSD
-
ground sampling distance
- GPU
-
graphics processing unit
- HAZOP
-
hazard and operability
- HD
-
high definition
- IMU
-
inertial measurement unit
- IoU
-
intersection over union
- LIDAR
-
light detection and ranging
- MATLAB
-
matrix laboratory
- mAP
-
mean average precision
- mAP50
-
mean average precision at 50% IoU
- mAP50–95
-
mean average precision averaged from 50% to 95% IoU
- MP
-
megapixel
- MRO
-
maintenance repair and overhaul
- NDT
-
non-destructive testing
- RGB
-
red, green, blue
- SLAM
-
simultaneous localisation and mapping
- UAV
-
unmanned aerial vehicles
- UGV
-
unmanned ground vehicle
- YOLO
-
you only look once
1.0 Introduction
Maintenance activities carried out on aircraft play a vital role in ensuring operational safety, preserving structural integrity and optimising the aircraft’s economic lifespan. Even the smallest defect can pose a significant risk. Therefore, it is essential to identify such defects at an early stage [Reference Šmelko, Draganová, Lipovský, Semrád, Blišt’anová and Kašper1]. In addition to routine pre-flight and post-flight checks, scheduled maintenance activities are performed on aircraft at predetermined intervals. In addition, corrective actions are implemented to diagnose and resolve faults when necessary [Reference Duvar, Böyük and Urhan2]. These processes not only enable pre-failure interventions but are also essential for sustainability, cost-efficiency and the continuity of a safety-oriented culture in the aviation industry [Reference Rodríguez, Lozano Tafur, Melo Daza, Villalba Vidales and Daza Rincón3]. The airworthiness and operational efficiency of aircraft depend on regular and meticulous maintenance processes. These activities directly impact not only the aircraft’s compliance with airworthiness standards but also the safety of passengers and crew. For this reason, maintenance and repair activities play a critical role in the implementation of safety measures in aircraft [Reference Şimşek and Uslu4, Reference Saitoğlu and Apak5]. Defects and omissions in aircraft maintenance processes account for a significant proportion of reported accidents in civil aviation, once again underscoring the critical role of maintenance in ensuring aircraft safety [Reference Çoban6]. Traditional inspection techniques used in aircraft are costly, time-consuming and susceptible to human mistake. Moreover, maintenance and repair expenses constitute a substantial portion of total aircraft operating costs. Tian et al. [Reference Tian, Lu and Lu7] emphasised that maintenance costs for civil aircraft are a critical indicator in assessing the maintainability and economic efficiency of these vehicles. Okoro et al. [Reference Okoro, Zaliskyi, Dmytriiev, Solomentsev and Sribna8] stated that aircraft maintenance activities account for approximately 20% of the total operational costs of aircraft and therefore constitute a significant portion of operating expenses. This is because approximately 90% of aircraft maintenance activities are carried out through visual inspection [Reference Aust and Pons9, Reference Aust, Mitrovic and Pons10]. When the ratios given by Okoro et al. [Reference Okoro, Zaliskyi, Dmytriiev, Solomentsev and Sribna8] and Refs [Reference Aust and Pons9, Reference Aust, Mitrovic and Pons10] are considered together, it is calculated that visual inspection activities account for approximately 18% of total operational costs. Although UAV-based inspection systems cannot replace all visual inspection activities, they can cover a significant portion of them. Considering operational constraints and current technological capabilities, it is estimated that UAVs can perform approximately 10–15% of visual inspection activities, which corresponds to approximately 1.8–2.7% of total operational costs. Maintenance activities carried out on aircraft represent one of the highest cost items for airlines after fuel consumption and therefore have a significant impact on total operating expenses [Reference Alomar and Jackiva11, Reference Alan12].
One of the primary methods used to detect defects and malfunctions during aircraft maintenance processes is non-destructive testing (NDT) techniques [Reference Uludağ13]. The use of non-destructive testing methods is crucial for preserving the structural integrity of aircraft and ensuring their functionality and operational safety [Reference Kamsu-Foguem14, Reference Avdelidis, Almond, Dobbinson, Hawtin, Ibarra-Castanedo and Maldague15]. Among these methods, visual inspection stands out for its low cost and rapid implementation [Reference Papa and Ponte16]. Visual inspection of aircraft exterior surfaces is an integral part of maintenance procedures and plays a critical role in detecting potential defects such as cracks, leaks, dents or missing components [Reference Sun and Ma17]. Pre-flight inspection procedures are typically performed by certified maintenance personnel or designated crew members prior to flight to ensure safe operation [Reference Novák, Bugaj, Sedláčková, Kandera, Stelmach and Lusiak18]. However, the high volume of flight operations in the aviation sector necessitates that maintenance processes conducted at maintenance, repair and overhaul (MRO) facilities be completed as quickly as possible, in a cost-effective manner and without compromising quality standards [Reference Pogačnik, Duhovnik and Tavčar19]. In this context, conducting visual inspections both quickly and accurately is of critical importance. However, when the areas to be inspected are located on the upper sections of the aircraft, visual checks can become time-consuming and operationally challenging [Reference Blokhinov, Gorbachev, Nikitin and Skryabin20]. Visual inspection is a non-destructive testing technique used to detect physical changes, defects and discontinuities on the surface or subsurface of components or structures. External aircraft inspection procedures are typically complex and require inspectors to possess a high level of technical expertise. This complexity increases the risk of human mistake during the inspection process and may lead to incomplete data recording or inadequate review of the performed inspections [Reference Zhang, Ma, Gu and Deng21, Reference Sun and Ma22]. This method relies on the visual perception of the inspector and is supported by auxiliary equipment such as borescopes, endoscopes and high-resolution cameras. Inspections are typically performed manually, with access to inspection areas provided using auxiliary equipment such as ladders, scaffolding, mobile platforms or lift systems. However, this approach can pose significant challenges for inspection personnel [Reference Morgenthal, Hallermann, Kersten, Taraben, Debus and Helmrich23, Reference Morgenthal and Hallermann24]. To overcome such limitations, the use of UAVs in aircraft visual inspections has emerged in recent years as an effective and promising alternative [Reference Blokhinov, Gorbachev, Nikitin and Skryabin20]. Traditional visual inspections performed by maintenance technicians or pilots during pre-flight checks can be carried out more quickly and efficiently through the use of UAV technology [Reference Bugaj, Novak, Stelmach and Lusiak25]. This type of aircraft makes it possible to remotely image the areas to be inspected [Reference Ellenberg, Branco, Krick, Bartoli and Kontsos26]. Reducing the duration of aircraft maintenance processes contributes to operational efficiency by simultaneously lowering maintenance costs [Reference Leiva, Villemot, Dangoumeau, Bauda and Larnier27]. Recent rapid developments in UAV technology are closely linked to the wide range of applications these systems offer in both military and civilian domains. Key areas of application include environmental monitoring, logistical support, reconnaissance, surveillance and search and rescue operations [Reference Santos, Bartlett, Schneider, Brádaigh, Blanck and Santos28].
Preparing the hangar where aircraft maintenance activities will be performed, along with the necessary ground equipment and control systems for the component to be tested, is a stage that requires significant time and resources in aircraft maintenance processes [Reference Tomić and Čokorilo29, Reference Azami, Mohamed and Rafaai30]. The equipment and supporting devices used to access control areas pose additional health and safety risks for maintenance personnel [Reference Ramalingam, Manuel, Elara, Vengadesh, Lakshmanan and Ilyas31]. Platforms and stands used for visual inspections in elevated areas are considered a low-cost solution; however, they are subject to significant limitations such as restricted accessibility, extended processing times and increased risks of human mistake or safety incidents [Reference Duvar, Böyük and Urhan32, Reference Bergkvist and Sabbagh33]. Automation is essential in aircraft maintenance processes to address issues related to cost and safety [Reference Doğru, Bouarfa, Arizar and Aydoğan34]. The integration of UAVs into aircraft maintenance processes is emerging as an effective solution for enhancing the occupational safety of maintenance technicians and improving the overall efficiency of maintenance activities [Reference Ruiqian, Juan and Hongfu35]. Thanks to the use of UAV technology in aviation, large surface areas can be inspected rapidly, enabling maintenance processes to be performed more efficiently in terms of both time and cost [Reference Avdelidis, Tsourdos, Lafiosca, Plaster, Plaster and Droznika36].
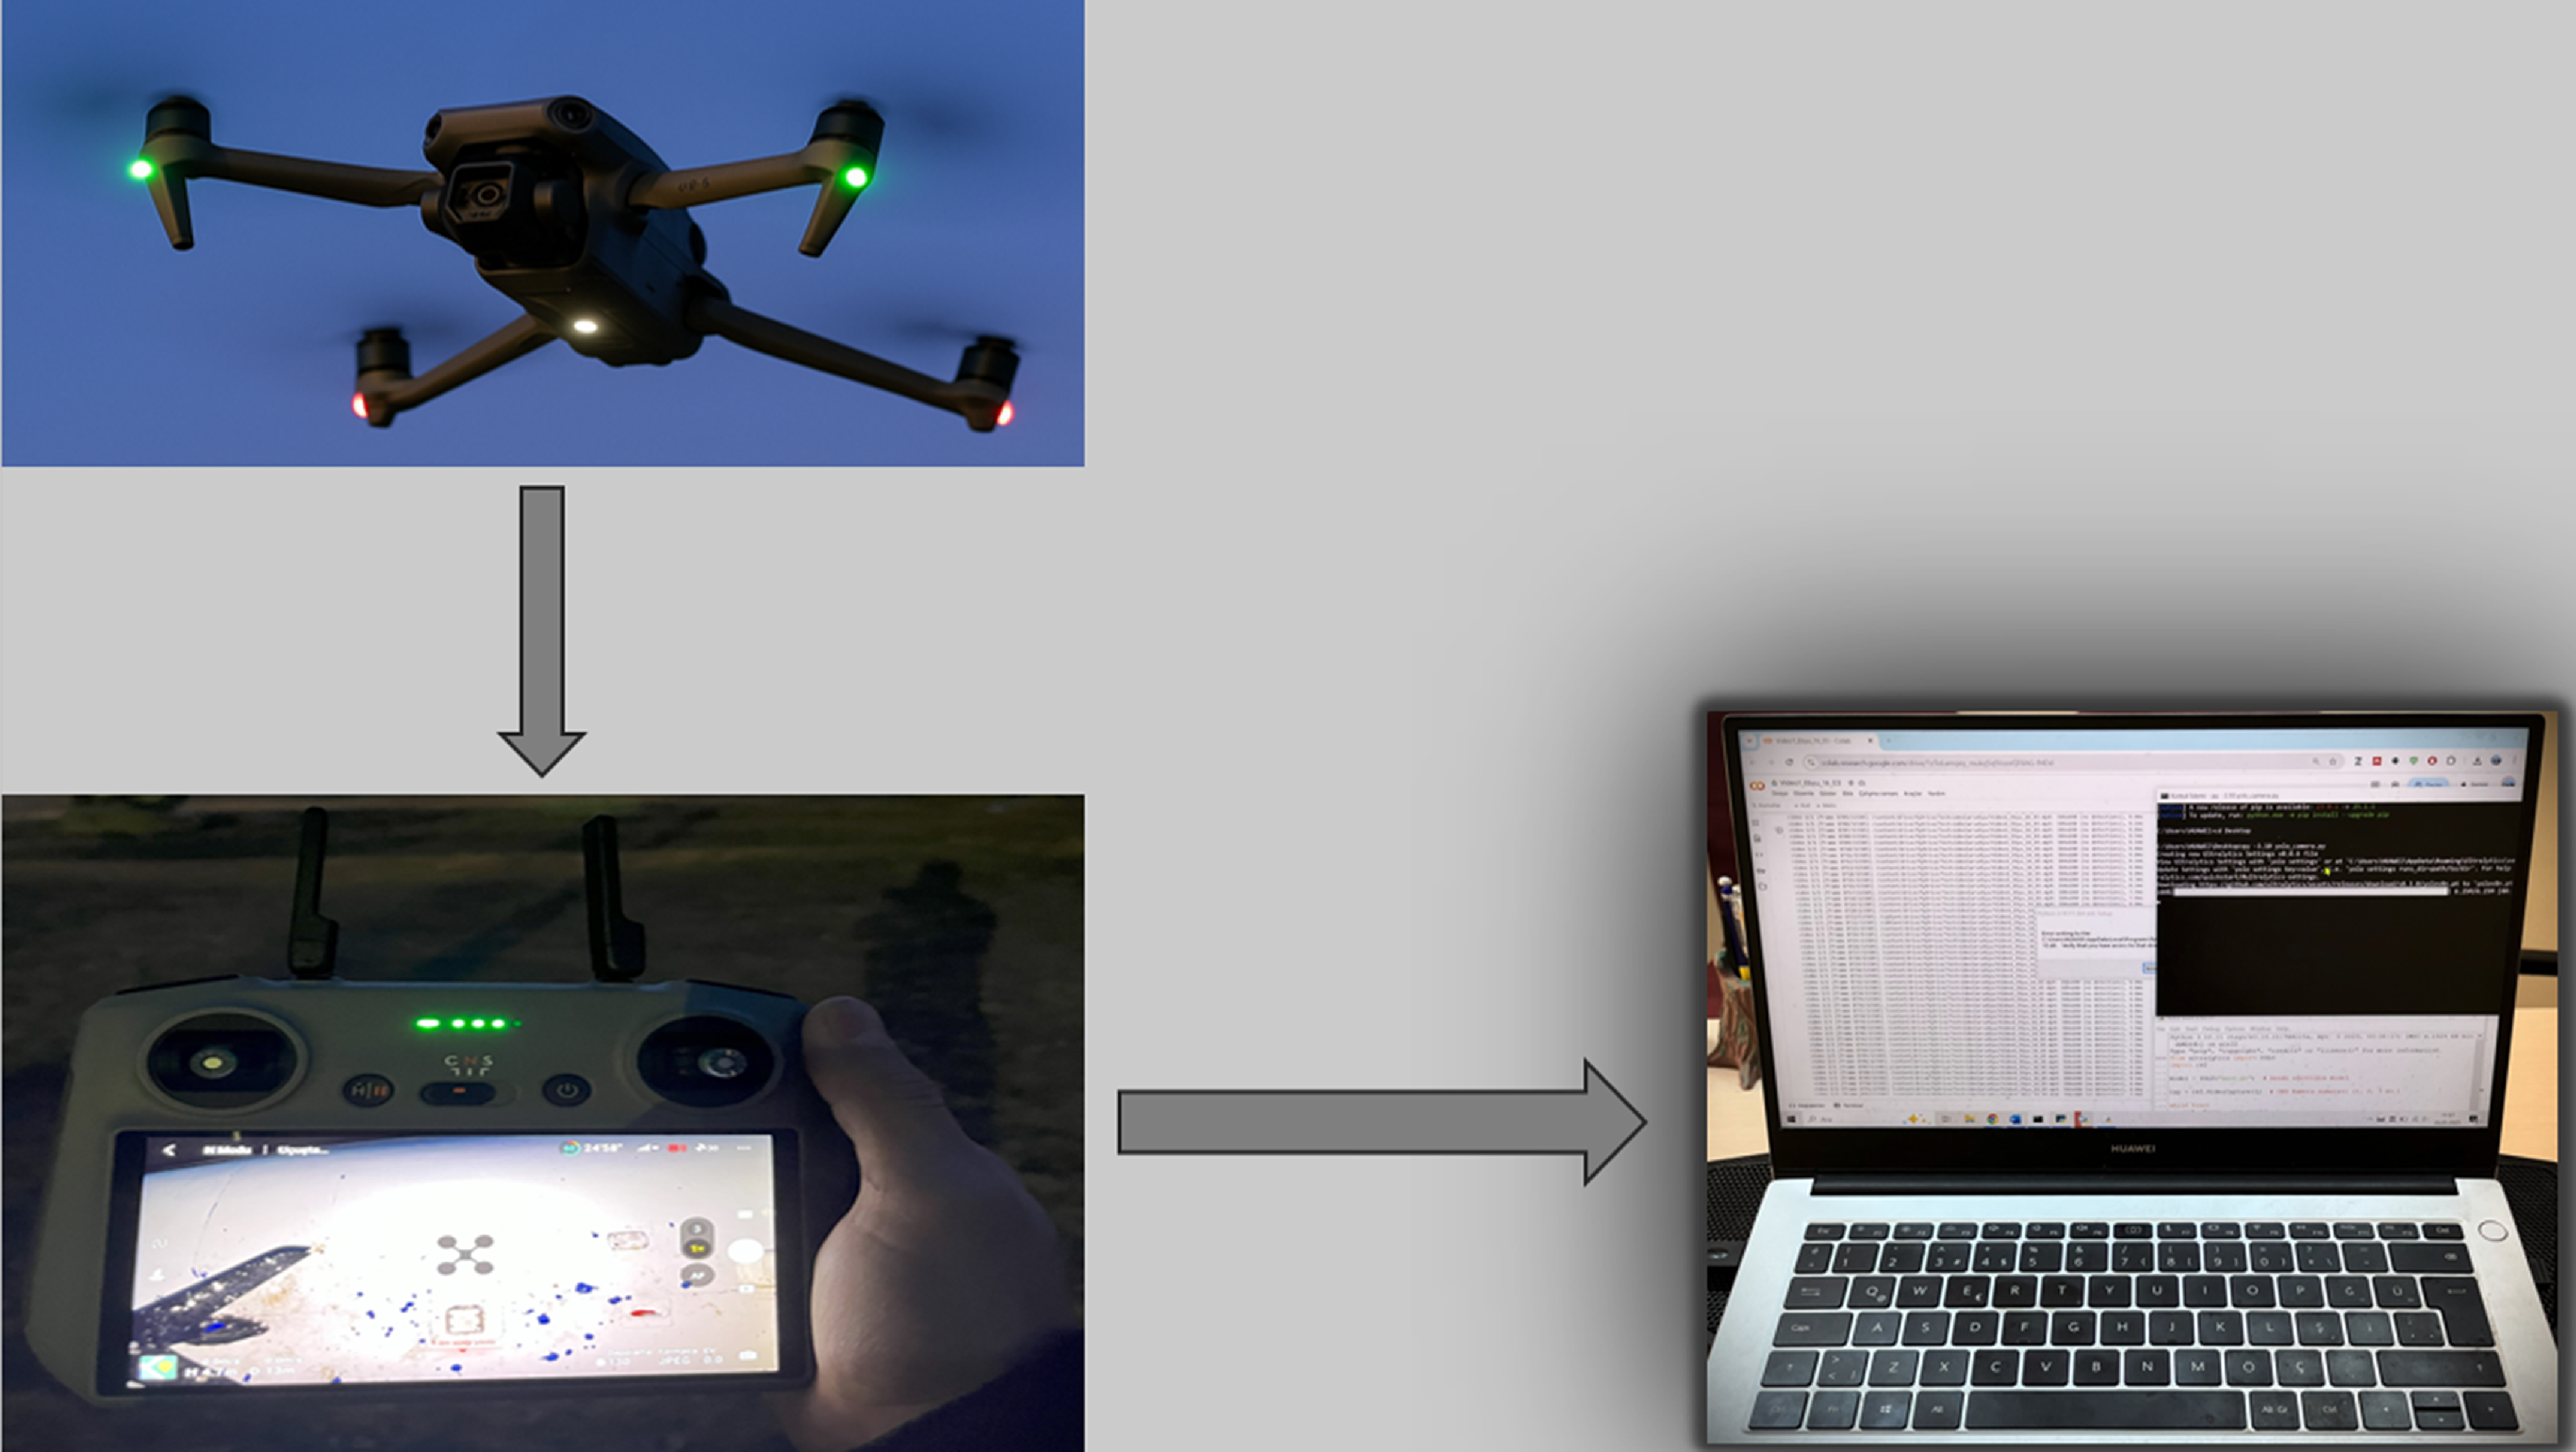
In aviation maintenance processes, the use of UAVs for visual inspections significantly enhances process effectiveness and operational efficiency [Reference Pardomoan, Asyrof and Jenie37]. These aircraft play a critical role in enhancing preventive maintenance processes and reducing long-term maintenance costs [Reference Benjumea, Alcántara, Ramos, Torres-Gonzalez, Sánchez-Cuevas and Capitan38]. The integration of UAVs into maintenance processes enables efficient inspection of aircraft surfaces that are difficult to access by traditional methods [Reference Zhang, Watson, Dobie, MacLeod and Pierce39, Reference Zhang, Watson, Dobie, MacLeod, Khan and Pierce40]. This is because UAVs offer advantages such as compact size, sustained flight capability, low cost and ease of maintenance [Reference Araar and Aouf41]. The use of UAVs is also crucial for minimising human-related risks in aviation maintenance and inspection processes [Reference Novák, Sedláčková, Bugaj, Kandera and Lusiak42]. In addition, the use of UAVs in inspection activities during aircraft maintenance processes reduces the number of maintenance technicians required [Reference Nooralishahi, Ibarra-Castanedo, Deane, López, Pant and Genest43]. Figure 1 illustrates the visual inspection process performed on the external surface of an aircraft. In this process, high-resolution images are captured using a UAV and the data is monitored and recorded in real time through a remote-control system. The obtained visual data is processed by an artificial intelligence model previously trained for inspection purposes, enabling automatic and highly accurate detection of defects such as corrosion and cracks on the aircraft’s external surface.
UAV-based image processing techniques.

Figure 1 Long description
The image consists of three elements: a drone flying in the sky, a person holding a drone controller, and a laptop displaying data on the screen. The drone is equipped with cameras and lights, indicating it is in operation. The person is holding a drone controller with a screen that shows a map and various icons, suggesting they are controlling the drone. The laptop screen displays a spreadsheet with data, likely related to the drone's operations or maintenance activities. The images are arranged in a sequence, showing the process of using a drone for inspection and analyzing the collected data on a laptop.
Li et al. [Reference Li, Li, Wang and Li44] emphasised that UAVs are widely preferred in inspection tasks conducted in challenging environments. UAVs serve as effective tools in various maintenance and monitoring applications, such as visual inspection of aircraft exteriors, runway condition monitoring and the inspection of airport infrastructure. Silberberg et al. [Reference Silberberg and Leishman45] investigated the potential use of UAVs for military aircraft maintenance. In their study, the coverage path planning algorithm was modified to allow the UAV to scan the entire upper surface of the aircraft. The analysis results indicated that multi-rotor UAVs can serve as a viable and effective inspection platform for military aircraft. Kim et al. [Reference Kim, Paes, Lee, Irizarry and Johnson46] used a method combining 3D point clouds generated from photogrammetry and thermal camera data to detect cracks, damage and debris on runway surfaces. This technique allows for rapid and highly accurate assessment of runway conditions, aiming to minimise the risk of structural damage to aircraft. Papa and Ponte [Reference Papa and Ponte16] developed an autonomous UAV system equipped with a low-cost, high-resolution camera for detecting damage to aircraft panels. The system is supported by distance and trajectory sensors for obstacle avoidance and path planning. An ultrasonic system was designed to maintain a fixed distance between the UAV and the aircraft, integrating an HD camera, microcontroller and multiple HC-SR-04 ultrasonic sensors into the chosen micro-UAV platform. Test results confirmed the accuracy of the distance measurement. Additionally, the high-resolution camera, managed by a computer board with embedded image processing software, successfully detected damaged areas and transmitted images in real time to a laptop at the ground control station. Hrúz et al. [Reference Hrúz, Bugaj, Novák, Kandera and Badánik47] conducted a visual inspection using a UAV equipped with high-resolution and infrared cameras to assess the condition of a training aircraft. The method involved image acquisition, pre-processing, segmentation, feature extraction, classification and post-processing. During the inspection, a surface discontinuity caused by a dent in the aluminium coating on the upper part of the left wing was detected. The study concluded that the proposed method is effective for aircraft inspection. Additionally, it was noted that this approach could improve flight safety, reduce technical personnel workload, shorten downtime and ensure more reliable maintenance records. Liao et al. [Reference Liao, Liou, Hidayat, Wen and Wu48] integrated a UAV system equipped with an infrared camera to assess the condition of composite structures on an aircraft’s exterior, enabling real-time image transmission to ground stations. The infrared images were analysed using MATLAB 2020b to detect structural defects. Results showed that the integration module allows faster defect detection, provides real-time analysis and feedback and improves overall inspection efficiency. Deane et al. [Reference Deane, Avdelidis, Ibarra-Castanedo, Zhang, Yazdani Nezhad and Williamson49] investigated the feasibility of automated aerial inspection using a UAV equipped with a thermographic imaging system. The study focused on aircraft panels made of carbon fibre reinforced polymer. The findings indicated that this UAV-based approach can significantly reduce inspection time, operational costs and technical personnel workload, while increasing the likelihood of detecting structural defects. Aleshin et al. [Reference Aleshin, Chernomorsky, Kuris, Lelkov and Ivakin50] investigated the feasibility of an automated procedure for inspecting an aircraft’s exterior before takeoff and proposed a novel method for this purpose. The system consists of a robotic complex combining a UAV and a UGV (unmanned ground vehicle), flexibly connected via a cable mechanism. The study analysed the system’s critical operating mode under extreme wind conditions affecting the UAV. Test results showed that the proposed algorithm can prevent collisions between the UAV and the aircraft and ensure the safe guidance of the UGV to its landing point. Ruiqian et al. [Reference Ruiqian, Juan and Hongfu35] developed a methodology using UAVs with calibrated flight paths for the visual inspection of civil aircraft, employing OpenCV-based ARuco markers for position estimation. The study showed that a UAV equipped with a high-resolution camera could automatically carry out the visual inspection tasks. Miranda et al. [Reference Miranda, Larnier, Herbulot and Devy51] developed a UAV-based system to inspect screws and rivets on aircraft fuselages. The study showed that a UAV guided along the fuselage using LiDAR technology could capture high-resolution images with meaningful metadata. A convolutional neural network (CNN)-based method was applied to detect screws and computer vision algorithms were used to evaluate the condition of each visible screw and identify missing or loose fasteners. While the method produced successful results on the reference aircraft, different aircraft types may require specific identification and analysis approaches. Tappe et al. [Reference Tappe, Dose, Oelsch, Karimi, Hösch and Heller52] demonstrated that damage to aircraft surfaces can be detected using UAV systems. A 3D LiDAR-based SLAM (simultaneous localisation and mapping) algorithm was used to allow the UAV to accurately determine its position and orientation relative to the aircraft. The developed autonomous inspection platform was noted to improve maintenance efficiency by reducing aircraft ground time. Cazzato et al. [Reference Cazzato, Olivares-Mendez, Sanchez-Lopez and Voos53] proposed a system to determine the position of an aircraft relative to a UAV during close-range autonomous visual inspections. The system processes images captured by an RGB camera mounted on a specific area of the aircraft and compares them with a database of natural reference points with known positions on the aircraft surface. It was tested in real flight scenarios and proved effective in accurately localising the aircraft. Tomić and Čokorilo [Reference Tomić and Čokorilo54] examined the advantages of UAV-based aircraft inspections and the related safety concerns. The HAZOP (hazard and operability) method was applied in conjunction with a safety risk assessment matrix to systematically evaluate potential risks. The findings showed that UAV-supported visual inspections significantly improved process efficiency and led to cost savings for both airlines and MRO organisations. Azami et al. [Reference Azami, Mohamed and Rafaai55] proposed a system for the visual inspection of aircraft. The system utilised the Intel RealSense Depth Camera D435 for depth sensing and the DJI Phantom 4 Pro V2 as the UAV platform. Test results showed that the system’s maximum measurement distance was 130 cm. In horizontal angle tests, reliable data were obtained between 60° and 90°, while in vertical angle tests, accurate measurements were achieved on flat surfaces between 80° and 90°. Bouarfa et al. [Reference Bouarfa, Doğru, Arizar, Aydoğan and Serafico56] proposed an enhanced neural network architecture based on Mask R-CNN for the visual inspection of aircraft, capable of detecting objects in images and generating segmentation masks for each instance. Test results showed that the model performed successfully. It was also noted that the proposed model can be trained to detect various types of structural damage, including lightning strike entry and exit points, paint damage, cracks and holes. Doğru et al. [Reference Doğru, Bouarfa, Arizar and Aydoğan57] conducted visual inspections of aircraft using a system based on Mask R-CNN integrated with an autonomous UAV. The system successfully detected multiple objects in a single image. The researchers noted that the proposed method could improve damage detection accuracy and enhance inspection reliability by minimising the impact of factors like fatigue and time pressure that may lead to human mistake. Liu et al. [Reference Liu, Dong, Li, Gong and Wang58] developed a UAV system for the visual inspection of aircraft, consisting of two main components: a positioning module and a defect detection module. The system employed the visual–inertial odometry method for position estimation and used pre-calibrated ArUco markers to prevent significant positional deviations. Results showed that crack detection was successfully achieved both in simulation and in real flight experiments. Stavropoulos et al. [Reference Stavropoulos, Athanasopoulou, Papacharalampopoulos, Kanellopoulos and Mourtzis59] developed an augmented reality (AR) application to support UAV-based inspections during the aircraft de-icing process prior to takeoff. The system was reported to significantly reduce inspection time and improve the accuracy of ice accumulation detection. Pugliese and Abel [Reference Pugliese and Abel60] proposed an adapted high-resolution 3D mapping approach for aircraft inspection using autonomous UAVs. The system utilised a 16-column laser scanner and an inertial measurement unit (IMU). The approach was noted to be suitable for datasets with strong non-Manhattan characteristics. Additionally, visual data could be combined with LiDAR projections to generate 3D defect maps of the aircraft surface using the LiDAR inertial odometry method.

This study proposes an original method for using image processing systems integrated with UAVs in aircraft maintenance processes. Many studies published in the literature have generally focused on detecting missing screws. This study aimed to detect surface defects such as corrosion, cracks and paint damage on the exterior surfaces of aircraft. However, distinguishing corrosion from paint defects is often challenging in practice. Factors such as colour tones, surface texture and light reflections can cause ambiguities in differentiating between these two defect types. Therefore, to maintain a clear focus on the selected classes, the detection of paint damage was excluded from the scope of this study. The visual data were collected via a UAV and subsequently analysed through an AI-supported processing system. This approach contributes to reducing aircraft maintenance times and minimising the risk of human-induced mistake.
2.0 Materials and methods
2.1 Unmanned aerial vehicle (UAV)
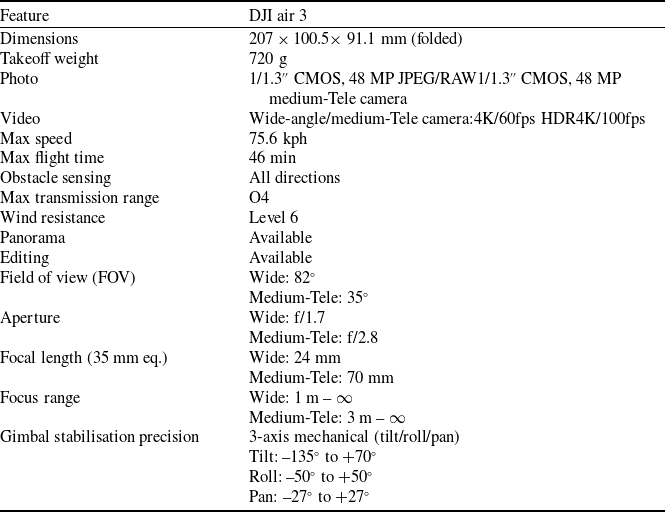
In this study, the DJI Air 3 UAV was used to capture photographs and video footage of the aircraft’s exterior. Thanks to its high manoeuvrability and stability, this multi-rotor UAV is well-suited for aerial aircraft inspections. The specifications of the DJI Air 3 are presented in Table 1 [61–63]. The DJI Air 3 is well-suited for visual inspection tasks such as corrosion and crack analysis. Its dual 48 MP camera system allows for both wide-area scanning and detailed inspection in a single flight. With a flight time of up to 46 min, it can cover large areas on a single battery while ensuring safe data collection. Its versatile obstacle detection sensors enable safe manoeuvres in complex environments. Additionally, the foldable and lightweight design allows for quick setup and easy transport, saving time in the field. These features make the DJI Air 3 a strong option for both technical performance and operational efficiency.
The technical specifications of the DJI Air 3 used in this study are presented in Table 1. The optical resolution is largely determined by the dual 1/1.3″ CMOS camera system, each with a resolution of 48 MP (8064 × 6048 pixels). The wide-angle camera has a 24 mm equivalent focal length, an f/1.7 aperture and an 82° field of view, while the medium-telephoto camera offers a 70 mm equivalent focal length, an f/2.8 aperture and a 35° field of view. Image clarity during flight is further enhanced by the UAV’s 3-axis mechanical gimbal (tilt range: −135° to +70°, roll range: −50° to +50°, pan range: −27° to +27°) and Level 6 wind-resistance capability, which together minimise motion blur and vibration. The combination of high-resolution optical systems and precise stabilisation ensures clear images under various environmental conditions, with the contribution of the camera hardware to resolution, along with the UAV’s stabilisation system, being significant both quantitatively and qualitatively.
2.2 Image recognition and defect detection
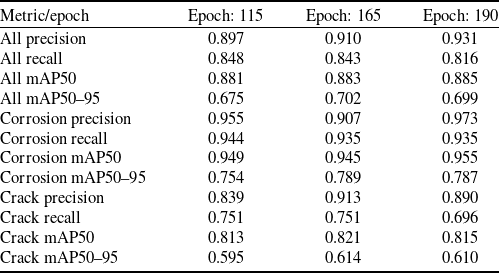
Image recognition is an intelligent information processing technique based on computer vision, aimed at analysing and identifying specific objects or characteristic features in digital images [Reference Krysiak and Kubik64]. Defect detection technologies play a critical role in visual inspections. Through model training using datasets tailored to specific defect types, it is now possible to automatically classify and recognise complex visual patterns [Reference Liao, Liou, Hidayat, Wen and Wu48, Reference Liao, Wen and Wu65, Reference Jothi, Gokulnath, Vetrivel, Balaji and Sujay Iswarian Issac66]. This study explores the integration of artificial intelligence technologies with UAVs to enhance accuracy, efficiency and speed in aircraft exterior inspections. It emphasises the importance of proper equipment setup and precise operational planning to ensure effective outcomes. In the initial phase, a dataset focusing on aircraft structures was created by collecting images of cracks and corrosion. The dataset was prepared using the Roboflow platform and formatted for compatibility with Ultralytics’ YOLOv8 architecture. Data augmentation techniques such as horizontal and vertical flipping, saturation adjustment (±5%) and low-level noise addition (up to 0.1% of pixels) were applied to the dataset to increase diversity and improve the model’s generalisation ability. The dataset includes 1,652 images labelled as ‘crack’ and 1,472 as ‘corrosion’. The dataset, created using the Roboflow platform, was trained in the Google Colab environment using the Python programming language and numerous epoch values were tested during the model training process. In the initial phase, both lower and higher values were evaluated. The final comparison included eight epoch values (100, 115, 125, 135, 145, 165, 190) that demonstrated consistent performance. The evaluation was conducted using Precision (P), Recall (R), mAP50 and mAP50–95 metrics. Upon examining the results, the 165-epoch model achieved a balanced performance with P = 0.910, R = 0.843, mAP50 = 0.883 and mAP50–95 = 0.702 across all classes. In particular, the corrosion class achieved one of the highest values, with mAP50–95 = 0.789. While some epoch values (e.g. 190) produced higher scores in certain metrics, imbalances (e.g. a decrease in recall) were observed in other metrics. Lower epoch values (e.g. 100, 115) reduced the risk of overfitting but fell short of the 165-epoch model in terms of the overall mAP50–95 score. Therefore, 165 epochs were selected as the reference value, as it provided the optimal balance between accuracy, sensitivity and overall average performance. Performance metrics for the three most successful epoch values are presented in Table 2.
Comparison of different epoch numbers

The epoch value in Table 2 represents a complete cycle performed by the model on all training data. For example, the epoch 115 value shown in Table 2 indicates that the model has seen the training data 115 times and has reached that stage in the learning process. Since performance metrics such as accuracy, precision and recall may vary with each epoch value, the goal is to identify the most efficient learning point by comparing different epochs. The precision value indicates the proportion of positive results detected by the model that are actually correct. The recall value shows how many of the actual positive cases were successfully identified by the model. The mAP50 and mAP50–95 values represent the model’s average accuracy. While mAP50 is calculated using a 50% intersection-over-union (IoU) threshold, mAP50–95 provides a more comprehensive evaluation across multiple thresholds ranging from 50% to 95%.
When Table 2 is examined, it is observed that the highest precision value for the All class (0.931) was obtained at epoch 190, while the highest recall value (0.848) was recorded at epoch 115. The highest mAP50 value (0.885) was also achieved at epoch 190 and the best mAP50–95 score (0.702) was obtained at epoch 165. In terms of class-specific performance, the Crack class showed the highest performance at epoch 165, whereas the Corrosion class performed best at epoch 190. Overall, the most balanced IoU success based on mAP50–95 was achieved at epoch 165.
2.3 Experimental setup
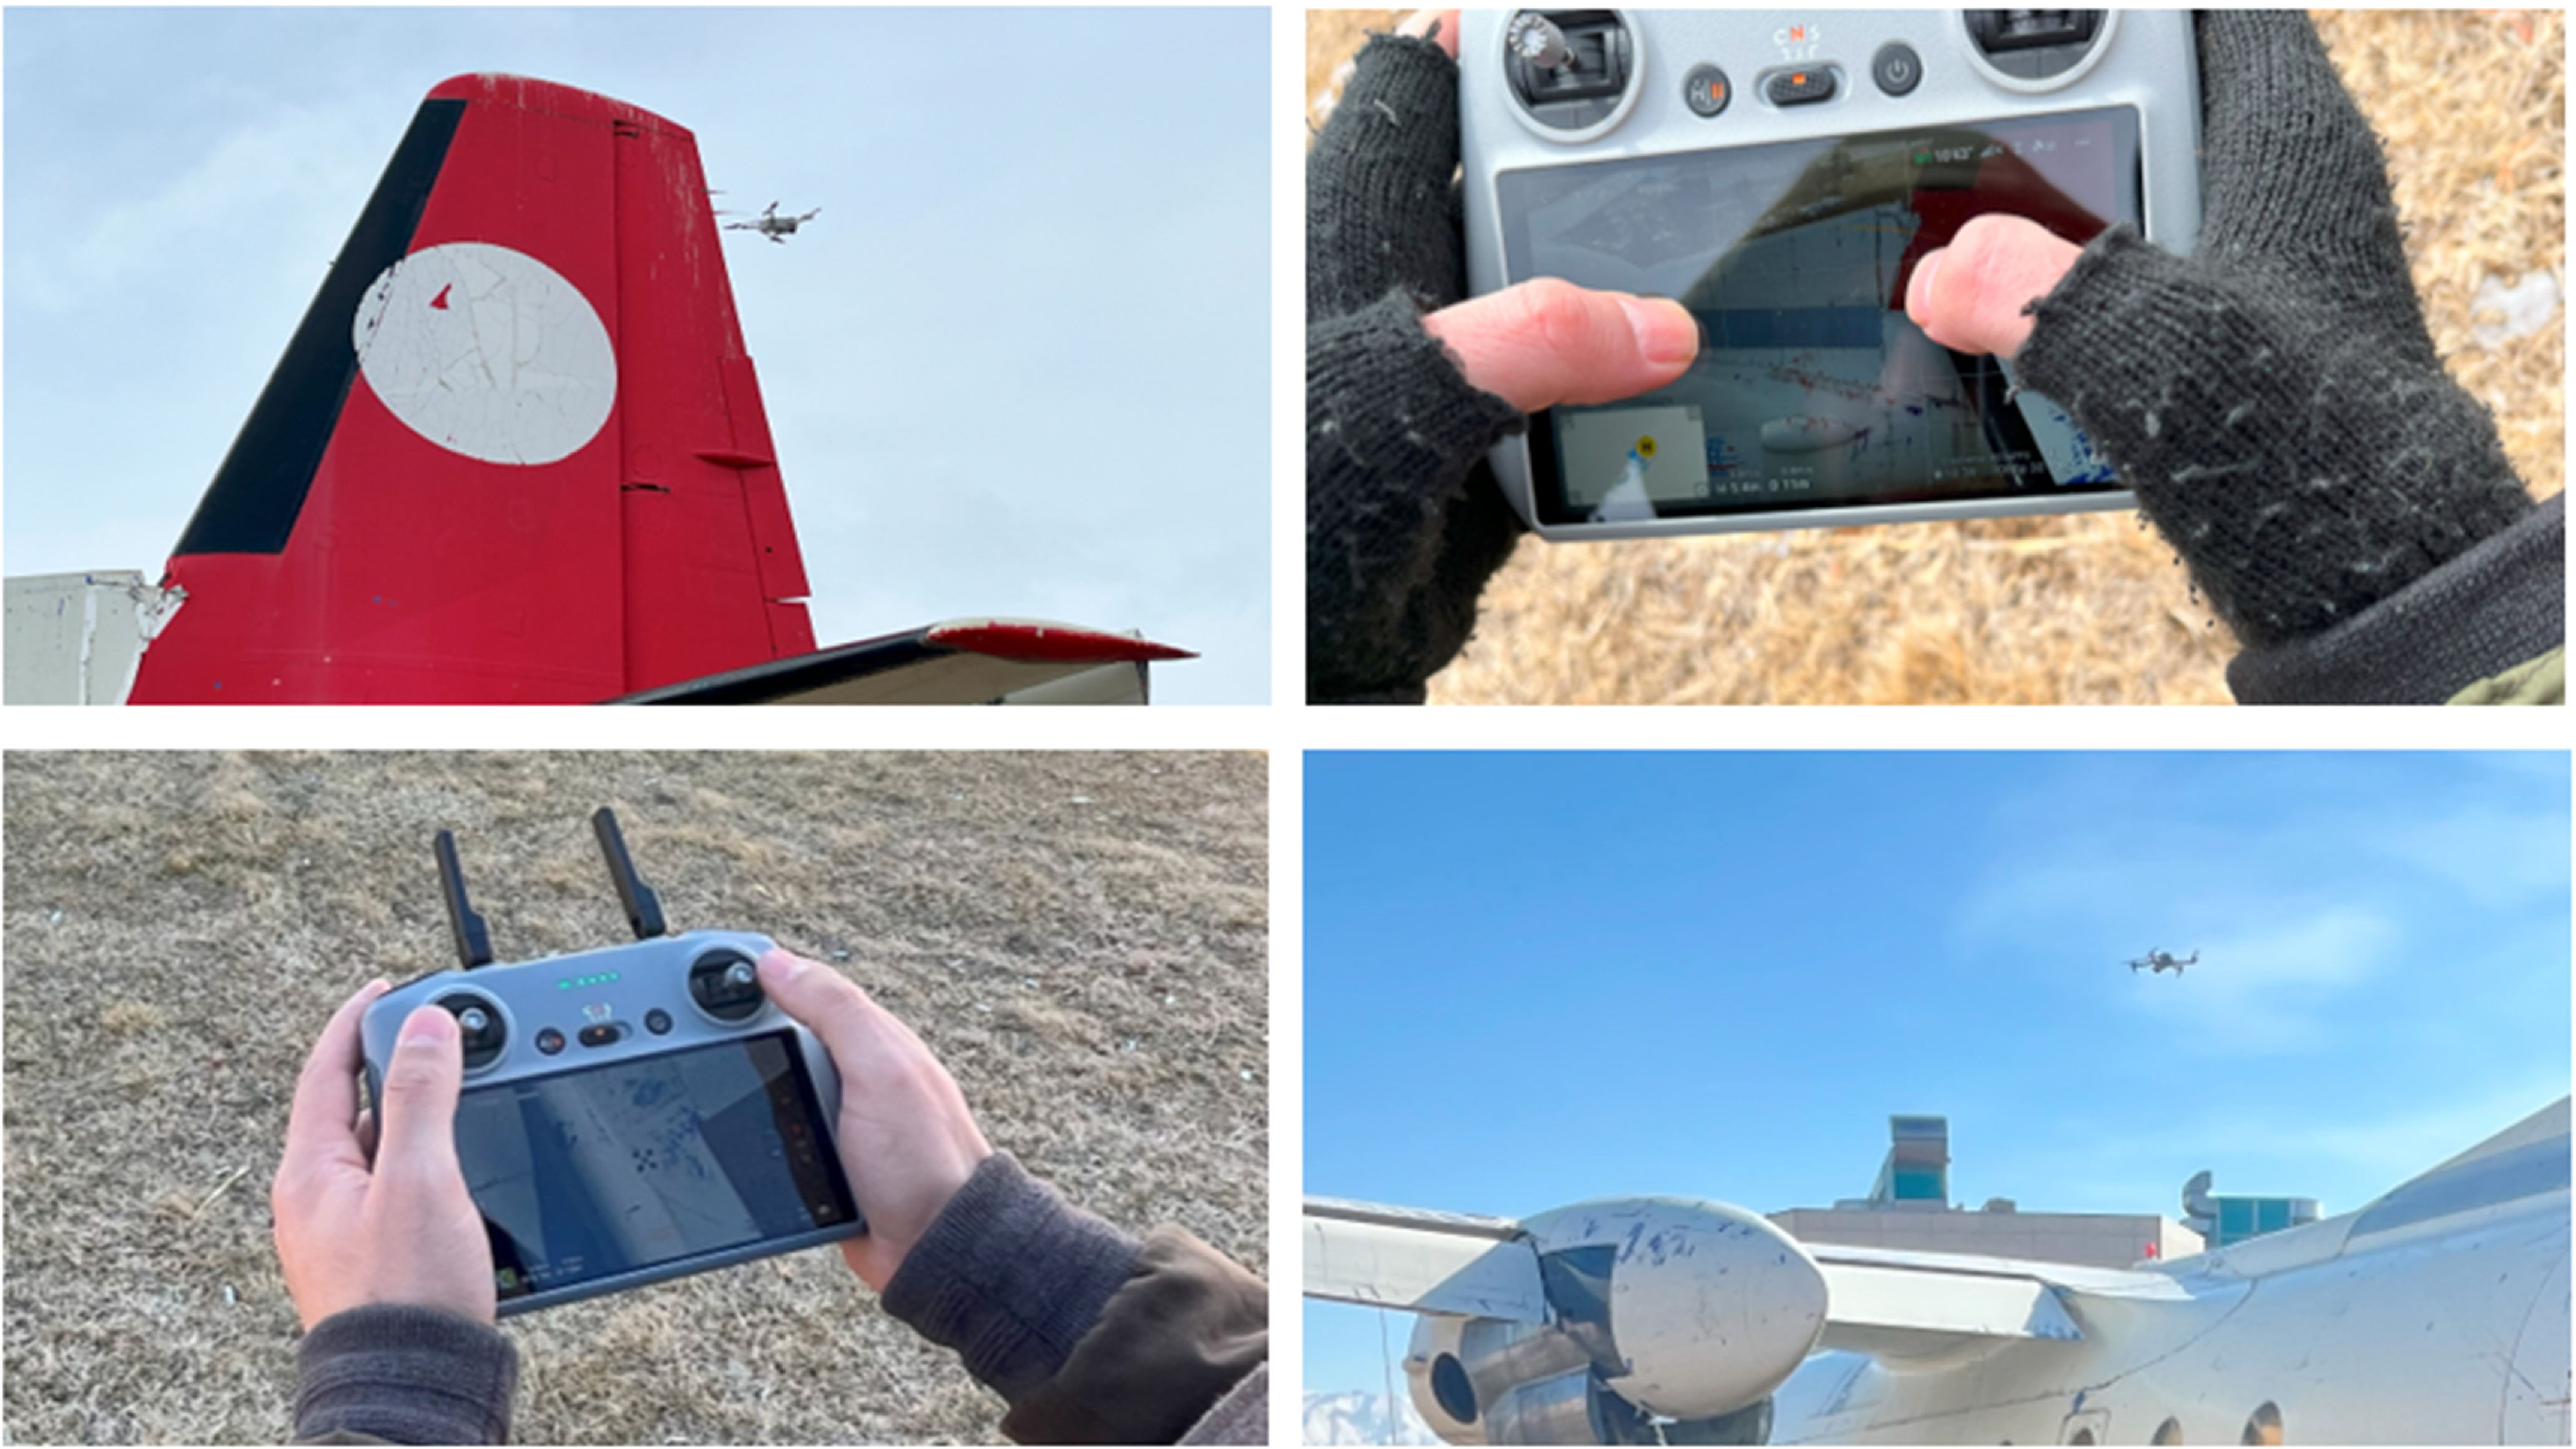
In this study, a novel method was developed to detect and analyse defects on the outer surface of aircraft. The objective was to identify, classify and evaluate cracks and corrosion in a short time frame, enabling timely repair and ensuring the aircraft’s readiness for flight. To achieve this, an UAV was employed to inspect the aircraft’s external structure. The images captured by the UAV were then used for defect detection. Figure 2 illustrates the UAV-based image acquisition process for inspecting the aircraft’s exterior.
Image capture using UAVs.

Figure 2 Long description
The image consists of four separate photos related to aircraft maintenance using unmanned aerial vehicles (UAVs). The top left photo shows the tail section of an aircraft with a red and white design, and a small UAV flying nearby. The top right photo shows a person wearing gloves operating a UAV controller with a screen displaying a live feed from the UAV. The bottom left photo shows a close-up of a person's hands holding a UAV controller. The bottom right photo shows the front section of an aircraft with a UAV flying in the background. These images illustrate the use of UAVs for inspecting aircraft, highlighting the integration of technology in maintenance processes.
The UAV inspection conducted in this study was based on standard imaging methods and utilised the DJI Air 3 platform. The device’s gimbal range, which can be tilted from −135° to +60°, is wider than that of many consumer-grade drones, enabling the capture of a substantial portion of the underside and wing areas. However, due to the mechanical limitations of the gimbal, the necessity of maintaining a safe flight distance and the inaccessibility of narrow or obstructed areas, these regions could not be fully inspected, resulting in unavoidable blind spots. The collected data consisted of high-resolution (48 MP, 8064 × 6048 pixels) 2D photographs and video recordings, with additional still frames extracted from the recorded videos. Since no direct 3D scanning equipment was used, the dataset is inherently two-dimensional and no 3D reconstruction process was applied. Therefore, surface curvatures and other non-Manhattan features on the aircraft surfaces are represented solely through 2D projections. The defect detection process employed a standard 2D object detection algorithm based on YOLOv8, with no optimisation specific to the Manhattan-world assumption. Instead, a training dataset containing examples captured from different angles and surface curvatures was used to ensure the algorithm could produce reliable results on both flat and curved surfaces. This approach enabled effective performance without the need for additional algorithm development for non-Manhattan geometries. Nevertheless, it is acknowledged that high curvature or complex geometries may affect both 3D reconstruction and defect detection performance. Numerically evaluating this potential impact on detection accuracy and investigating dedicated algorithm designs for non-Manhattan surfaces are considered valuable topics for future studies.
The image acquisition process using UAVs was conducted under varying meteorological conditions and at different times of the day. This comprehensive data collection aimed to identify the limitations of UAV imaging performance in adverse weather and low-light scenarios. Through this approach, the impact of environmental factors on image quality was systematically analysed. The successful acquisition of images of an aircraft’s exterior surface using a UAV is directly influenced by the size of the area to be inspected. Furthermore, the environmental conditions under which the inspections are conducted are among the factors affecting the total inspection time. In this study, UAV-based inspection of the aircraft’s exterior surface, along with image recording, was completed in an average of 30–45 min.
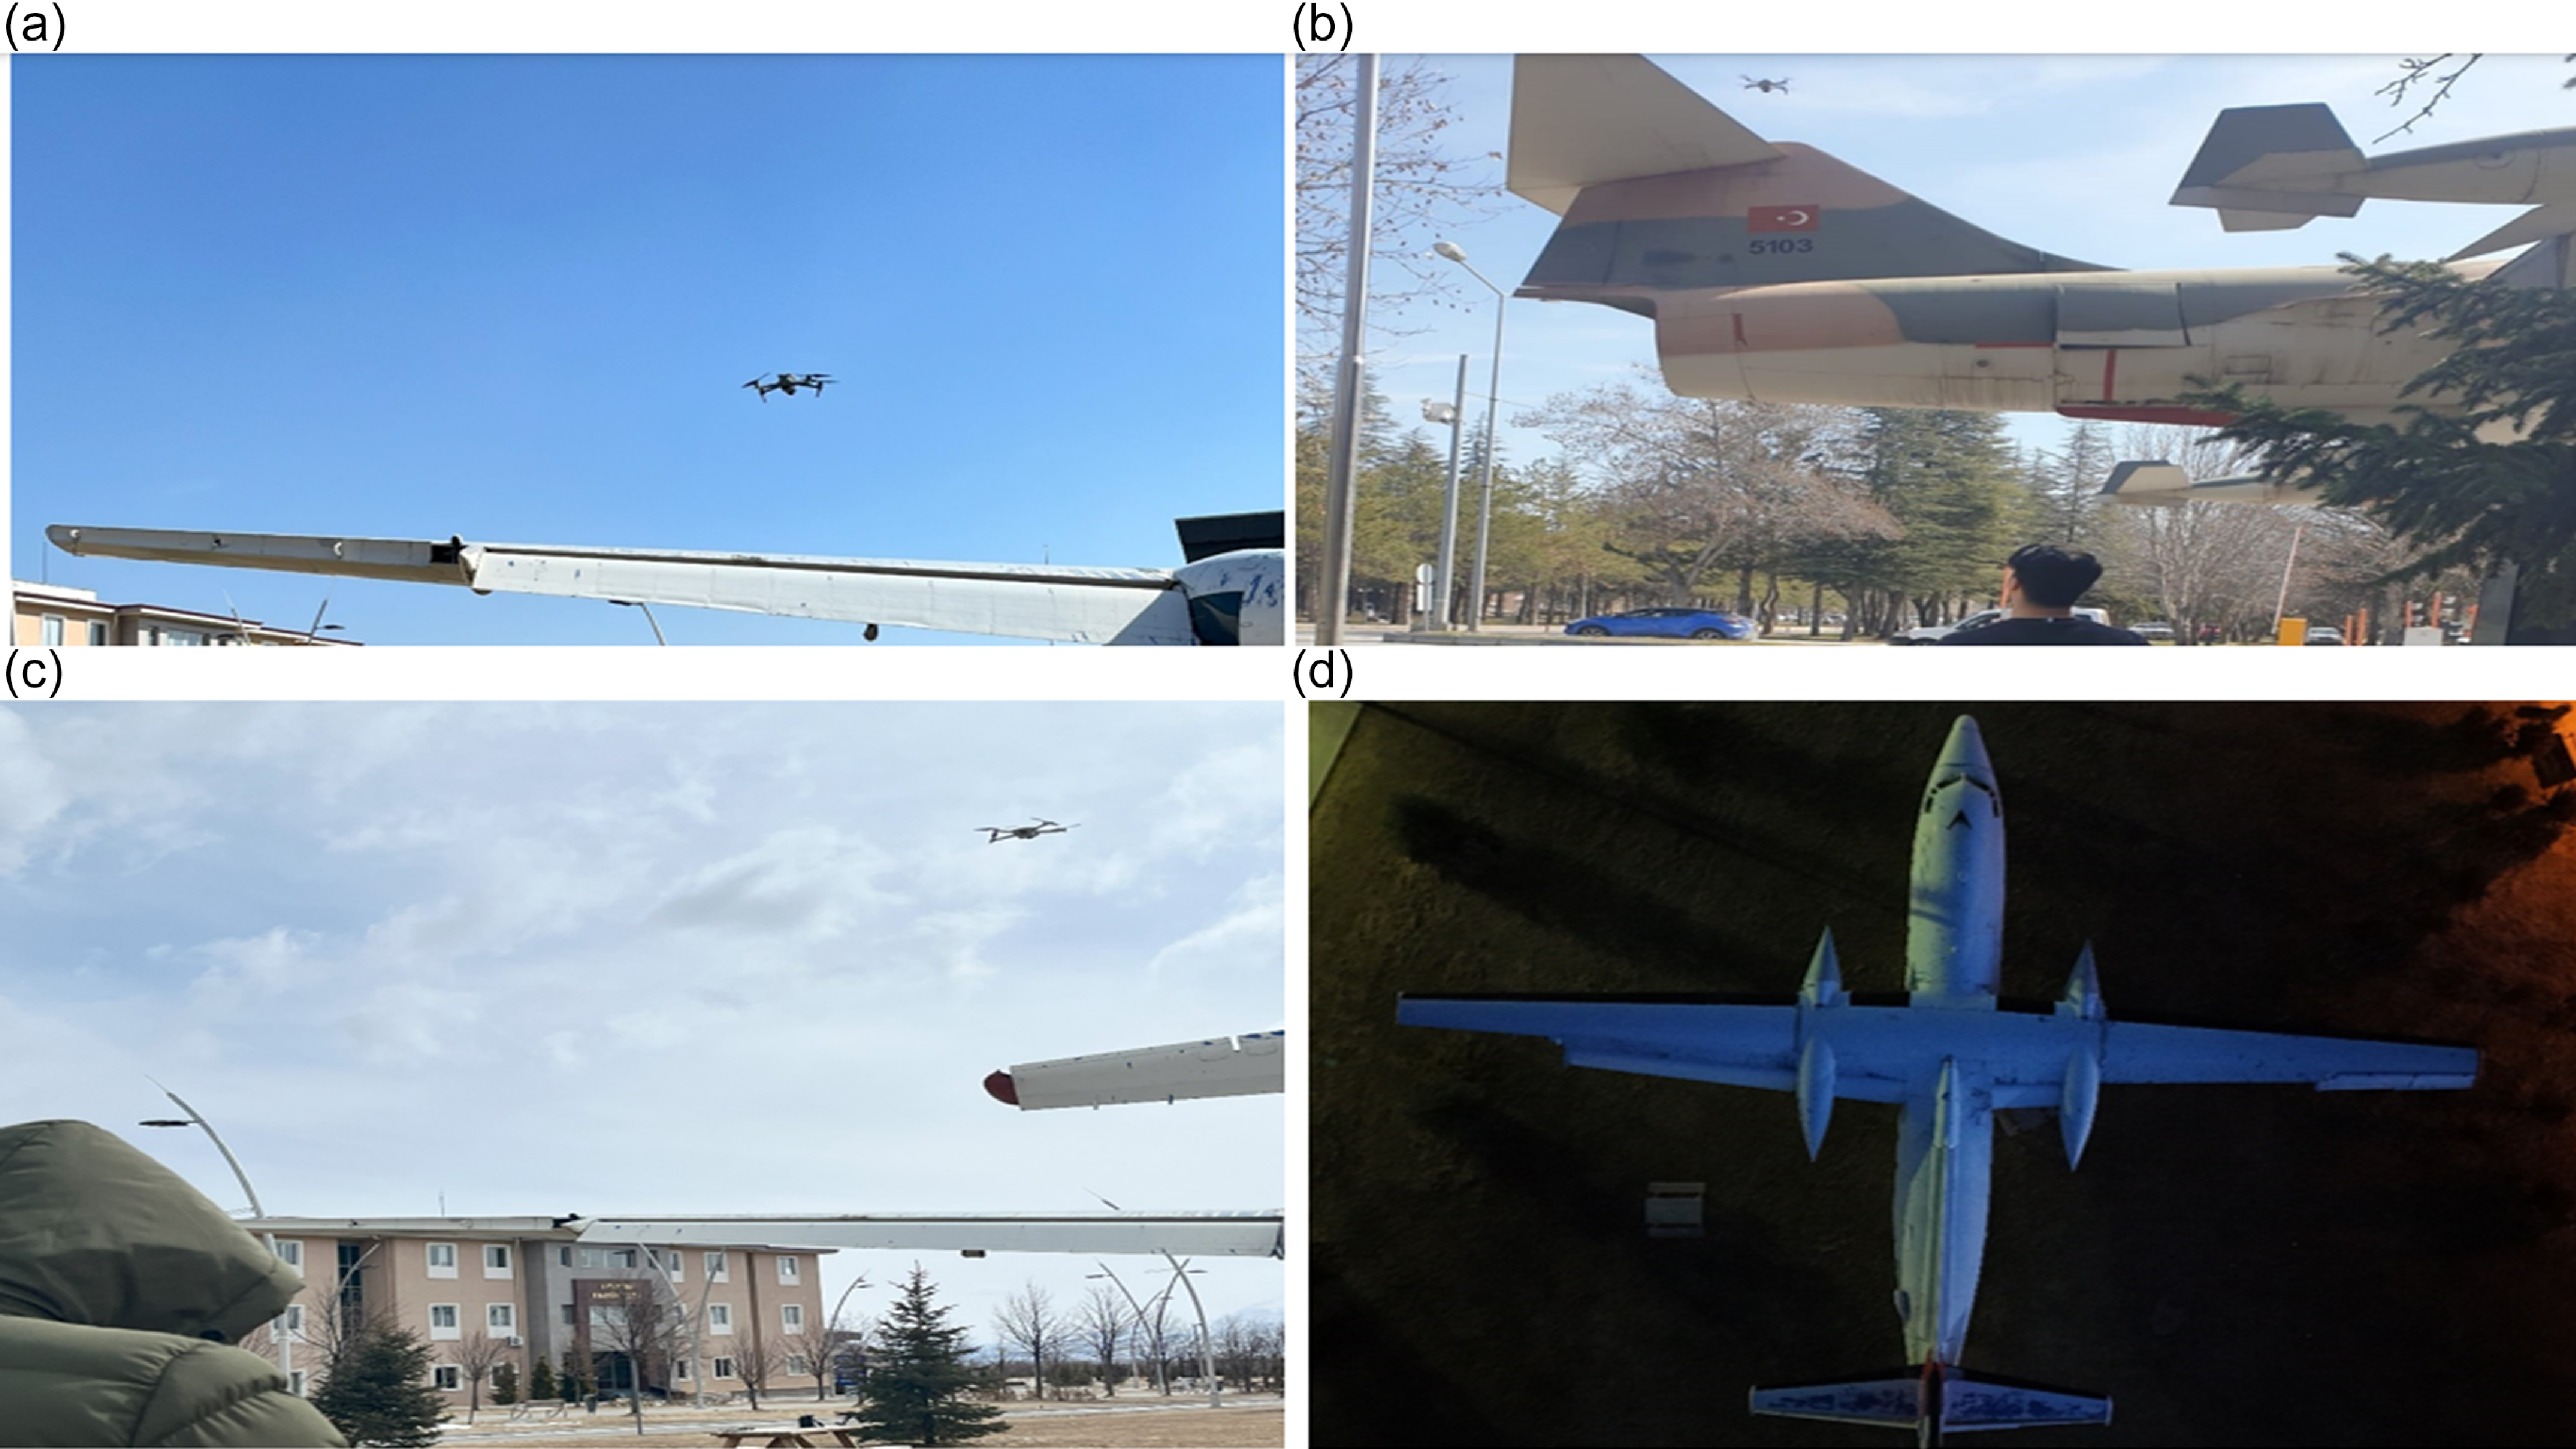
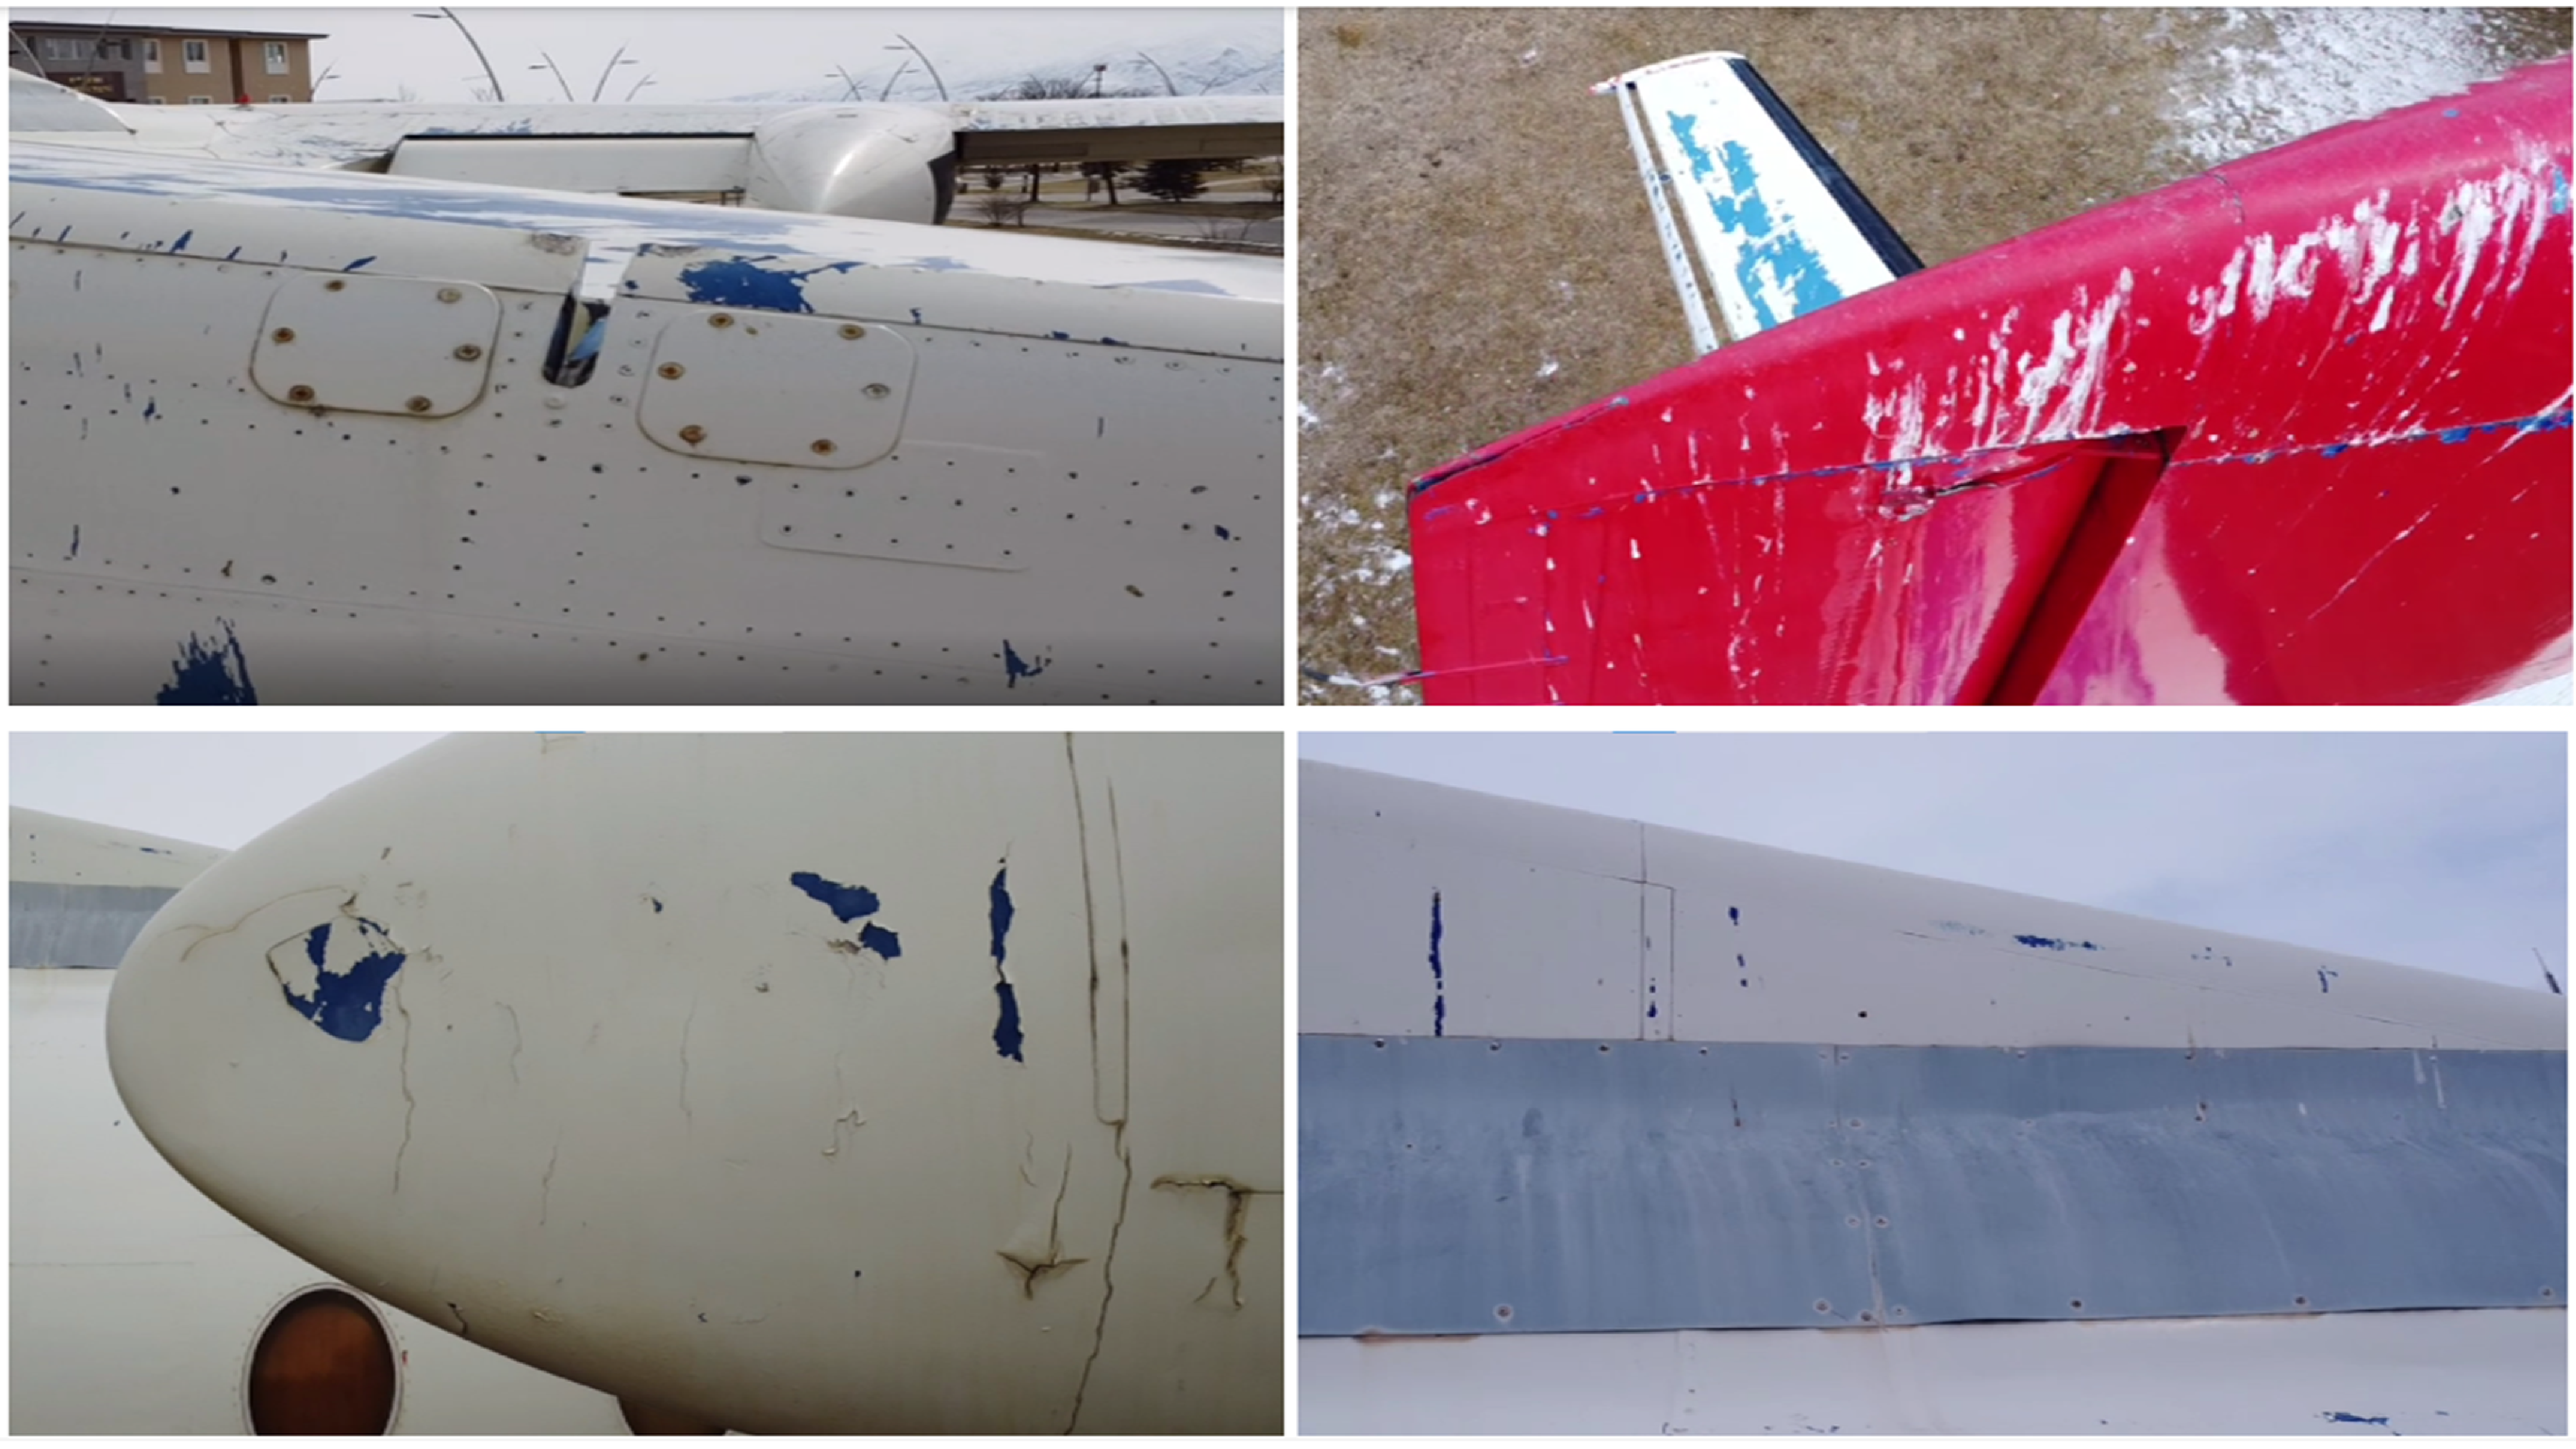
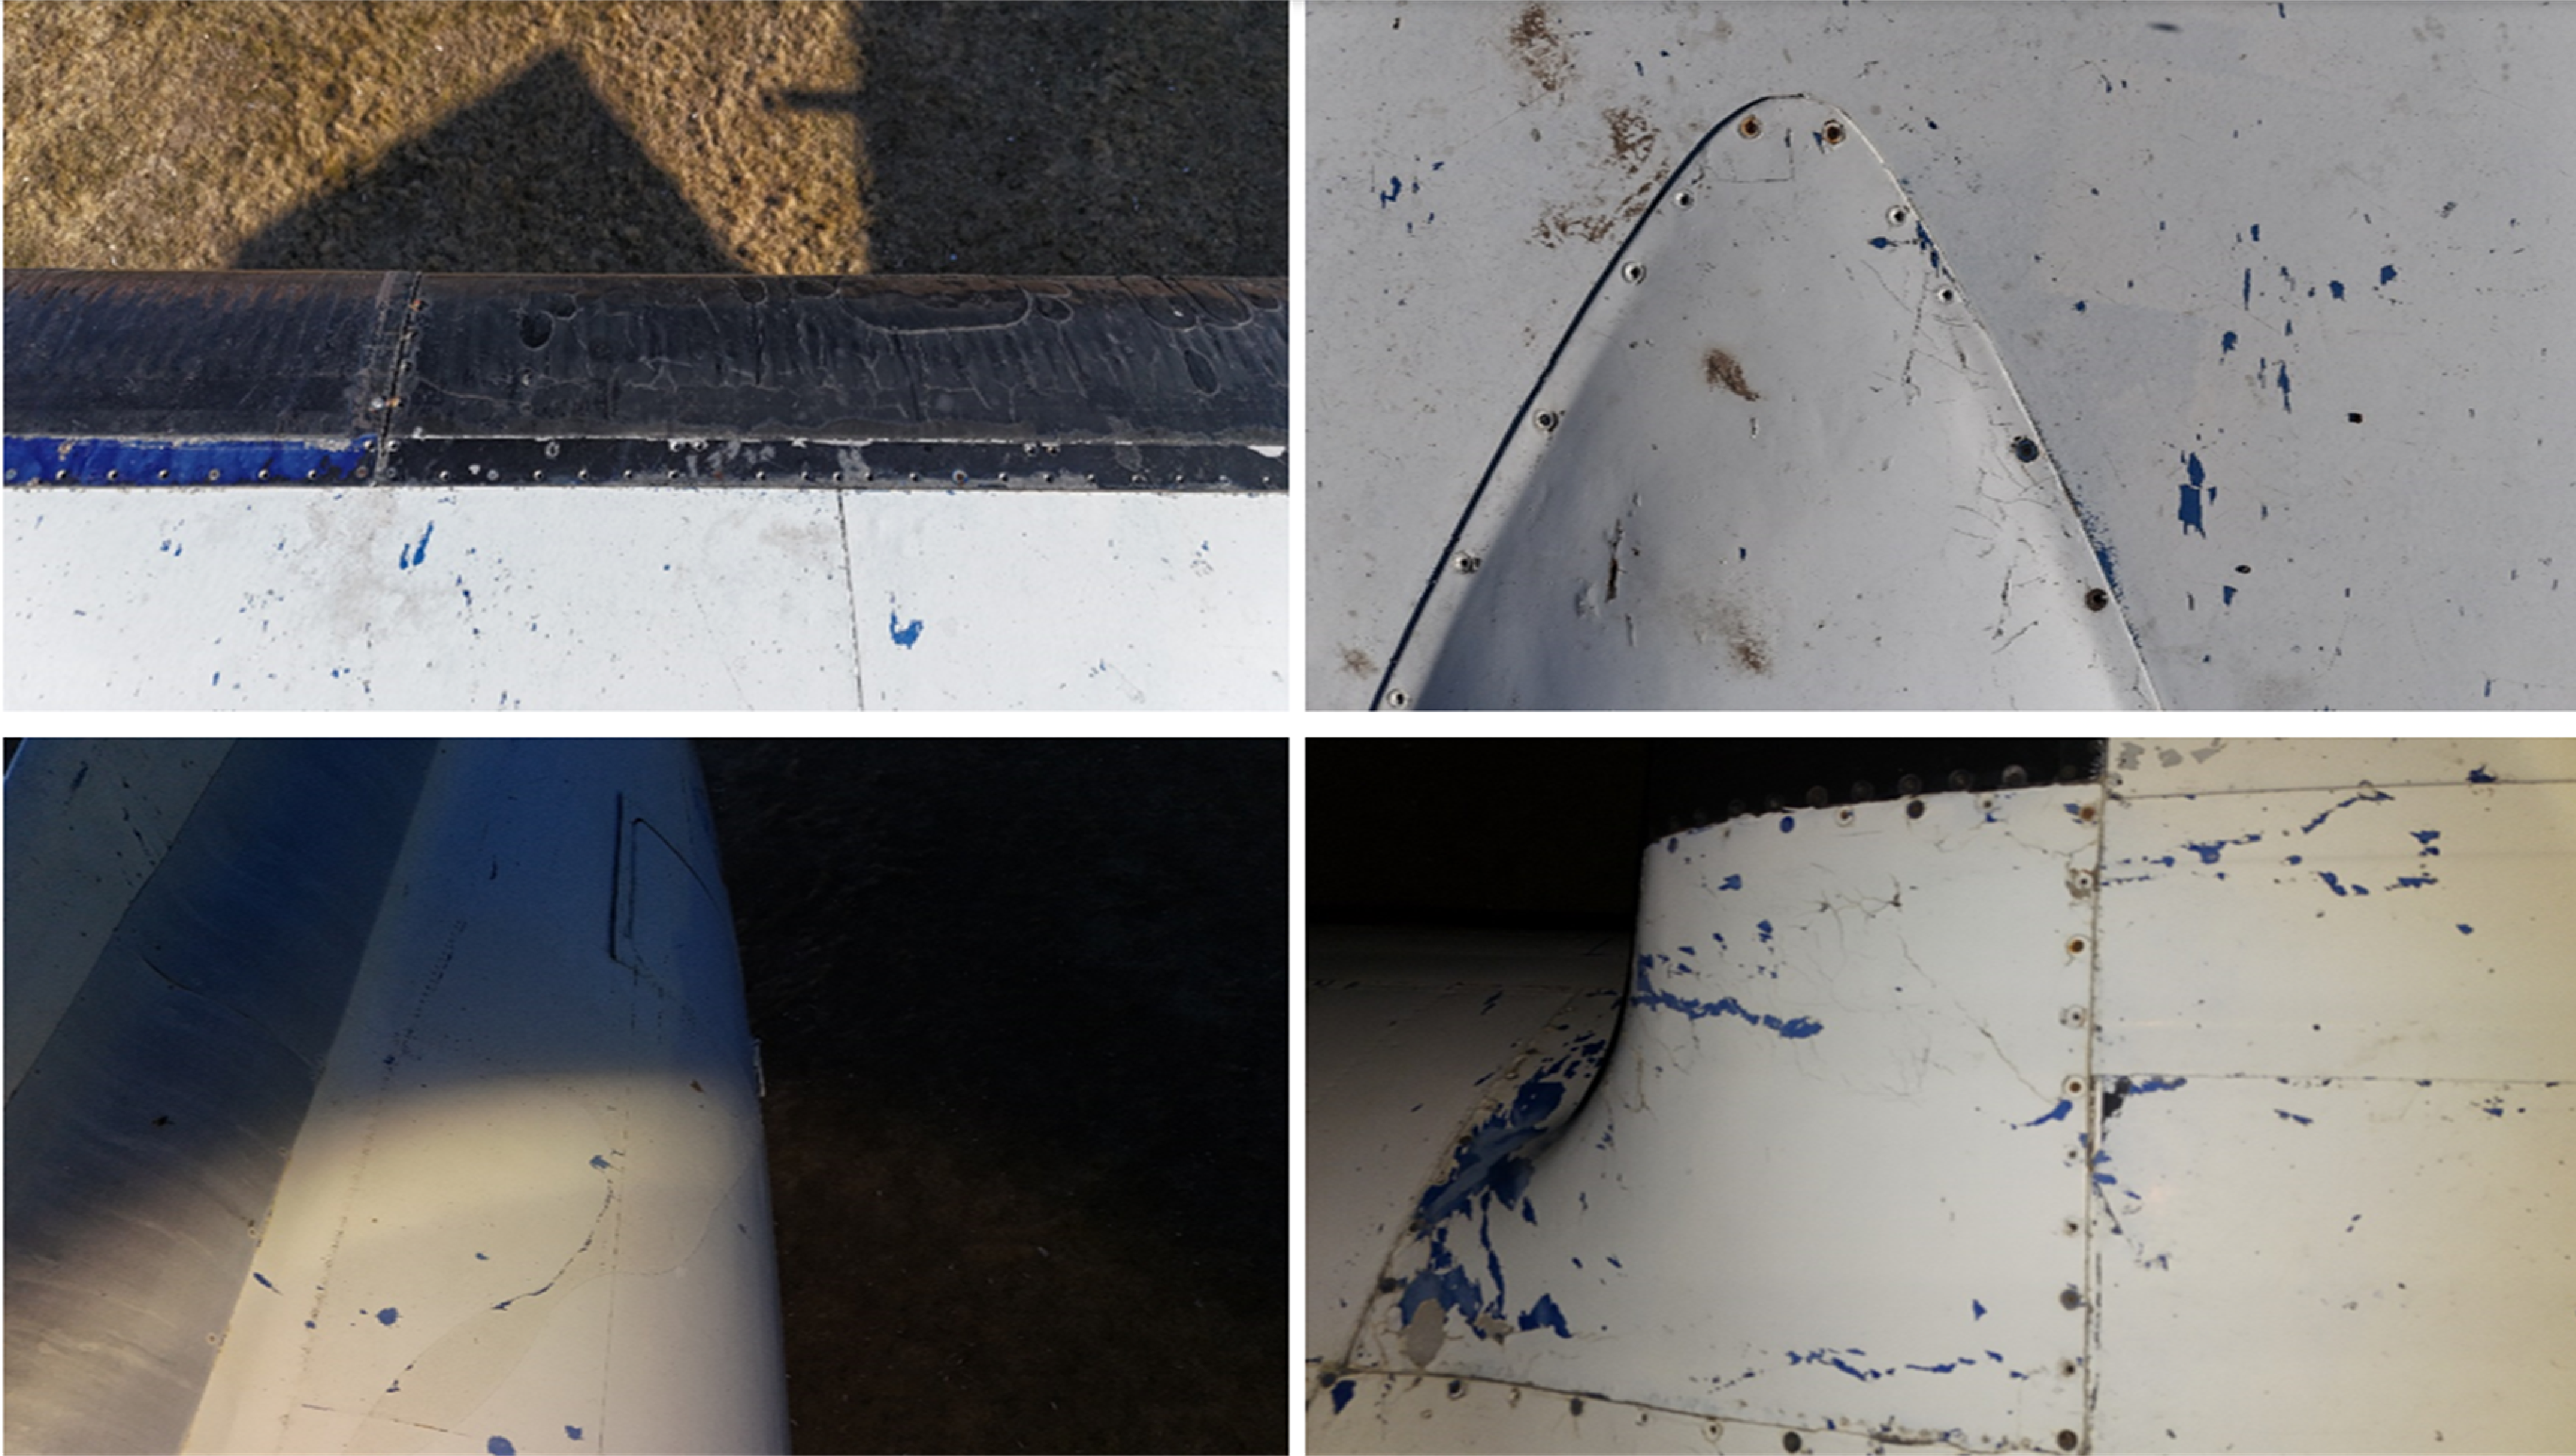
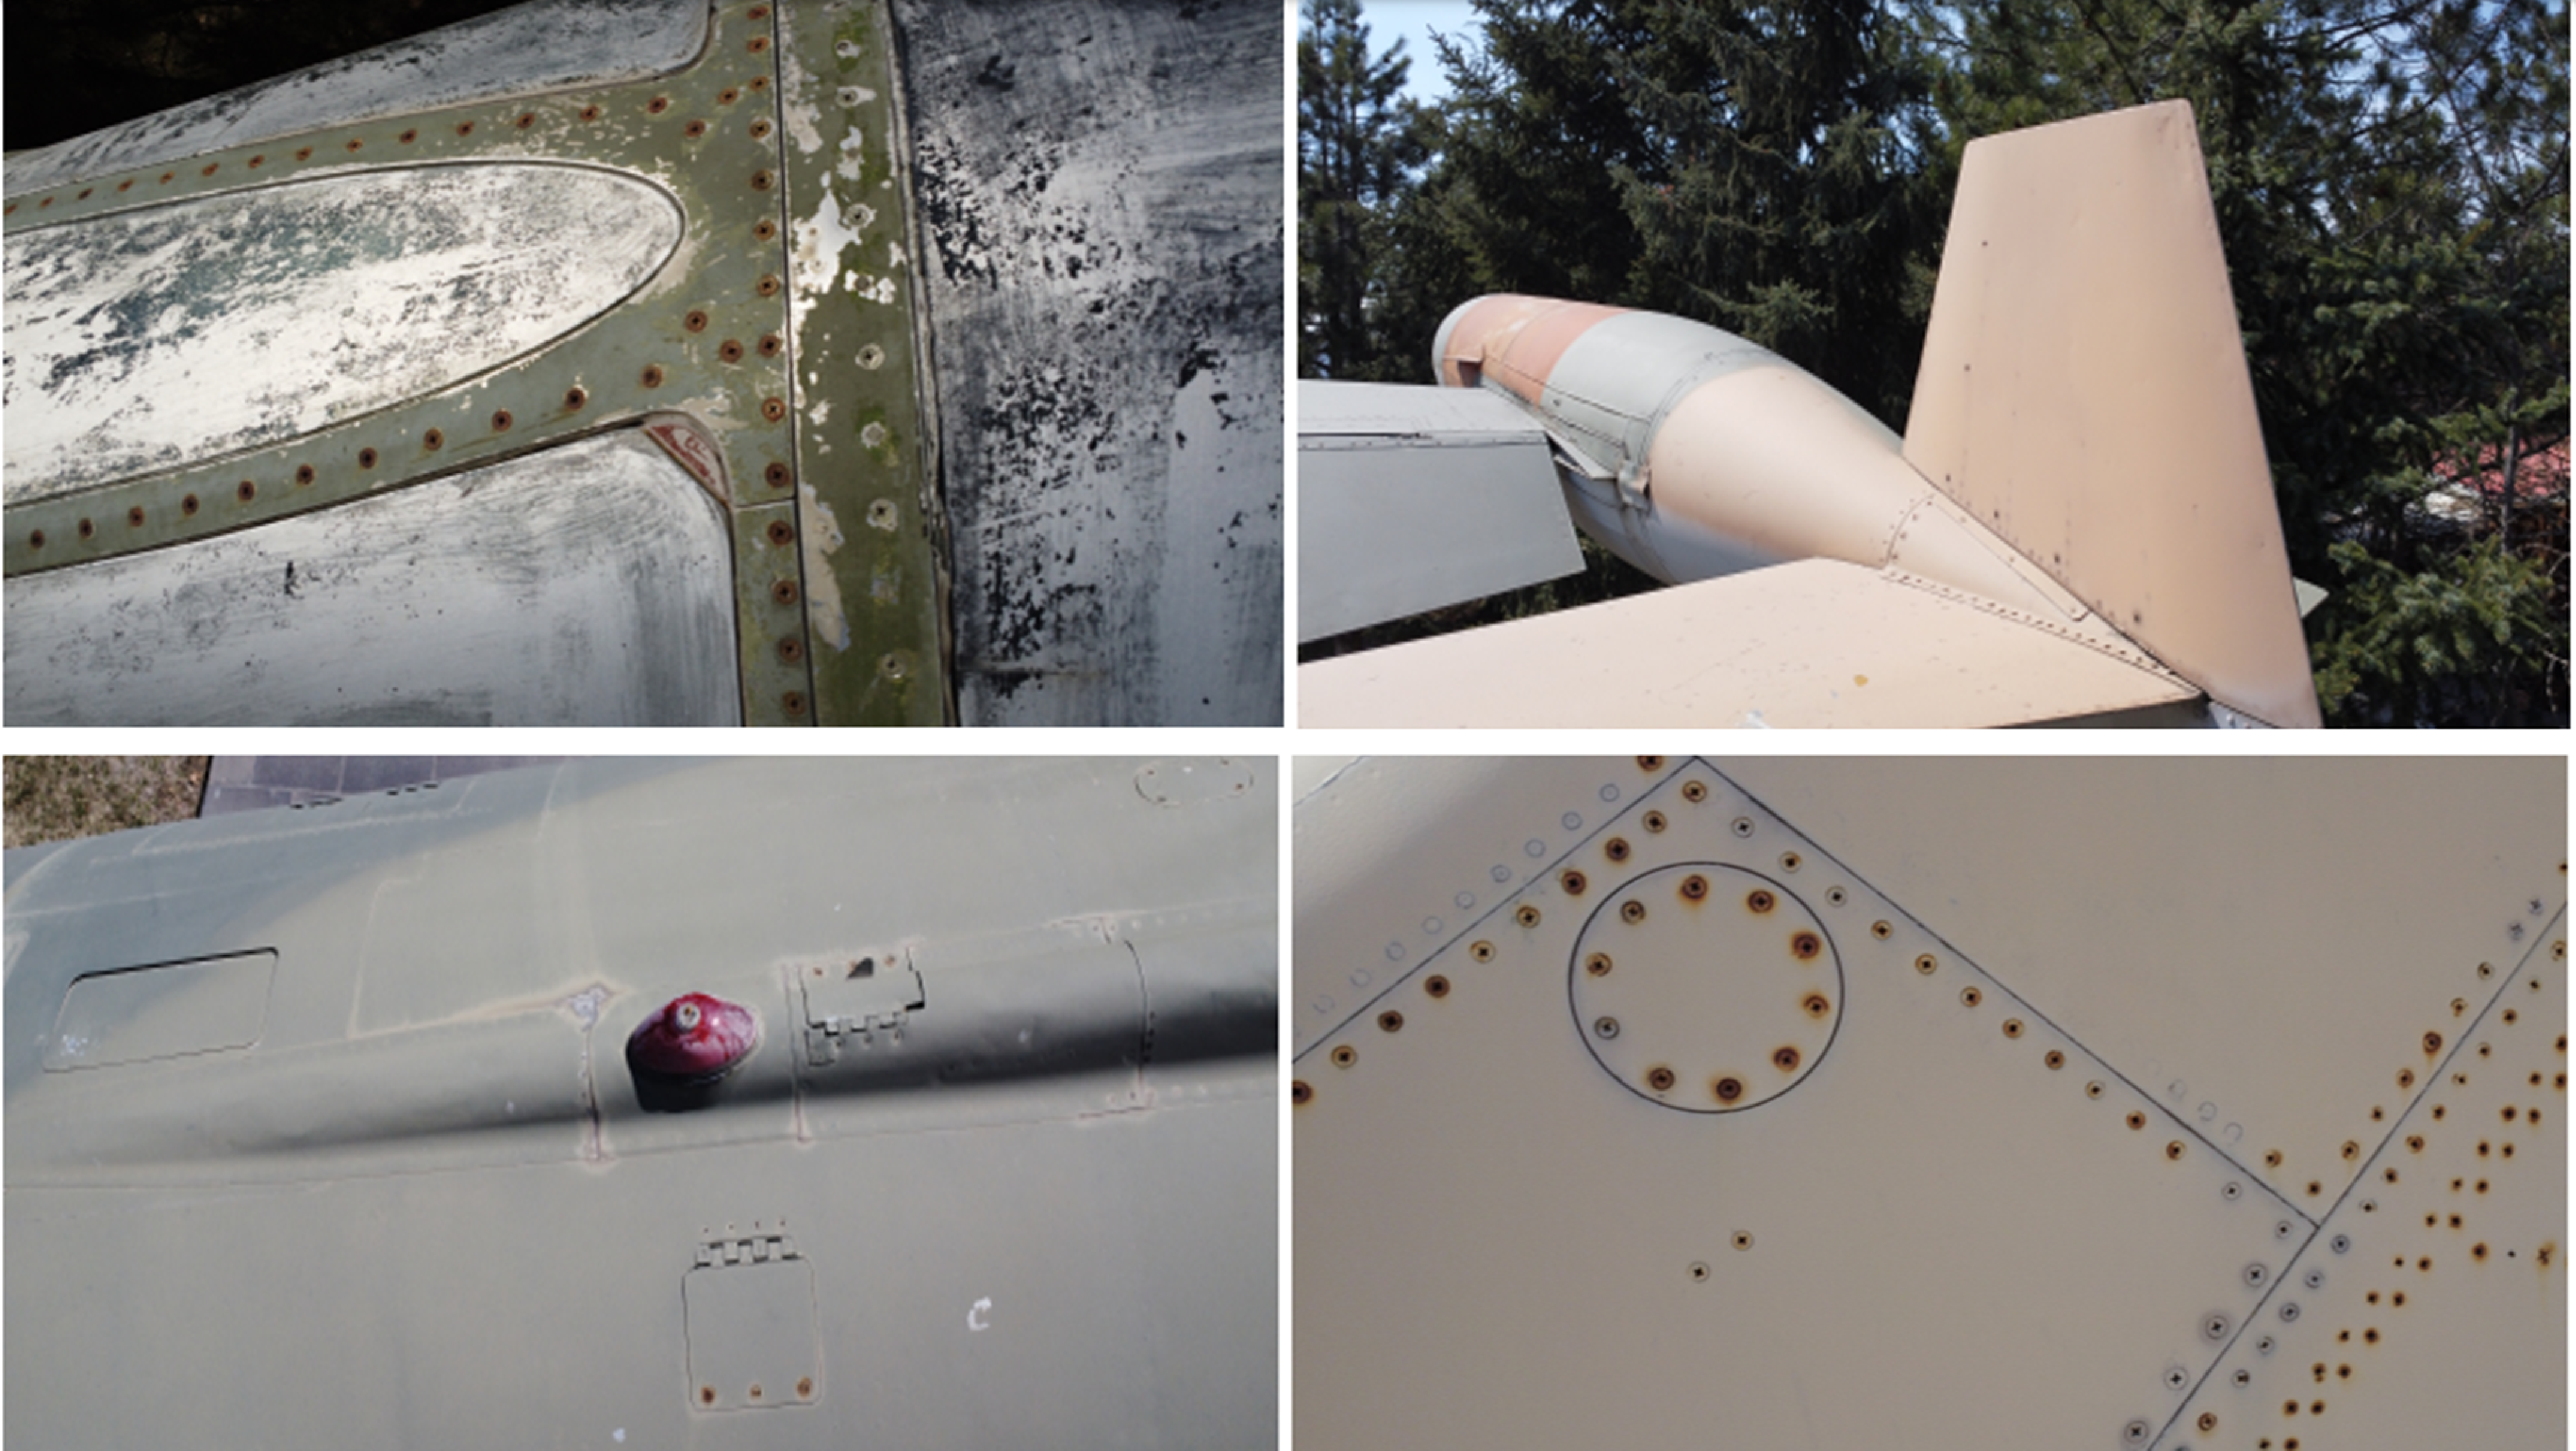
The process of obtaining images of the aircraft’s exterior was successfully completed in spring, summer and autumn. However, in winter, adverse weather conditions such as strong winds, rain and dense fog prevented the successful completion of UAV-based image acquisition. Figure 3(a) shows the process of obtaining images of the exterior surface of the aircraft using a UAV in spring. Figure 3(b) shows the process of obtaining images of the exterior surface of the aircraft using a UAV in summer. The weather conditions in spring and summer are highly suitable for UAV-based image acquisition. Figure 3(c) shows the process of capturing images of the aircraft’s exterior surface with a UAV in autumn, while Fig. 3(d) presents the same process conducted in the evening (between 19:00 and 20:00, Turkey time). Figure 4 presents sample images captured by the UAV from the exterior surface of the aircraft during autumn (temperature: −5 °C, wind speed: 7 km/h, pressure: 827 hPa, humidity: 73%). Despite the harsh conditions of this season, UAV-based image acquisition was successfully carried out. Figure 5 presents sample images captured by a UAV from the exterior surface of the aircraft during spring (temperature: 3 °C, wind speed: 7 km/h, pressure: 829 hPa, humidity: 74%). As the weather conditions were highly favourable during this season, the UAV-based image acquisition process was completed with ease. Figure 6 presents sample images captured by the UAV from the exterior surface of the aircraft during the summer season (temperature: 24 °C, wind speed: 14 km/h, pressure: 887 hPa, humidity: 52%). As the weather conditions were highly favourable during this season, the UAV-based image acquisition process was completed with ease.
UAV-based image acquisition under varying seasonal and environmental conditions.

Figure 3 Long description
The image consists of four separate photos. The first photo shows a small unmanned aerial vehicle (UAV) flying in the sky near the wing of a large aircraft. The second photo captures a close-up view of the tail section of an aircraft with a Turkish flag and the number 5103 visible. The third photo displays another UAV flying near the wing of a different aircraft, with a building and trees in the background. The fourth photo presents an aerial view of a model aircraft on the ground, with its wings spread out. These images collectively illustrate the use of UAVs for inspecting aircraft under various conditions.
UAV-captured images of the aircraft exterior in autumn.

Figure 4 Long description
The image consists of four separate photos of an aircraft exterior captured in autumn. The top left photo shows the side of the aircraft with visible wear, including blue paint chipping and small holes. The top right photo focuses on the tail section, which is red with blue paint chipping and a visible logo. The bottom left photo shows the nose of the aircraft with significant paint chipping and cracks. The bottom right photo displays the underside of the aircraft's wing, also showing signs of wear and blue paint chipping.
UAV-captured images of the aircraft exterior in spring.

Figure 5 Long description
The image consists of four separate photos of an aircraft exterior captured by a UAV in spring. Each photo focuses on different sections of the aircraft, highlighting areas with blue markings and visible defects. The markings and defects are likely part of a maintenance inspection process to identify and address potential issues early. The photos are arranged in a 2x2 grid, showing various angles and parts of the aircraft's exterior.
UAV-captured images of the aircraft exterior in summer.

Figure 6 Long description
The image consists of four separate photos of an aircraft exterior captured by a UAV. The top left photo shows a close-up of the aircraft's surface with visible signs of wear, including peeling paint and small holes. The top right photo displays the aircraft's tail section, highlighting the vertical stabilizer and part of the fuselage. The bottom left photo focuses on a small, red object attached to the aircraft's surface, possibly indicating a maintenance marker or a defect. The bottom right photo shows another close-up of the aircraft's surface with a circular pattern of small holes and some markings. These images collectively illustrate the importance of visual inspections in identifying and addressing potential defects on aircraft surfaces.
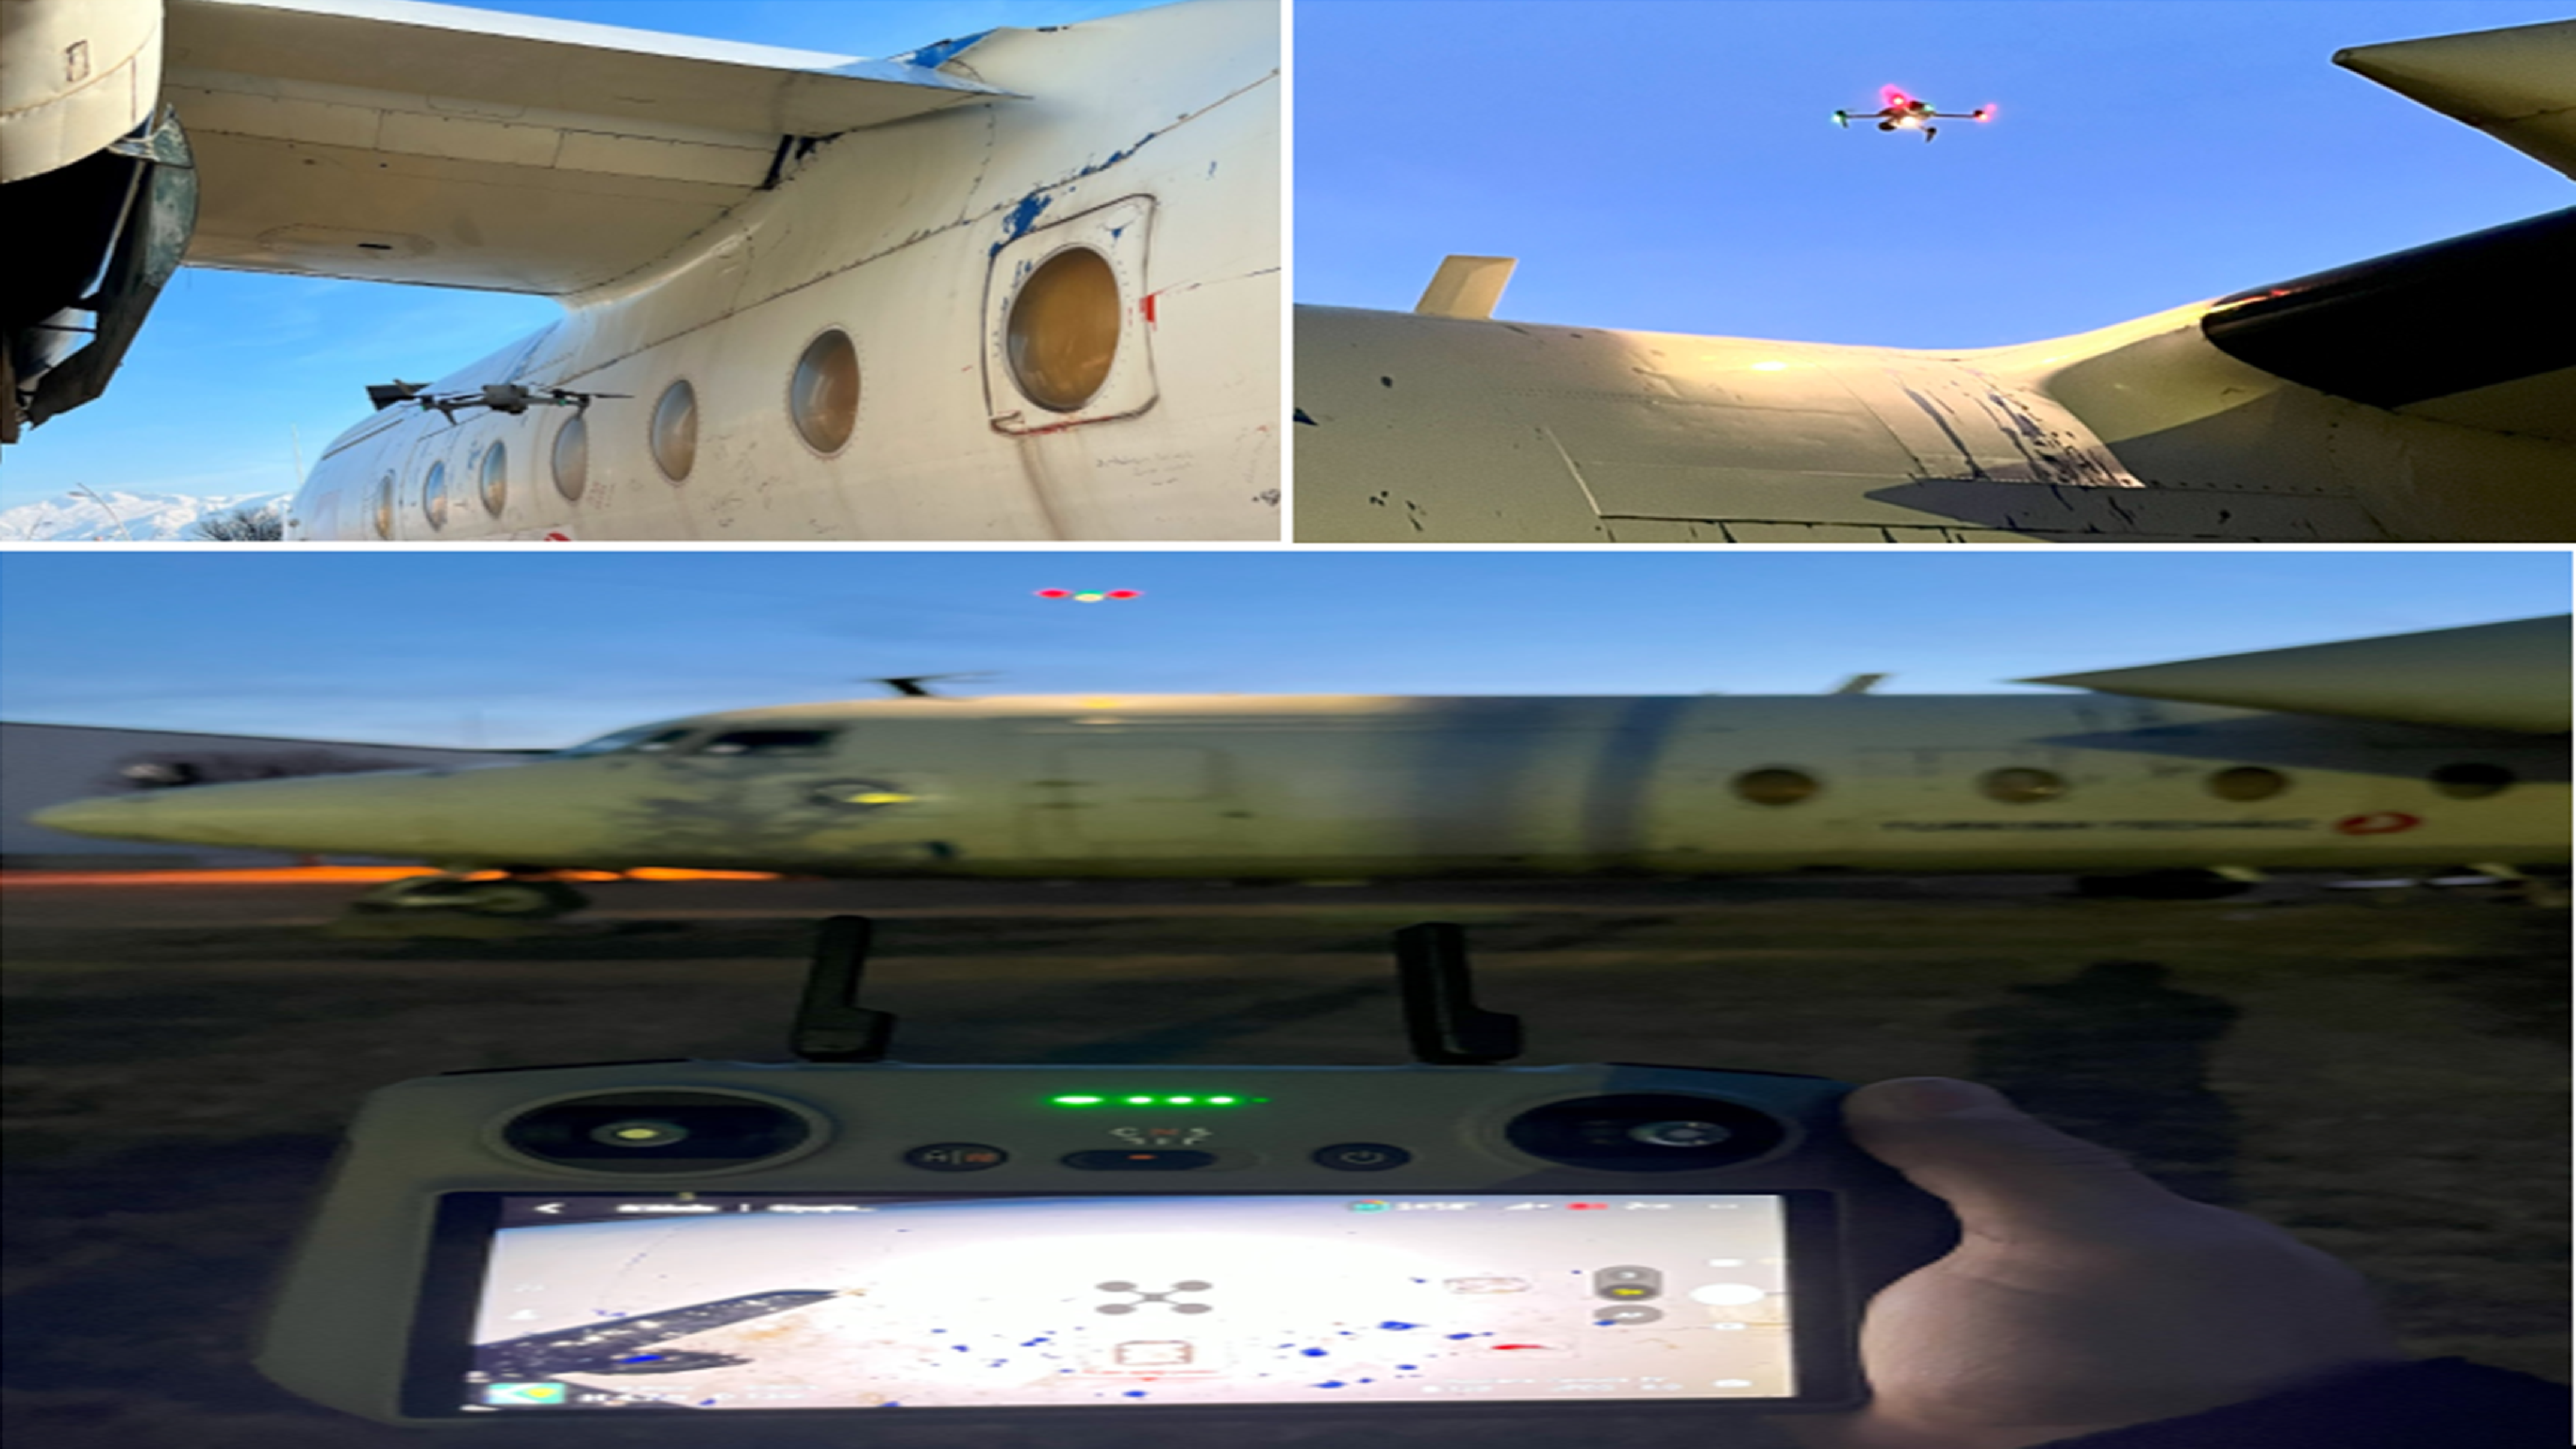
As shown in Fig. 7, the UAV is capable of manoeuvring effectively in narrow, confined areas, maintaining flight stability under moderate wind conditions and capturing clear images even in low-light environments, thanks to its integrated lighting system. These capabilities highlight the UAV’s ability to operate reliably under challenging conditions.
UAV-based image acquisition under difficult conditions.

Figure 7 Long description
The image consists of three separate photos. The first photo shows a close-up view of an aircraft's wing and fuselage, highlighting a circular inspection port. The second photo captures a drone flying above the aircraft, indicating an aerial inspection. The third photo displays a person holding a controller with a screen showing the drone's live feed, demonstrating the remote operation of the drone. The images together illustrate the use of unmanned aerial vehicles (UAVs) for aircraft maintenance inspections under challenging conditions.
The data collected during the UAV-based image acquisition of the aircraft’s exterior surface, which constituted the first phase of this study, were used as input for the image processing phase. In this phase, a pre-constructed dataset containing examples of cracks and corrosion specific to aircraft structures was utilised and detection algorithms were trained and tested accordingly.
3.0 Experimental results
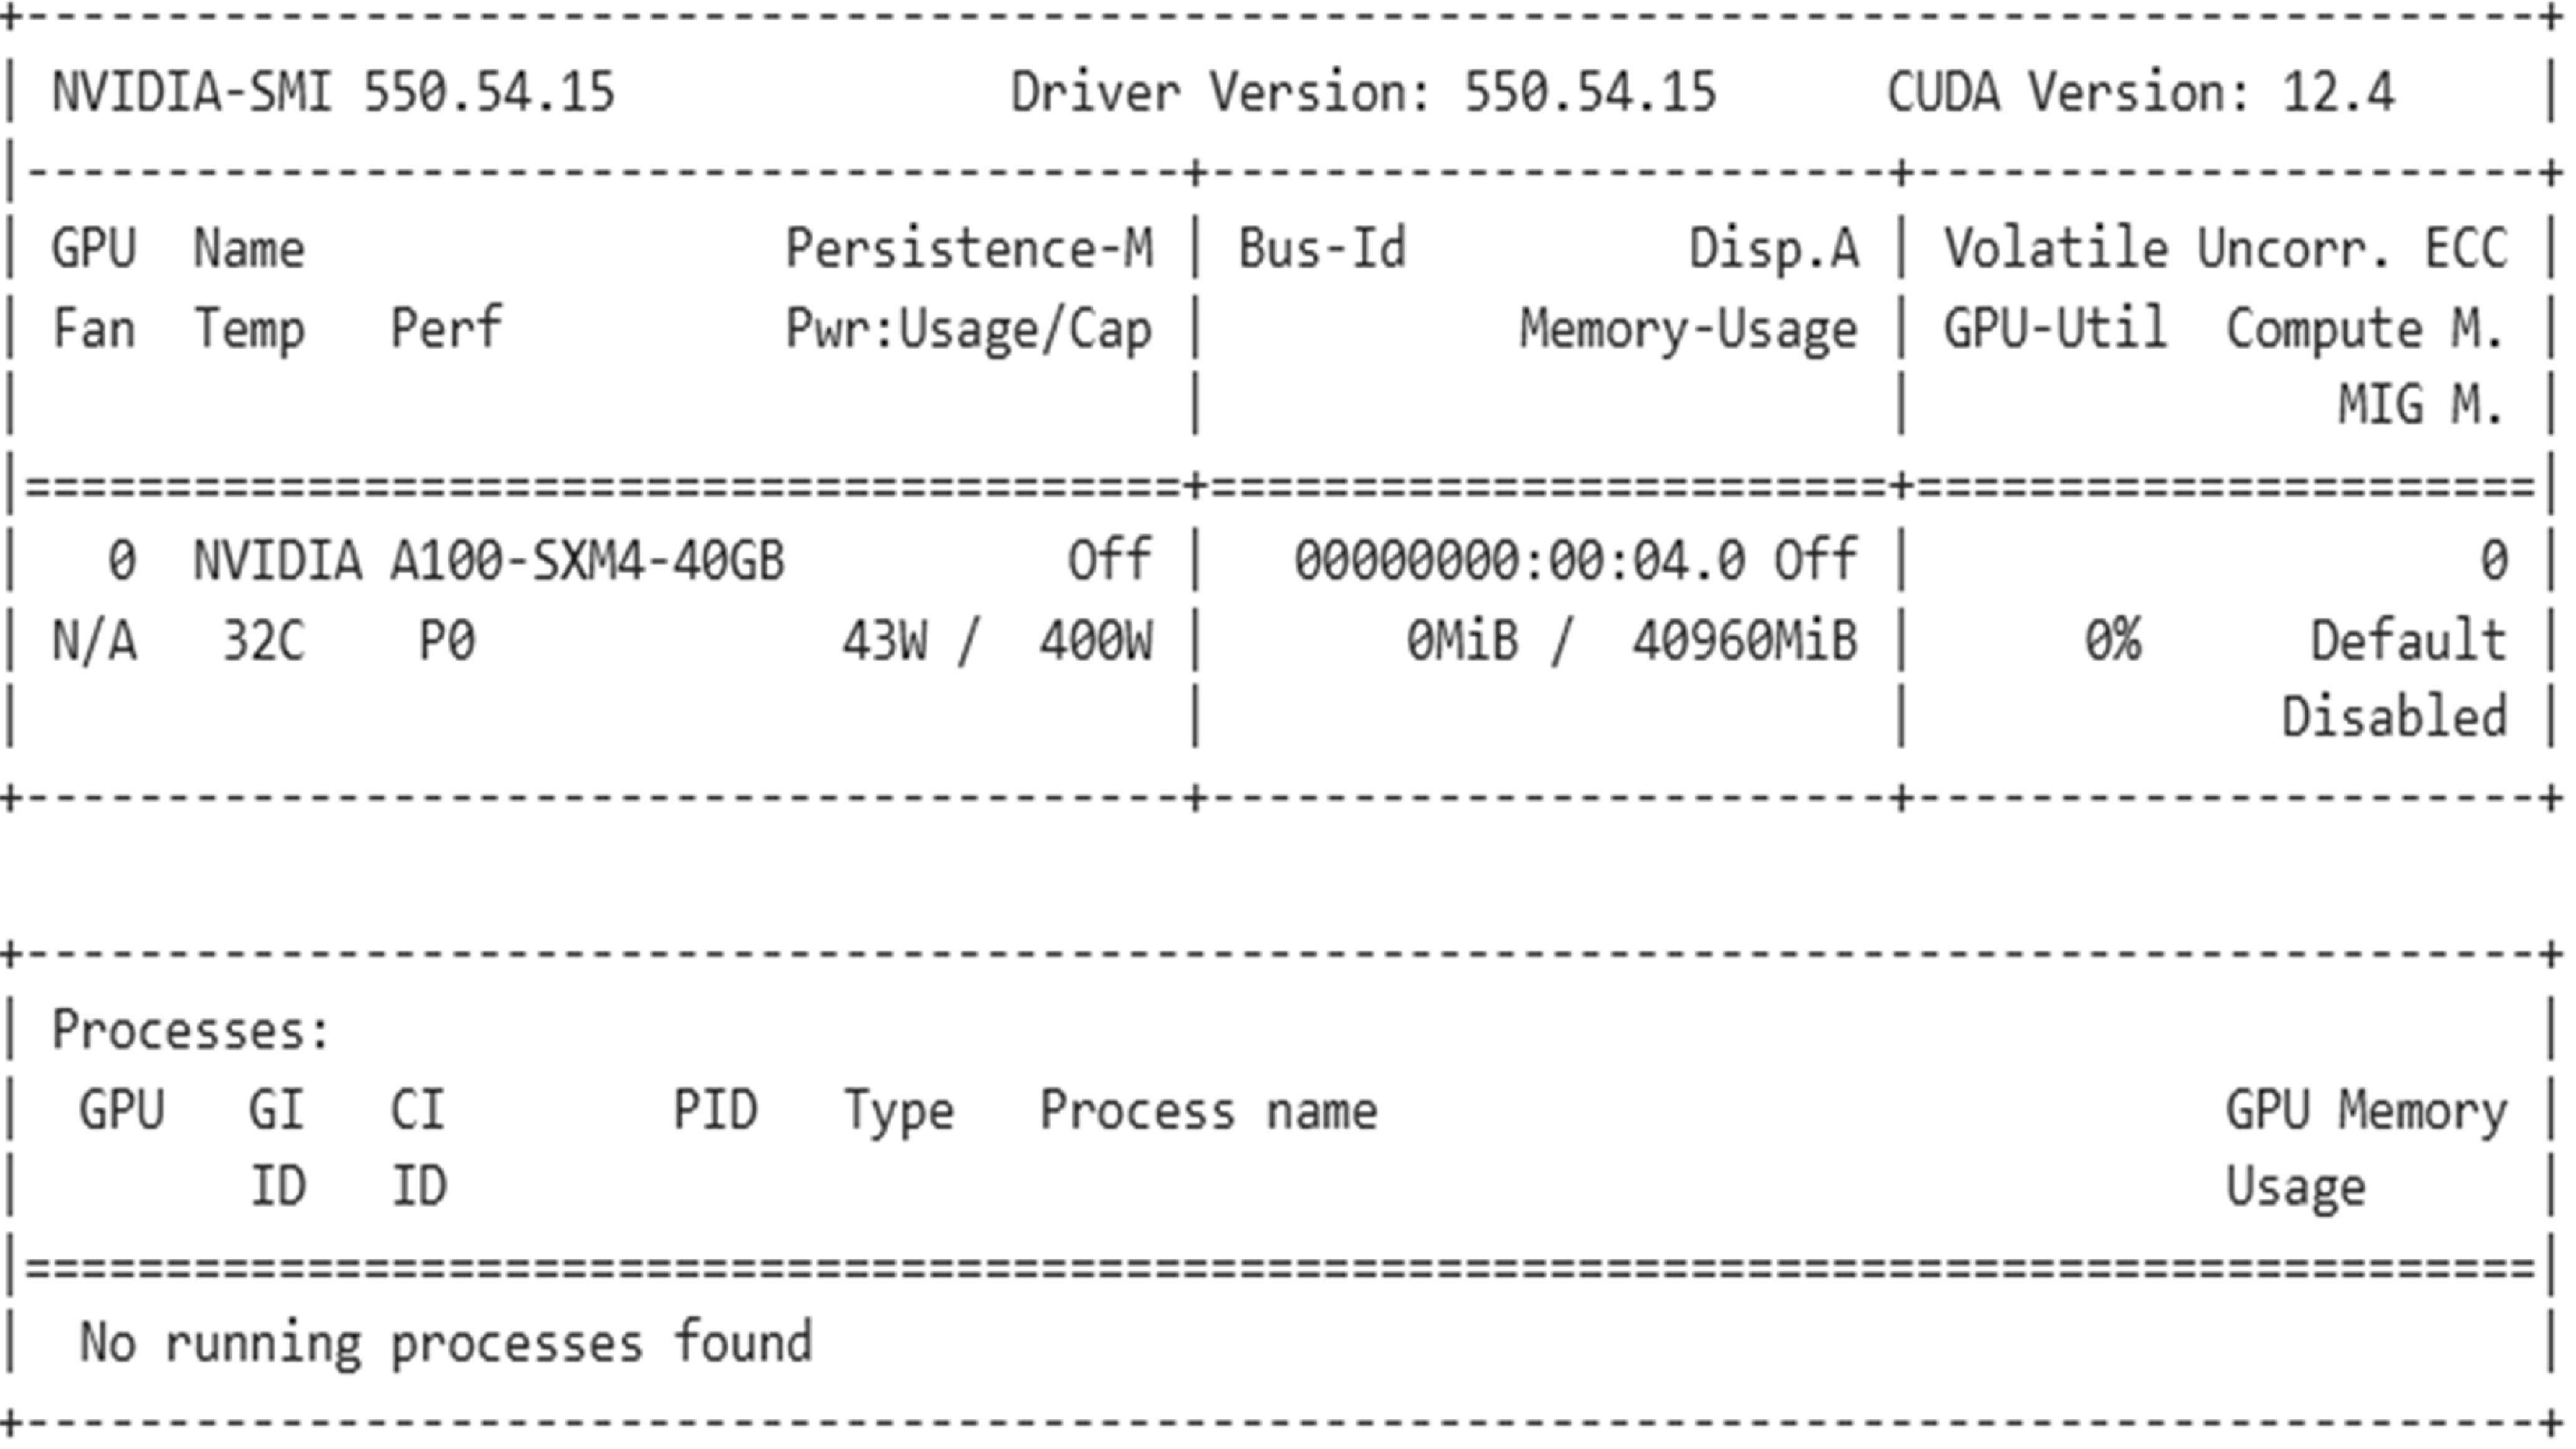
In the second phase of this study, the model trained in the Google Colab environment using the Python programming language was employed. The dataset used in this study consists of a total of 728 photos, including 1,652 instances labeled as ‘crack’ and 1,472 labeled as ‘corrosion’. During the training phase, three different epoch values 115, 165 and 190 were used and separate tests and analyses were conducted for each case. The dataset was trained in the Google Colab environment using an A100 GPU, which offers advantages such as high computing power, large memory capacity, shorter training times and the ability to perform parallel processing. The average training time for each of the three epoch values was approximately 15–20 min. Figure 8 presents the specifications of the A100 GPU used in the Google Colab environment.
Features of the A100 GPU.

Figure 8 Long description
The table provides detailed information about the features of the A100 GPU. It includes columns for GPU name, persistence mode, bus ID, display, volatile uncorrected ECC, fan temperature, performance, power usage, memory usage, and processes. The GPU listed is the NVIDIA A100-SXM4-40GB. The persistence mode is off, the bus ID is 00000000:00:04.0, and the display is off. The volatile uncorrected ECC is disabled. The fan temperature is 32 degrees Celsius, the performance state is P0, and the power usage is 43 watts out of a 400-watt capacity. The memory usage is 0 MiB out of 40960 MiB, and the GPU utilization is 0 percent. The compute mode is set to default. There are no running processes found.
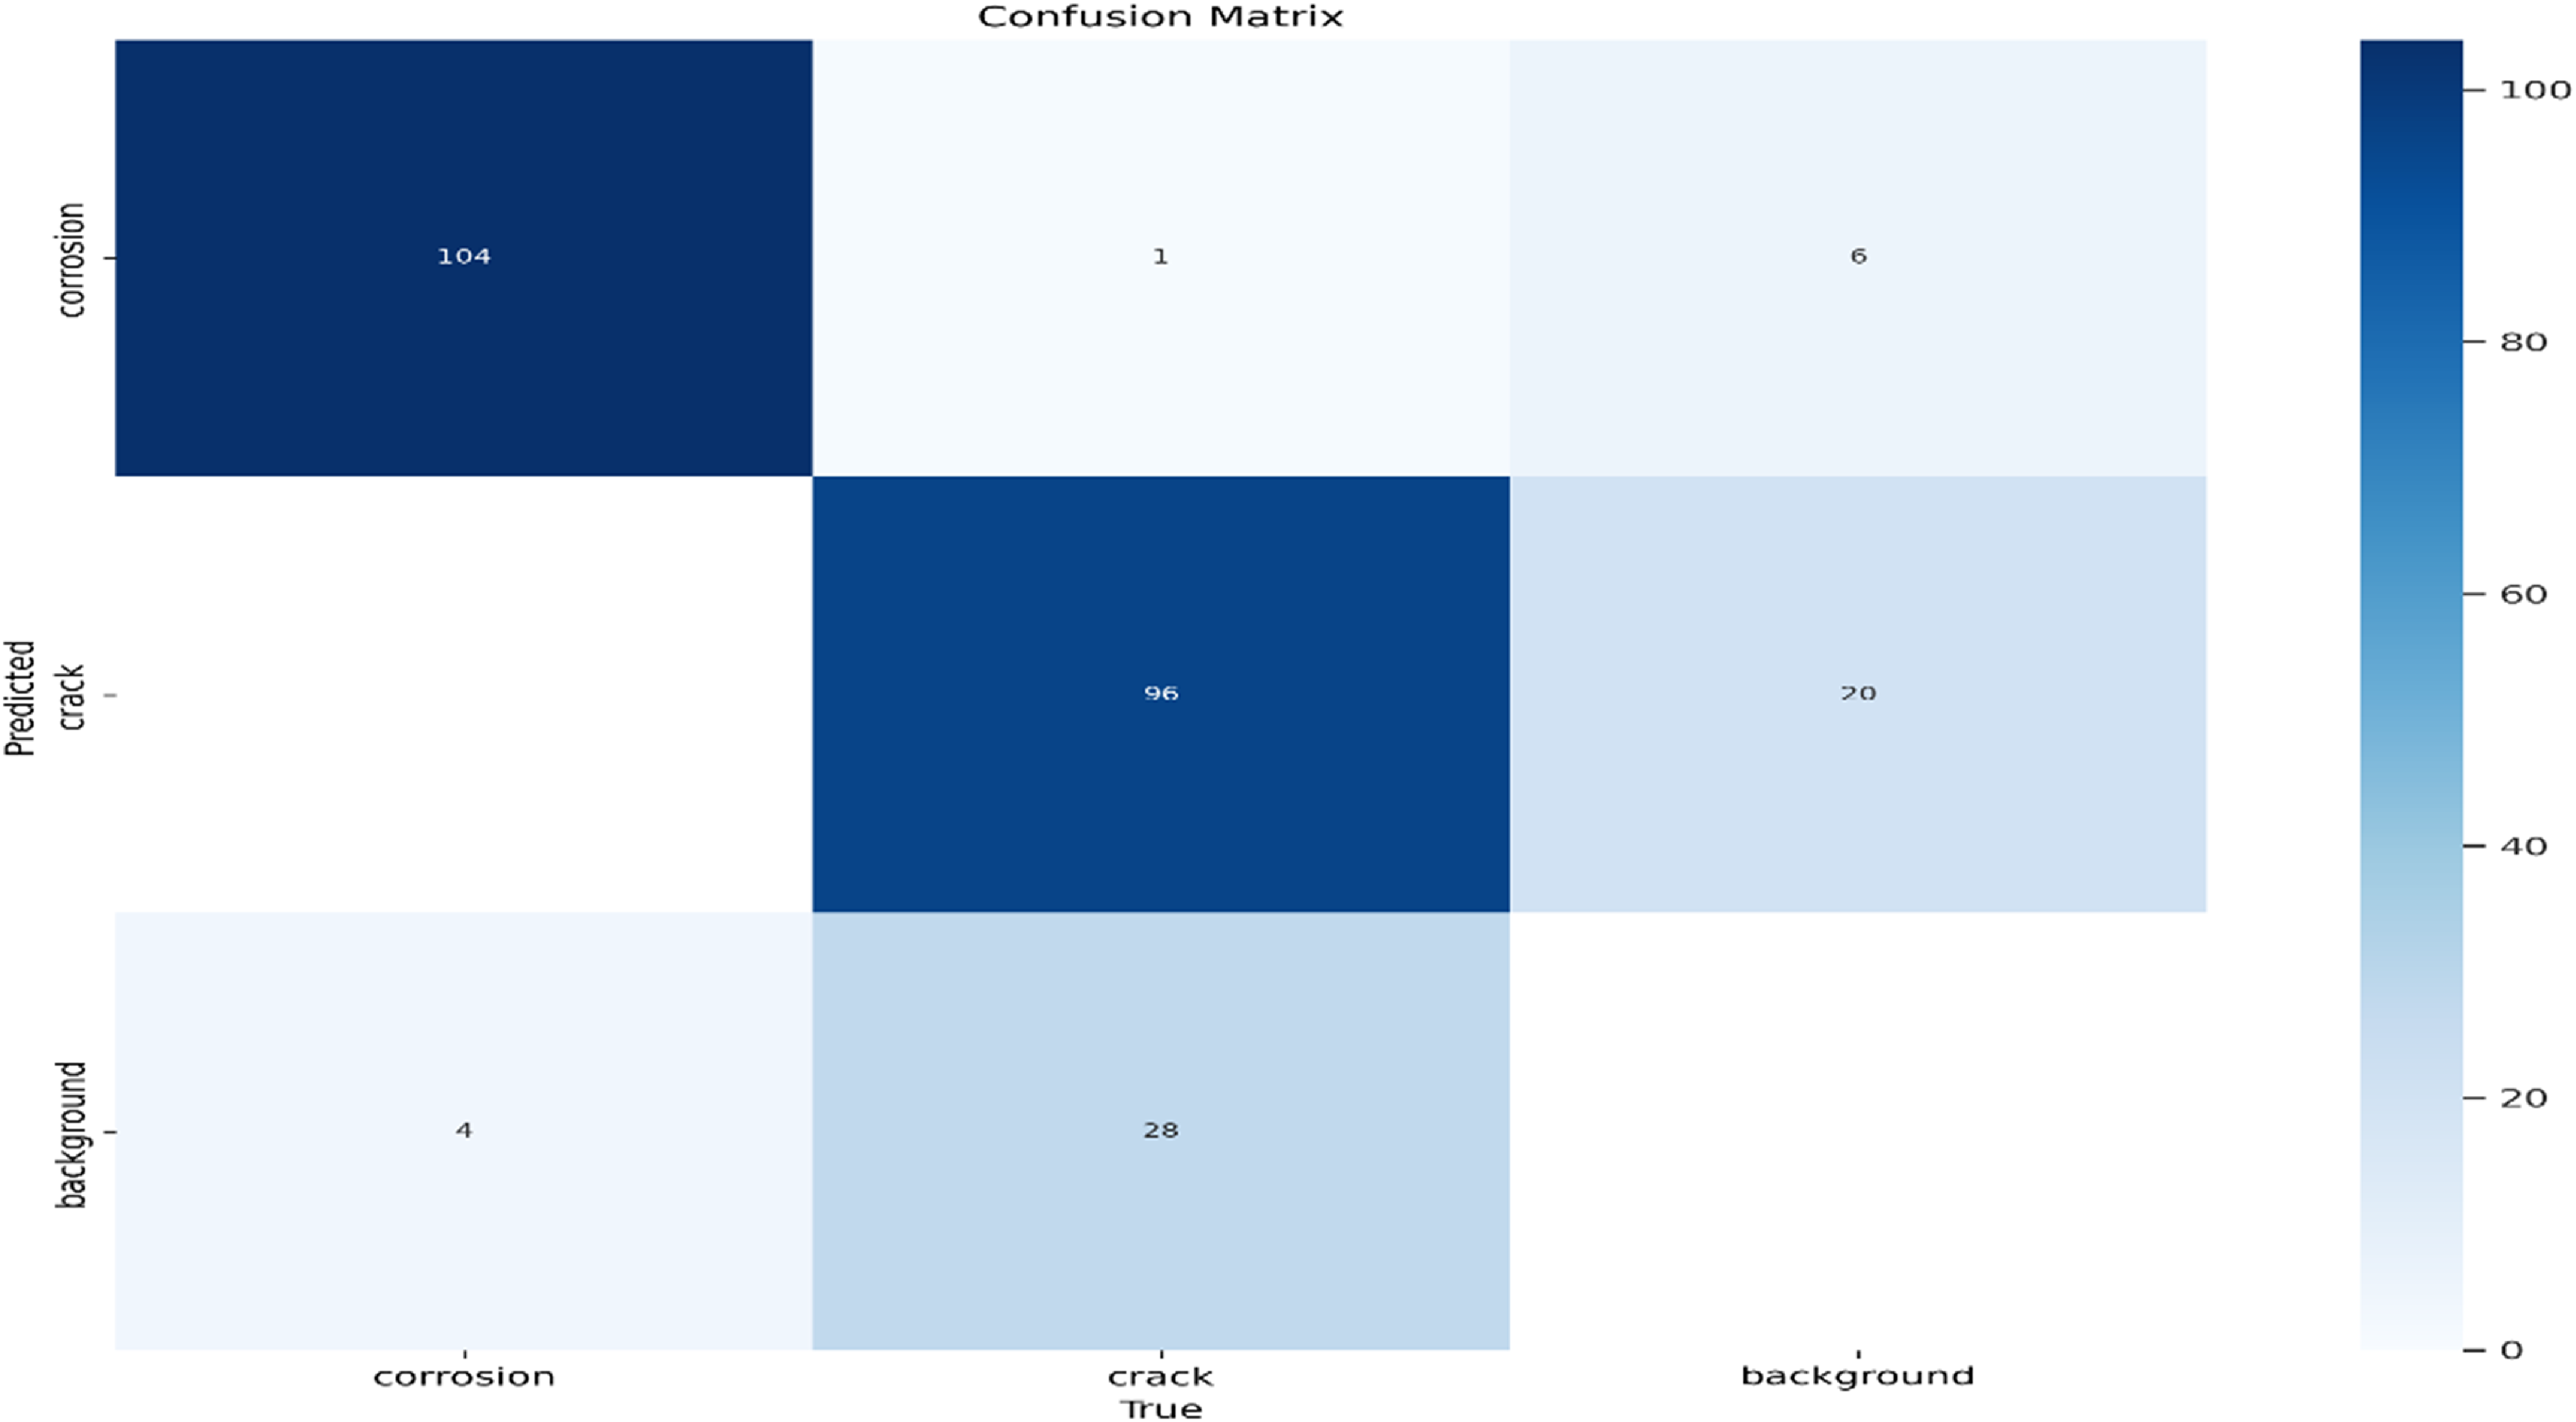
In this study, model training was performed using three different epoch values: 115, 165 and 190. Separate tests and analyses were carried out for each value. The highest recall value for the All class (0.848) was achieved with the model trained using epoch 115. The confusion matrix resulting from this training is presented in Fig. 9, while the loss functions and evaluation metrics recorded during the training process with epoch 115 are shown in Fig. 10.
Confusion matrix graph obtained as a result of training conducted with epoch 115.

Figure 9 Long description
A heat map displays a confusion matrix with three categories: corrosion, crack, and background. The matrix is a 3x3 grid with predicted values on the vertical axis and true values on the horizontal axis. The color scale ranges from light blue to dark blue, indicating the frequency of predictions, with darker colors representing higher values. The highest values are observed in the diagonal cells, indicating correct predictions: 104 for corrosion, 96 for crack, and 28 for background. Off-diagonal cells show misclassifications, with notable values including 20 background predictions classified as crack and 6 crack predictions classified as background. The heat map highlights the performance of a training model with epoch 115, showing areas of high accuracy and specific misclassification patterns.
Loss functions and evaluation metrics recorded during the training process with epoch 115.

Figure 10 Long description
The line graph displays loss functions and evaluation metrics recorded during the training process with epoch 115. The graph includes multiple subplots: train/box_loss, train/cls_loss, train/dfl_loss, metrics/precision(B), metrics/recall(B), val/box_loss, val/cls_loss, val/dfl_loss, metrics/mAP50(B), and metrics/mAP50-95(B). Each subplot shows a trend over 115 epochs. The x-axis represents the number of epochs, while the y-axis represents the respective loss or metric values. The data points are plotted with blue markers connected by lines, and a smooth trend line is also shown. All values are approximated.
Figure 9 illustrates the prediction accuracy of the model trained with epoch 115 across three classes: corrosion, crack and background. Visual analysis reveals that the model performs with high accuracy in identifying the corrosion class. Out of 111 actual corrosion instances, 104 were correctly classified, while 1 was misclassified as crack and 6 as background. This indicates a strong capability of the model in distinguishing the corrosion class. For the crack class, 96 correct predictions were made, whereas 20 instances were incorrectly classified as background.
The graphs in Fig. 10 illustrate the progression of loss values and performance metrics throughout the model’s training process. Both training (train) and validation (val) losses – namely Bounding Box Loss, Classification Loss and Distribution Focal Loss – decreased steadily, indicating consistent learning and the absence of overfitting. In terms of performance, the model achieved a precision of approximately 0.9 and a recall of around 0.85, suggesting high accuracy in identifying correct objects and a low miss rate. The average accuracy metrics, mAP50 (∼0.9) and mAP50–95 (∼0.67), are also notably high, confirming the model’s overall strong detection performance.
The highest mAP50–95 value for the All class (0.702) was achieved during the training conducted with epoch 165. The confusion matrix resulting from this training is presented in Fig. 11, while the loss functions and evaluation metrics recorded during the same training process are shown in Fig. 12.
Confusion matrix graph obtained as a result of training conducted with epoch 165.

Figure 11 Long description
A heat map displays a confusion matrix with three categories: corrosion, crack, and background. The matrix is a 3x3 grid with values indicating the number of correct and incorrect classifications. The color intensity ranges from light blue to dark blue, representing values from 0 to 100. The highest values are in the diagonal cells, indicating correct classifications: 102 for corrosion, 94 for crack, and 31 for background. Off-diagonal cells show misclassifications, with values such as 8 and 10 for crack and background misclassified as corrosion, and 6 for background misclassified as corrosion. The heat map visually represents the performance of a training model with epoch 165, highlighting areas of accurate and inaccurate defect detection.
Loss functions and evaluation metrics recorded during the training process with epoch 165.

Figure 12 Long description
The line graph displays various loss functions and evaluation metrics recorded during the training process with epoch 165. The x-axis represents the number of epochs, ranging from 0 to 165. The y-axis measures the values of different metrics. The graph includes multiple subplots: train/box_loss, train/cls_loss, train/dfl_loss, metrics/precision(B), metrics/recall(B), val/box_loss, val/cls_loss, val/dfl_loss, metrics/mAP50(B), and metrics/mAP50-95(B). Each subplot shows a distinct trend over the epochs. For example, the train/box_loss, train/cls_loss, and train/dfl_loss subplots show a decreasing trend, indicating a reduction in loss over time. The metrics/precision(B) and metrics/recall(B) subplots show an increasing trend, indicating improvement in precision and recall. The val/box_loss, val/cls_loss, and val/dfl_loss subplots also show a decreasing trend, similar to the training loss functions. The metrics/mAP50(B) and metrics/mAP50-95(B) subplots show an increasing trend, indicating improvement in mean average precision. All values are approximated.
Figure 11 displays the prediction accuracy of the model trained with epoch 165 across three classes: corrosion, crack and background. As shown in the matrix, the model accurately classified 102 out of 110 actual corrosion instances. Similarly, for the crack class, 94 out of 104 examples were correctly identified, while 10 were misclassified as background.
The graphs in Fig. 12 present the loss values and performance metrics recorded during the model’s training process. Both training and validation losses (box, cls and dfl) show a steady decline, indicating consistent learning without signs of overfitting. In terms of performance metrics, precision stabilised around 0.9 and recall around 0.85. The mAP50 value reached approximately 0.9, while mAP50–95 increased to about 0.70, demonstrating that the model maintains a robust structure in terms of overall accuracy and detection performance.
The highest precision value for the All class (0.931) was achieved during the training conducted with epoch 190. The confusion matrix resulting from this training is presented in Fig. 13, while the loss functions and evaluation metrics recorded during the same process are shown in Fig. 14.
Figure 13 illustrates the prediction accuracy of the model trained with epoch 190 for the corrosion, crack and background classes. According to the data, the model showed strong performance in the corrosion class, correctly predicting 101 out of 117 actual corrosion instances. Of the remaining, seven were misclassified as background and nine as crack. For the crack class, 96 correct predictions were made, while 29 instances were misclassified as background. Additionally, 16 background instances were incorrectly classified as crack, indicating some confusion between these two classes.
Confusion matrix graph obtained as a result of training conducted with epoch 190.

Figure 13 Long description
A heat map displays a confusion matrix with three categories: corrosion, crack, and background. The matrix is a 3x3 grid with predicted labels on the vertical axis and true labels on the horizontal axis. The color scale ranges from light blue to dark blue, indicating values from 0 to 100. The highest values are in the diagonal cells, with 101 for corrosion, 96 for crack, and 29 for background. Off-diagonal cells show lower values, indicating misclassifications. For example, 9 and 16 are misclassified as background, and 7 and 29 are misclassified as crack.
The graphs in Fig. 14 illustrate the changes in the model’s loss values and performance metrics across epochs during the training process. The box, classification (cls) and distribution focal loss (dfl) values for both training and validation steadily decreased, indicating consistent learning without signs of overfitting. In terms of performance metrics, precision stabilised at approximately 0.93 and recall at 0.81. The mAP50 value reached 0.9, while mAP50–95 reached around 0.70, demonstrating that the model achieved high accuracy and strong overall detection performance.
Loss functions and evaluation metrics recorded during the training process with epoch 190.

Figure 14 Long description
The line graph displays loss functions and evaluation metrics recorded during the training process with epoch 190. The graph includes eight subplots arranged in two rows and four columns. The top row features four subplots labeled train/box_loss, train/cls_loss, train/dfl_loss, and metrics/precision(B), while the bottom row includes val/box_loss, val/cls_loss, val/dfl_loss, metrics/mAP50(B), and metrics/mAP50-95(B). Each subplot shows a line graph with two data series, labeled results and smooth. The x-axis of each subplot represents the number of epochs, ranging from 0 to 190. The y-axis represents different metrics: box_loss ranges from 0 to 1.75, cls_loss from 0 to 2.5, dfl_loss from 0 to 1.8, precision(B) from 0 to 1, recall(B) from 0 to 1, mAP50(B) from 0 to 1, and mAP50-95(B) from 0 to 0.7. The data series show a general trend of decreasing loss values and increasing evaluation metrics over the epochs. All values are approximated.
4.0 Discussion and results
In the third stage of this study, the images captured from the aircraft’s exterior surface using the UAV were tested and analysed with the previously trained model. A confidence threshold of 0.50 was applied during these tests. This threshold defines the minimum confidence level required by the model to consider a detected region as a defect. In this study, a moderate confidence threshold of 0.50 was selected for detecting critical defects such as corrosion and cracks. This value was chosen because lower thresholds may result in a high number of false positives, while higher thresholds may cause the model to only detect instances it is highly confident about, potentially overlooking important but less certain defect regions. The targets examined at this stage included corrosion damage, impact- or friction-induced damage and aircraft panels affected by environmental conditions. In this context, photographs and video footage captured from the aircraft’s exterior surface were tested using the trained model. Figures 15–17 present images of aircraft panels damaged by environmental conditions, along with the corresponding test results produced by the model. Successful detection results were achieved across all three models trained with epochs 115, 165 and 190.
Visual test result of model trained with epoch 115.

Figure 15 Long description
The image displays an aircraft surface with a visual test result from a model trained with epoch 115. The surface is marked with numerous small holes and corrosion spots. The left section shows a close-up of the corrosion patterns, while the right section highlights specific areas with corrosion levels indicated by blue boxes and numerical values. The number 510 is prominently displayed on a plate attached to the surface. The corrosion detection results are visually represented with different levels of severity, aiding in the identification and assessment of potential defects.
Visual test result of the model trained with epoch 165.

Figure 16 Long description
The left image shows a close-up of a cracked surface with visible cracks radiating from a central point. The right image is an annotated version of the left image, highlighting the cracks and corrosion with blue and purple boxes. Each box contains a label indicating the type of defect and a confidence score, such as 'crack 0.93' and 'corrosion 0.89'. The annotations help identify and quantify the defects on the surface.
Visual test result of the model trained with epoch 190.

Figure 17 Long description
The left image shows a circular metal surface with four bolts. The right image highlights areas of corrosion around each bolt with blue boxes and labels indicating corrosion levels. The top bolt has a corrosion level of 0.93, the middle left bolt has a corrosion level of 0.93, the middle right bolt has a corrosion level of 0.91, and the bottom bolt has a corrosion level of 0.93.
Figures 15–17 show that the cracks and corrosion defects in the tested images were accurately detected by all three models trained with epochs 115, 165 and 190. Additionally, the locations of these defects are enclosed within bounding boxes and their corresponding confidence scores are indicated.
Video footage captured from the aircraft’s exterior surface using UAVs was tested and analysed using pre-trained models. During this analysis, the confidence threshold was set to 0.50. The primary objective of this phase is to rapidly and accurately detect damage to aircraft panels caused by mechanical effects such as corrosion, impact, or friction, as well as environmental conditions. Figures 18–20 present the video test results, illustrating the successful detection of panel damage caused by environmental factors. The models used in these tests – trained with epochs 115, 165 and 190 – demonstrated high accuracy and effective performance in damage detection.
Video test result with model trained with epoch 115.

Figure 18 Long description
An aircraft surface displays multiple instances of corrosion, each highlighted with blue boxes and labeled with corresponding confidence scores. The corrosion areas are marked with scores of 0.57, 0.77, 0.65, and 0.54. The image includes a video timestamp at the bottom left corner, indicating '12_03_6', and a play button at the bottom center. The corrosion annotations are distributed across the surface, with varying degrees of severity.
Video test result with model trained with epoch 165.

Figure 19 Long description
The image displays a section of an aircraft surface with two detected cracks. The crack on the left is labeled with a confidence score of 0.54, while the crack on the right has a confidence score of 0.90. The cracks are highlighted with rectangular boxes and labeled accordingly. The background shows a part of the aircraft structure with visible rivets.
Video test result with model trained with epoch 190.

Figure 20 Long description
An image of an aircraft surface displaying two cracks and a section with corrosion. The cracks are highlighted with blue rectangles and labeled with detection scores of 0.67 and 0.87. The corrosion area is marked with a blue rectangle and labeled with a detection score of 0.56. The image includes rivets and structural details typical of an aircraft exterior.
Figures 18–20 show that cracks and corrosion defects in the video footage were accurately detected by all three models trained with epochs 115, 165 and 190. The locations of the detected defects are marked with bounding boxes and their corresponding confidence scores are indicated.
5.0 Conclusions
Maintenance activities performed on aircraft play a vital role in ensuring operational safety, preserving structural integrity and optimising the aircraft’s economic lifespan. Even minor defects can lead to serious consequences; therefore, early detection is essential for preventing potential failures. In this context, routine inspections are conducted before and after flights, alongside scheduled maintenance activities performed at defined intervals. When necessary, corrective actions are taken to identify and repair faults. The continued airworthiness and efficient operation of aircraft can only be ensured through regular and meticulous maintenance procedures.
Today, various types of ground support equipment are used to access areas of the aircraft during traditional visual inspections. This equipment includes ladders, forklifts, maintenance platforms, wing stands and tail stands. However, such physical access methods present challenges in terms of time and cost efficiency and also pose significant risks to the health and safety of maintenance personnel. For this reason, maintenance personnel are required to use additional safety equipment – such as safety harnesses, ropes and hard hats – alongside standard personal protective equipment. This leads to extended operational durations and increased demand for both manpower and logistical resources. In particular, preparing the hangar for maintenance operations, positioning the necessary equipment and ensuring accessible aircraft surfaces for inspection introduce considerable time and cost burdens within aircraft maintenance processes. In this context, the integration of UAVs into aircraft maintenance processes is gaining attention as a promising alternative to traditional methods. UAVs enable rapid, safe and effective inspection of aircraft surface areas that are otherwise difficult to access. Visual inspection systems integrated with UAVs provide high accuracy, precision and repeatability in detecting defects such as corrosion and cracks, thereby improving the overall quality of inspection processes. Moreover, this technological approach is expected to reduce human error and increase operational efficiency by minimising the number of technicians required for maintenance tasks.
This study explores the effective use of UAVs in the inspection of aircraft exteriors and structural integrity analysis and proposes a system that supports the digitisation and automation of maintenance processes. For the development of the AI-based system, a dataset was created using diverse visual data in the Roboflow environment and a model was trained on the Google Colab platform using the Python programming language with varying epoch values. Image processing techniques and deep learning algorithms were employed in the development of the model and its accuracy, performance and practical applicability were thoroughly evaluated. Among the training iterations, the highest overall accuracy metrics (all mAP50 = 0.883 and all mAP50–95 = 0.702) were achieved at epoch 165. These results indicate a strong and reliable model performance [67]. This result indicates that epoch 165 represents the stage at which the model achieves the best overall performance across all classes. The findings confirm that images collected via UAVs can be effectively used for the automated detection of defects on aircraft surfaces, offering a more efficient, safer and cost-effective alternative to traditional visual inspection methods. The defect detection capability of UAV-based systems is naturally limited by factors such as camera resolution, inspection distance and environmental conditions. Although the DJI Air 3 is equipped with dual 1/1.3″ CMOS sensors capable of capturing images at 48 MP (8064 × 6048 pixels), the actual ground sampling distance (GSD) depends on the flight distance. During image acquisition, the UAV was flown approximately 2–4 metres from the aircraft surface, depending on the area being inspected. This distance range enabled both detailed close-up shots and wide-angle views, making it possible to identify even small defects clearly. However, detection performance in real-world conditions may be adversely affected by factors such as insufficient lighting, UAV movement caused by wind, reflective surface glare, or the indistinct nature of corrosion and crack patterns. Therefore, the results obtained should be evaluated with these operational limitations in mind. Future deployment of higher-resolution cameras and controlled-distance tests may help determine the minimum detectable defect size with greater precision. Furthermore, testing the applicability of the developed system within maintenance hangars is essential for assessing its real-world compatibility. This study focuses on the automated detection of corrosion and cracks on aircraft surfaces using UAV-supported image processing methods, presenting a novel approach to the digitalisation of aircraft maintenance and the reduction of human error. The model evaluation across different epoch values, along with findings obtained using an appropriate confidence threshold, demonstrates a more practical and comprehensive methodology compared to similar studies.
Acknowledgements
This study was supported by Erciyes University Scientific Research Projects Coordination. The unit is under grant number code FDK-2025-14533. The testing and analysis stages were carried out using financial resources provided under this project.
Data availability statement
The data that support the findings of this study are available from the corresponding author upon reasonable request.
Competing interests
The authors declare that there is no conflict of interest regarding the publication of this paper.