


Impact Statement
Green hydrogen produced from renewable electricity is essential for decarbonizing hard-to-abate sectors. Proton exchange membrane water electrolyzer (PEMWE) represents the leading technology for efficient hydrogen production, yet its widespread deployment is severely constrained by the prohibitive cost and scarcity of noble Ir-based anode catalysts. With Ir prices exceeding US$140 g−1 and global PEMWE capacity needing to reach hundreds of gigawatts by 2030, this bottleneck becomes increasingly critical. Ru offers a cost-effective alternative at approximately US$16 g−1, but conventional RuO2 catalysts suffer from rapid dissolution and deactivation under acidic oxidizing conditions, as induced by the lattice-oxygen-mediated degradation pathway. Herein, oxophilic Mo atoms were atomically dispersed in the oxygen-vacancy-enriched RuO2 lattice (Mo–RuO2-x) through a molten salt treatment, thereby constructing oxygen-vacancy-shortened Ru–Mo dual sites that are responsible for the improved acidic oxygen evolution reaction (OER). The Mo–RuO2-x electrocatalyst delivers a low overpotential of 191 mV at 10 mA cm−2 for acidic OER and maintains durable operation for over 500 h. More remarkably, a PEMWE assembled with Mo–RuO2-x as the anode sustains 500 h operation at 1 A cm−2, with a cell voltage of only 1.63 V. Experimental characterizations and theoretical calculations together reveal that the oxygen-vacancy-shortened Ru–Mo dual sites efficiently activate the oxide path mechanism (OPM). The oxophilic Mo possesses a higher d-band center than Ru, which favors the adsorption of O* intermediates and accelerates the *OO* coupling process, thus enhancing the acidic OER performance. This work demonstrates an alternative approach for regulating the OPM at dual sites via lattice and oxophilicity engineering, providing guidance for the design of Ru-based electrocatalysts toward industrial-level PEMWE.
1. Introduction
Water electrolysis powered by renewable energy sources (e.g., solar, wind) represents a technologically viable pathway for green hydrogen production and plays a critical role in achieving global carbon neutrality [Reference Turner1, Reference Staffell, Scamman and Velazquez Abad2, Reference Zhao, Wang and Dong3]. Among the available water electrolysis technologies, proton exchange membrane water electrolyzer (PEMWE) stands out for industrial application, due to the large current density (1–2 A cm−2), high energy efficiency (>85%), and rapid dynamic response (<5 s) [Reference Liu, Xu and Li4, Reference Seh, Kibsgaard and Dickens5]. However, the harsh acidic operation conditions and sluggish anodic oxygen evolution reaction (OER) kinetics in PEMWE significantly accelerate the corrosion and dissolution of electrocatalysts, which directly limit the widespread development [Reference Wang, Cheng and Tao6, Reference Deng, Dong and Huang7]. Although the utilization of noble Ir-based electrocatalysts can offer remarkable corrosion resistance and high OER performance, the high price of Ir (~US$140 gIr−1) severely hampers large-scale applications [Reference Wu, Chang and Yu8]. In comparison, Ru-based electrocatalysts exhibit better catalytic activity and lower prices (~US$16 gRu−1) [Reference Wu, Chang and Yu8] has been considered a promising alternative for acidic OER electrocatalysts. Nevertheless, the OER pathway happening on Ru-based electrocatalysts usually follows the lattice-oxygen-mediated mechanism (LOM) [Reference Mu, Fan and Gao9, Reference Zhou, Li and Dong10], with the participation of lattice oxygen in electrocatalysts for acidic OER, which induces the over-oxidation of Ru sites and then the formation of soluble high-valence Ru species, resulting in the deactivation of Ru-based electrocatalysts [Reference Hu, Huang and Sun11, Reference Liu, Zhang and Fang12]. Thus, significant efforts have been devoted to steering the OER pathway of Ru-based electrocatalysts for enhanced OER stability toward practical application of PEMWE.
The adsorbate evolution mechanism (AEM) happening at the metallic active sites of electrocatalysts has been demonstrated with long-term stability for acidic OER [Reference Yang, Guo and Xu13]. However, the AEM pathway is limited by the scaling relationship between the adsorption energies of OH* and OOH* intermediates, with a theoretical minimum overpotential of ca. 370 ± 100 mV [Reference Song, Wei and Huang14, Reference Rossmeisl, Qu, Zhu, Kroes and Nørskov15]. Recently, the oxide path mechanism (OPM) has been proposed and verified to break the scaling relationship in the AEM without sacrificing OER stability [Reference Lin, Li and Li16], which is believed to be determined by the Ru–Ru interatomic distance of Ru-based electrocatalysts [Reference Yin, Liu, Hu and Wang17]. It was revealed that the shortened Ru–Ru interatomic distance allows the direct oxygen–oxygen radical (*OO*) coupling for activating OPM, bypassing the generation of OOH* intermediates to break the AEM limitation [Reference Rong, Huang and Arandiyan18]. In general, shortening the Ru–Ru interatomic distance and activating the OPM could be achieved by constructing oxygen vacancies in RuO2 [Reference Mu, Fan and Gao9, Reference Yang, Zheng and Jin19]. For instance, by introducing oxygen vacancies in amorphous RuOx, the Ru–Ru interatomic distance was slightly reduced in RuOx as compared to RuO2, and thus triggering the OPM happened on RuOx, with a current density of 10 mA cm−2 reached for acidic OER at a small overpotential of 215 mV [Reference Mu, Fan and Gao9]. Incorporating heteroatoms with small atomic radii to build asymmetric Ru–M (M: heteroatoms) dual sites has also been considered an efficient strategy for triggering OPM [Reference Zhang, Zhu and Wen20–Reference Cao, Qin, Zhang, Chen and Jiao25]. For example, by incorporating Ga single atoms into RuO2 lattices, the obtained Ga0.2Ru0.8O2 exhibited a significantly decreased interatomic distance between Ru and Ga, as compared to Ru–Ru in RuO2 [Reference Wang, Lin and Tan22]. This decreased Ru–Ga interatomic distance triggered the OPM happening over Ga0.2Ru0.8O2, which required low overpotentials of 188 and 219 mV at 10 and 100 mA cm−2, respectively, with a long-term stability of 800 h at 100 mA cm−2 for acidic OER. Notably, to maintain the OPM occurring in acidic OER, those reported heteroatoms (e.g., V [Reference Wu, Fu and Chang21], Cr [Reference Cao, Qin, Zhang, Chen and Jiao25], Mn [Reference Ji, Tang and Zhang24], Co [Reference Liang, Gao and Xu23], Ga [Reference Wang, Lin and Tan22]) should possess high resistance to acid corrosion and atomic radii much smaller than the Ru atom to shorten the Ru–M interatomic distance. It is undoubted that the atomic radii of heteroatoms mainly serve as a threshold for activating OPM, while the oxophilicity of heteroatoms would be determinative to the *OO* coupling process at the Ru–M dual sites. However, heteroatoms with higher oxophilicity values (e.g., Mo (0.6), Ce (0.9), La (1.0)) than Ru (0.4) usually exhibit large atomic radii [Reference Liang, Zhang and Wang26, Reference Kepp27], which makes it challenging to shorten the Ru–M distance and thus leads to their limited attention to achieve OPM. Given the coordination numbers (CN) matched between Mo–O (CNMo-O = 6) in MoO3 and Ru–O (CNRu-O = 6) in RuO2, Mo-incorporated RuO2 would keep the rutile phase. It is thus rationally anticipated that the enhancement in acidic OER performance over Mo-incorporated RuO2 with oxygen vacancies introduced to shorten the interatomic distance to trigger OPM, and highly oxophilic heteroatoms incorporated to create asymmetric Ru–Mo dual sites to accelerate the *OO* coupling process for improved OPM.
As motivated by the above insights, herein, oxophilic Mo atoms were atomically dispersed in the oxygen-vacancy-enriched RuO2 lattices (Mo–RuO2-x), with asymmetric Ru–Mo dual sites created to be responsible for the accelerated *OO* coupling process for efficient acidic OER. The obtained Mo–RuO2-x electrode exhibits excellent acidic OER performance, with low overpotentials of 191 and 234 mV to achieve current densities of 10 and 100 mA cm−2, respectively, and maintains sustained operation at 10 mA cm−2 exceeding 500 h. More encouragingly, the PEMWE assembled with Mo–RuO2-x as the anode and Pt/C as the cathode could be survive from a 500 h operation at an industrial-level current density of 1 A cm−2, with a cell voltage of 1.63 V. As revealed by experimental characterizations and theoretical calculations, the asymmetric Ru–Mo dual sites with interatomic distances shortened by the introduced oxygen vacancies could trigger the OPM, while the incorporated oxophilic Mo atoms, exhibiting a higher d-band center than Ru, facilitate the adsorption of O* intermediates and accelerate the *OO* coupling process in OPM for the improved acidic OER performance. These findings should guide the regulation of the *OO* coupling process for efficient acidic OER, which also proposes an alternative strategy for the design of highly active and stable Ru-based electrocatalysts via lattice and oxophilicity engineering for industrial-level PEMWE.
2. Methods
2.1. Materials
Titanium felt (TF, thickness: 0.4 mm) was purchased from Zhejiang Jiuyu Technology Co., Ltd (China). Carbon paper (CP, thickness: 0.3 mm) was purchased from Shanghai Hesen Technology Co., Ltd (China). Sodium nitrate (NaNO3, analytical reagent), ammonium chloride (NH4Cl, analytical reagent), hydrochloric acid (HCl, 36 wt%), and sulfuric acid (H2SO4, 95–98 wt%) were purchased from Sinopharm Chemical Reagent Co., Ltd (SCRC). Ammonium molybdate tetrahydrate ((NH4)6Mo7O24⋅4H2O, 98%), ruthenium trichloride trihydrate (RuCl3⋅3H2O, 98%), tetramethylammonium sulfate (TMA2SO4, 98%), and Nafion solution (5 wt%) were purchased from Shanghai Macklin Biochemical Co., Ltd. Pt/C (40 wt% Pt) was purchased from Johnson Matthey Company. Teflon emulsion (60 wt%) was purchased from Shanghai Aladdin Biochemical Technology Co., Ltd. All the aqueous solutions were prepared with ultrapure water (18.25 MΩ cm).
2.2. Electrocatalyst Preparation
First, the precursory salt was obtained by vaporizing a solution (20 mL) containing 0.059 mol of NaNO3, 0.320 mmol of RuCl3⋅3H2O, and 0.011 mmol of (NH4)6Mo7O24⋅4H2O at 90°C for 12 h. After grinding, the above precursory salt was placed in the crucible and calcined in air at 350°C for 2 h for a molten salt treatment. During the calcination, the NaNO3 molten salt could induce the gradual nucleation and crystallization of RuO2, with Mo atoms incorporated into the RuO2 lattices. After cooling to room temperature and removing NaNO3 by water washing, RuO2 incorporated with oxygen vacancies and Mo atoms (Mo–RuO2-x) could be obtained for efficient acidic OER. To further improve the OER activity of Mo–RuO2-x, the Ru:Mo molar ratio for precursory salt was optimized, with a value of 8:2 to achieve the highest OER activity (Supplementary Figure S1). The oxygen-vacancy-enriched RuO2 (RuO2-x) was prepared by the same process, except that NH4Cl was used to replace (NH4)6Mo7O24⋅4H2O in the precursor salt. To heal the oxygen vacancies in Mo–RuO2-x, Mo–RuO2 was prepared by annealing Mo–RuO2-x in air at 500°C for 10 h.
2.3. Characterizations
Scanning electron microscopy (SEM, ZEISS GeminiSEM 500), aberration-corrected high-angle annular dark-field scanning transmission electron microscopy (AC HAADF-STEM, JEOL JEM-ARM200F), transmission electron microscopy (TEM, Talos F200X), and corresponding energy-dispersive X-ray spectroscopy (EDS) were used to record the morphology and elementary compositions of electrocatalysts. Powder X-ray diffraction (XRD) patterns were collected on X-ray diffractometer (SHIMADZU, XRD-6100). Inductively coupled plasma-mass spectrometry (ICP-MS) was carried out with a NexION 350D (PerkinElmer) system. For digesting the catalyst, freshly prepared aqua regia solution (3:1 in V/V ratio of 36 wt% HCl and 68 wt% HNO3) was introduced into a 100 mL Teflon-lined autoclave, with 1.0 mg of Mo–RuO2-x immersed into the above solution. The sealed autoclave was maintained at 150°C for 2 hours. After cooling to room temperature, Mo–RuO2-x should be fully dissolved, with the supernatant carefully collected, diluted, and used for the ICP-MS measurements (Supplementary Table S1). Electronic structures and elemental states were explored by X-ray photoelectron spectroscopy (XPS, Thermo Fisher, ESCALAB Xi+), with binding energies calibrated by the C 1 s line (284.8 eV). Synchrotron X-ray absorption spectroscopy (XAS) was obtained at BL20A at National Synchrotron Radiation Research Center, Taiwan. The acquired XAS data were analyzed according to the standard procedure by using the ATHENA and ARTEMIS modules implemented in the IFEFFIT software packages.
In situ Raman spectra were obtained from a Raman spectrometer (RENISHAW, inVia) with an electrochemical workstation (CHI 660E). A three-electrode system was used in a home-made Teflon cell with a quartz window, with an Au-coated glassy carbon electrode, graphite rod, and Hg/Hg2SO4 (in saturated K2SO4 solution) electrode used as the working, counter, and reference electrodes, respectively. 0.5 M H2SO4 aqueous solution was used as the electrolyte. For preparing the working electrodes, 2.5 mg of catalyst powder was dispersed in 1 mL of an isopropanol aqueous solution (1:1 by volume), with the addition of 20 μL of Nafion solution (5 wt%). The above solution was ultrasonicated for 30 min until a well-dispersed catalyst ink formed. The working electrodes were then fabricated by drop-casting the catalyst ink on a 4 mm Au-coated glassy carbon electrode with the mass loading of 0.51 mg cm−2. The Raman signals were collected at potentials from open circuit potential (OCP) to 1.53 V versus RHE, with the 532 nm laser set at 25 mW and collecting time of 20 seconds for three times.
In situ attenuated total reflection surface-enhanced infrared spectroscopy (ATR-SEIRAS IR, Bruker, INVENIO X) was performed in a homemade Teflon cell, with an Au-coated Si hemisphere, graphite rod, and Hg/Hg2SO4 (in saturated K2SO4 solution) serving as the working, counter, and reference electrodes, respectively. The working electrodes were prepared by drop-casting the above catalyst ink on a 25 mm Au-coated Si hemisphere with a mass loading of ca. 0.1 mg cm−2. The background was subtracted under OCP. The signals of ATR-SEIRAS IR between 1000 and 4000 cm−1 were collected with the potential applied for at least 5 min to obtain stable OER intermediates. The broad peak located at ca. 1230 cm−1 should be attributed to the Si–O–Si vibration from the Si hemisphere [Reference Wang, Hung and Zhao28]. Furthermore, the Si hemisphere is usually accompanied by a Si cutoff region at the range of 1075–1150 cm−1, as documented in a previous report [Reference Morhart, Unni, Lardner and Burgess29].
In-situ differential electrochemical mass spectroscopy (DEMS) was conducted on an in-situ DEMS setup (QAS 100, Shanghai Linglu Instruments Co., Ltd). A typical three-electrode cell was connected to the mass spectrometer, with Au-coated porous Teflon film, saturated Ag/AgCl electrode, and Pt wire served as working, reference, and counter electrodes, respectively. The working electrodes were prepared by drop-casting the above catalyst ink on a 50 μm thick Au-coated porous Teflon film, with a mass loading of ca. 0.7 mg cm−2. For labeling the catalyst with isotope 18O, the working electrodes were subjected to cyclic voltammetry (CV) from at 1.2 to 1.6 V versus RHE for five cycles at a scan rate of 5 mV s−1 in 18O-labeled 0.5 M H2SO4. Then, the 18O-labeled working electrodes were rinsed with H216O several times to remove the residual H218O. Finally, the 18O-labeled working electrodes were subjected to CV from 1.2 to 1.6 V versus RHE using H216O as the solvent, while the oxygen was detected by mass spectrometry.
For pH-dependent measurements, the electrolyte was prepared by mixing 0.5 M H2SO4 and 0.5 M K2SO4 in different volume ratios to achieve the desired pH values of 0.5, 0.6, 0.7, 0.8, and 0.9, as measured by a calibrated pH meter. A typical three-electrode system was employed for evaluating the OER activity of the electrocatalyst at each pH, comprising a catalyst-coated glassy carbon electrode (with a catalyst loading of 0.51 mg cm−2) as the working electrode, a graphite rod as the counter electrode, and an Ag/AgCl (saturated KCl) electrode as the reference electrode. All the potentials were calibrated to the RHE scale using ERHE = EAg/AgCl + 0.197 + 0.059 × pH. The current densities at 1.45 V versus RHE were specifically recorded.
2.4. Electrochemical Measurements
The electrocatalytic activity for OER was evaluated on a CHI 660E electrochemical workstation in a three-electrode cell. The commercial RuO2, RuO2-x, and Mo–RuO2-x catalysts were employed as the working electrodes, with graphite rod and Hg/Hg2SO4 (in saturated K2SO4 solution) electrodes used as the counter and reference electrodes, respectively. For preparing the working electrodes, 2.5 mg of catalyst powder was dispersed in 1 mL solution containing isopropanol and water (1:1 by volume), with the addition of 20 μL Nafion solution (5 wt%). The above solution was ultrasonicated for 30 min until a well-dispersed catalyst ink formed. The working electrodes were then fabricated by drop-casting the catalyst ink on a 5 mm glassy-carbon rotating disk electrode with a mass loading of ca. 0.51 mgcat cm−2. The OER activity of the working electrodes was measured at a rotation rate of 1600 rpm, using 0.5 M O2-saturated H2SO4 solution as the electrolyte. Linear sweep voltammetry (LSV) measurements were conducted at room temperature from 1.25 to 1.60 V versus RHE with a scan rate of 5 mV s−1. The iR correction (100%) was performed manually, where R represents the ohmic resistance as determined by electrochemical impedance spectroscopy (EIS) in the high-frequency region [Reference Zhao, Dang and Cao30, Reference Shi, Li and Wang31]. Tafel plots were calculated from LSV results according to the equation: η = a + b log|j|, in which η is the overpotential, a is the intercept, b is the Tafel slope, and |j| is the absolute value of current density. EIS measurements were carried out at a frequency range of 0.1 Hz to 100 kHz at a controlled potential of 0.8 V versus Hg/Hg2SO4. CVs were carried out with scan rates varying from 20 to 100 mV s−1 in a non-Faradaic region (between 0.45 and 0.55 V versus Hg/Hg2SO4), with double-layer capacitances (Cdl) calculated from the equation: ((Ja − Jc)/2)/ν, where Ja and Jc were the positive and negative scan currents at 0.5 V versus Hg/Hg2SO4, respectively. Electrochemical active surface areas (ECSAs) were calculated by the double-layer capacitance method by following the formula of ECSAs = Cdl/Cs (Cs represents the specific capacitance of samples, which was assumed to be 35 μF cm−2 in 0.5 M H2SO4) [Reference Huang, Sheng and Ross32]. The calibration of Hg/Hg2SO4 reference electrode was carried out in the high purity hydrogen saturated 0.5 M H2SO4 electrolyte with Pt foil as working electrode, by following the equation: E(RHE) = E(Hg/Hg2SO4) + 0.682 V. To conduct the chronopotentiometry measurements at constant OER current density of 10 mA cm−2, the working electrode is prepared by drop-casting the above catalyst ink on a piece of carbon paper with the mass loading of 2.5 mg cm−2. The mass activities of Ru for RuO2, RuO2-x, and Mo–RuO2-x were calculated by dividing the current density in the LSV curves by the mass of Ru obtained from ICP-MS.
2.5. Proton Exchange Membrane Water Electrolyzer Test
To evaluate the application potential of the Mo–RuO2-x electrode for industrial water splitting, a PEMWE was assembled with Mo–RuO2-x as the anode and commercial Pt/C (40 wt% Pt) as the cathode (Mo–RuO2-x||Pt/C PEMWE) for acidic water electrolysis at a temperature of 80°C, with Nafion N115 membrane as electrolyte. To prepare the anode and cathode, the catalysts were dispersed in a mixture of water and isopropanol, with the addition of Nafion ionomer to achieve an ionomer mass fraction of 30 wt% at the anode and 35 wt% at the cathode, respectively. In addition, the Teflon emulsion was added to the anode catalyst ink with a mass fraction of 10 wt%, to enhance the stability of PEMWE [Reference Han, Bian and Proskurin33]. After ultrasonication in a low-temperature water bath, the homogeneous catalyst ink could be obtained. The cathode catalysts were sprayed on the cleaned titanium felt with a mass loading of ca. 0.3 mgPt cm−2. As for the anode, the catalysts were first sprayed on one side of Teflon films (thickness: 0.2 mm), with a mass loading of ca. 1.25 mgRu cm−2. Subsequently, the Teflon-supported anode catalysts and Nafion N115 membrane were hot-pressed together at 135°C for 5 min under a pressure of 10 MPa. After cooling, the Teflon on the surface was carefully peeled off to get the catalyst-coated membrane (CCM) as the anode. Then, the Mo–RuO2-x||Pt/C PEMWE was integrated with an active area of 1 cm2 and fed with ultrapure water into the anode at 40 mL min−1, for water-splitting electrolysis. The electrolysis performance in PEMWE was evaluated at a Metrohm Autolab electrochemical workstation (PGSTAT302N), with polarization curves obtained by LSV measurements from 1.2 to 2.2 V and stability tests conducted by a chronoamperometry at 1 A cm−2. Additionally, RuO2 was used to replace the anode of Mo–RuO2-x||Pt/C PEMWE with a mass loading of ca. 1.90 mgRu cm−2, for assembling the RuO2||Pt/C PEMWE as a reference.
2.6. Density Functional Theory Calculations
All theoretical calculations in this study were based on Density Functional Theory, implemented in the Vienna Ab initio Simulation Package (VASP) [Reference Kresse and Joubert34, Reference Kresse and Furthmüller35, Reference Kresse and Hafner36]. The Perdew–Burke–Ernzerhof (PBE) functional was employed for the electronic exchange and correlation [Reference Perdew, Burke and Ernzerhof37]. The plane wave pseudopotential with a kinetic cutoff energy of 400 eV within the projector augmented wave (PAW) method was used for the theoretical calculations. The Brillouin zone was sampled using a 3 × 2 × 1 k-point mesh in the Gamma-centered setup for the calculations on the surface. The self-consistent total energy convergence criterion was less than 10−5 eV per atom, and the atom positions were optimized until the Hellmann–Feynman force on each atom was smaller than 0.05 eV Å−1. A vacuum region of about 15 Å was used to avoid interactions between the surface and its periodic images.
The AEM for OER in acidic media follows four elementary steps:
-
Step 1: $ {\mathrm{H}}_2\mathrm{O}\left(\mathrm{l}\right)+\ast \to \mathrm{OH}\ast +{\mathrm{e}}^{\hbox{-} }+{\mathrm{H}}^{+}\hskip2.759999em \varDelta {G}_1 $
 .
-
Step 2: $ \mathrm{O}\mathrm{H}\ast \to \mathrm{O}\ast +{\mathrm{e}}^{\hbox{-} }+{\mathrm{H}}^{+}\hskip3.48em \varDelta {G}_2 $
. -
Step 3: $ \mathrm{O}\ast +{\mathrm{H}}_2\mathrm{O}\left(\mathrm{l}\right)\to \mathrm{O}\mathrm{OH}\ast +{\mathrm{e}}^{\hbox{-} }+{\mathrm{H}}^{+}\hskip2.4em \varDelta {G}_3 $
. -
Step 4: $ \mathrm{OOH}\ast \to \ast +{\mathrm{O}}_2\left(\mathrm{g}\right)+{\mathrm{e}}^{\hbox{-} }+{\mathrm{H}}^{+}\hskip2.759999em \varDelta {G}_4 $
.


where * is a metal active site on electrocatalysts, and O*, OH*, and OOH* are the adsorbed intermediates. (l) and (g) represent the liquid and gas phases of H2O and O2, respectively.
The LOM for OER in acidic media follows six elementary steps:
-
Step 1: $ {\mathrm{H}}_2\mathrm{O}\left(\mathrm{l}\right)+\ast \to \mathrm{OH}\ast +{\mathrm{e}}^{\hbox{-} }+{\mathrm{H}}^{+}\hskip2.76em \varDelta {G}_1 $
. -
Step 2: $ \mathrm{O}\mathrm{H}\ast \to \mathrm{O}\ast +{\mathrm{e}}^{\hbox{-} }+{\mathrm{H}}^{+}\hskip3.48em \varDelta {G}_2 $
. -
Step 3: $ \mathrm{O}\ast \to \mathrm{O}\mathrm{O}\ast +{\mathrm{O}}_{\mathrm{v}}\hskip3.96em \varDelta {G}_3 $
. -
Step 4: $ \mathrm{OO}\ast +{\mathrm{O}}_{\mathrm{v}}\to \ast +{\mathrm{O}}_{\mathrm{v}}+{\mathrm{O}}_2\left(\mathrm{g}\right)\hskip2.76em \Delta {G}_4 $
. -
Step 5: $ \ast +{\mathrm{O}}_{\mathrm{v}}+{\mathrm{H}}_2\mathrm{O}\left(\mathrm{l}\right)\to \ast +{\mathrm{O}}_{\mathrm{v}}+\mathrm{OH}+{\mathrm{e}}^{\hbox{-} }+{\mathrm{H}}^{+}\hskip1.44em \varDelta {G}_5 $
. -
Step 6: $ \ast +{\mathrm{O}}_{\mathrm{v}}+\mathrm{OH}\to \ast +{\mathrm{e}}^{\hbox{-} }+{\mathrm{H}}^{+}\hskip2.88em \varDelta {G}_6 $
.


where Ov represents the oxygen vacancy near the metal site, formed by the lattice oxygen that participated in the acidic OER, and OO* is the adsorbed intermediate before releasing O2.
The OPM for OER in acidic media follows five elementary steps:
-
Step 1: $ {\mathrm{H}}_2\mathrm{O}\left(\mathrm{l}\right)+\ast +\ast \to \mathrm{OH}\ast +\ast +{\mathrm{e}}^{\hbox{-} }+{\mathrm{H}}^{+}\hskip2.04em \varDelta {G}_1 $
. -
Step 2: $ \mathrm{OH}\ast +\ast +{\mathrm{H}}_2\mathrm{O}\left(\mathrm{l}\right)\to \mathrm{OH}\ast +\mathrm{OH}\ast +{\mathrm{e}}^{\hbox{-} }+{\mathrm{H}}^{+}\hskip1.32em \varDelta {G}_2 $
. -
Step 3: $ \mathrm{O}\mathrm{H}\ast +\mathrm{OH}\ast \to \mathrm{O}\ast +\mathrm{OH}\ast +{\mathrm{e}}^{\hbox{-} }+{\mathrm{H}}^{+}\hskip2.04em \varDelta {G}_3 $
. -
Step 4: $ \mathrm{O}\ast +\mathrm{OH}\ast \to \ast \mathrm{O}\mathrm{O}\ast +{\mathrm{e}}^{\hbox{-} }+{\mathrm{H}}^{+}\hskip2.64em \varDelta {G}_4 $
. -
Step 5: $ \ast \mathrm{OO}\ast \to \ast +\ast +{\mathrm{O}}_2\left(\mathrm{g}\right)\hskip3.359999em \varDelta {G}_5 $
.


where *OO* represents direct oxygen–oxygen radical coupling on the dual active sites and serves as the key intermediate of the OPM.
Gibbs free energy difference (ΔG) for the water redox reactions was calculated according to the approach proposed by Nørskov et al. [Reference Nørskov, Rossmeisl and Logadottir38], as defined below:

where ∆EDFT, ∆EZPE, and ∆S were denoted as the DFT-calculated electronic energy difference between reactants and products of reactions, the zero-point energy correction, and the vibrational entropy at T = 300 K, respectively. The ideal gas approximation was used for O2 and H2, and the harmonic approximation was used for adsorbates.
The Mo–RuO2-x structure model was obtained from the results of AC HAADF-STEM images, which consists of a four-layer RuO2 (110) surface, with oxygen vacancies and a Mo atom incorporated in the lattice. The number of oxygen vacancies was set to control the oxidation state of Ru to be +3.36, close to the value of +3.10 as determined by Ru K-edge X-ray absorption near-edge structure (XANES) spectra (Supplementary Figure S7). The asymmetric Ru–Mo dual sites were constructed by replacing one surface Ru atom with one Mo atom for building the Mo–RuO2-x slab model. During the structural optimization, the top two layers of atoms of Mo–RuO2-x were allowed to relax, while the bottom two layers of atoms were constrained to simulate the bulk structure.
3. Results and Discussion
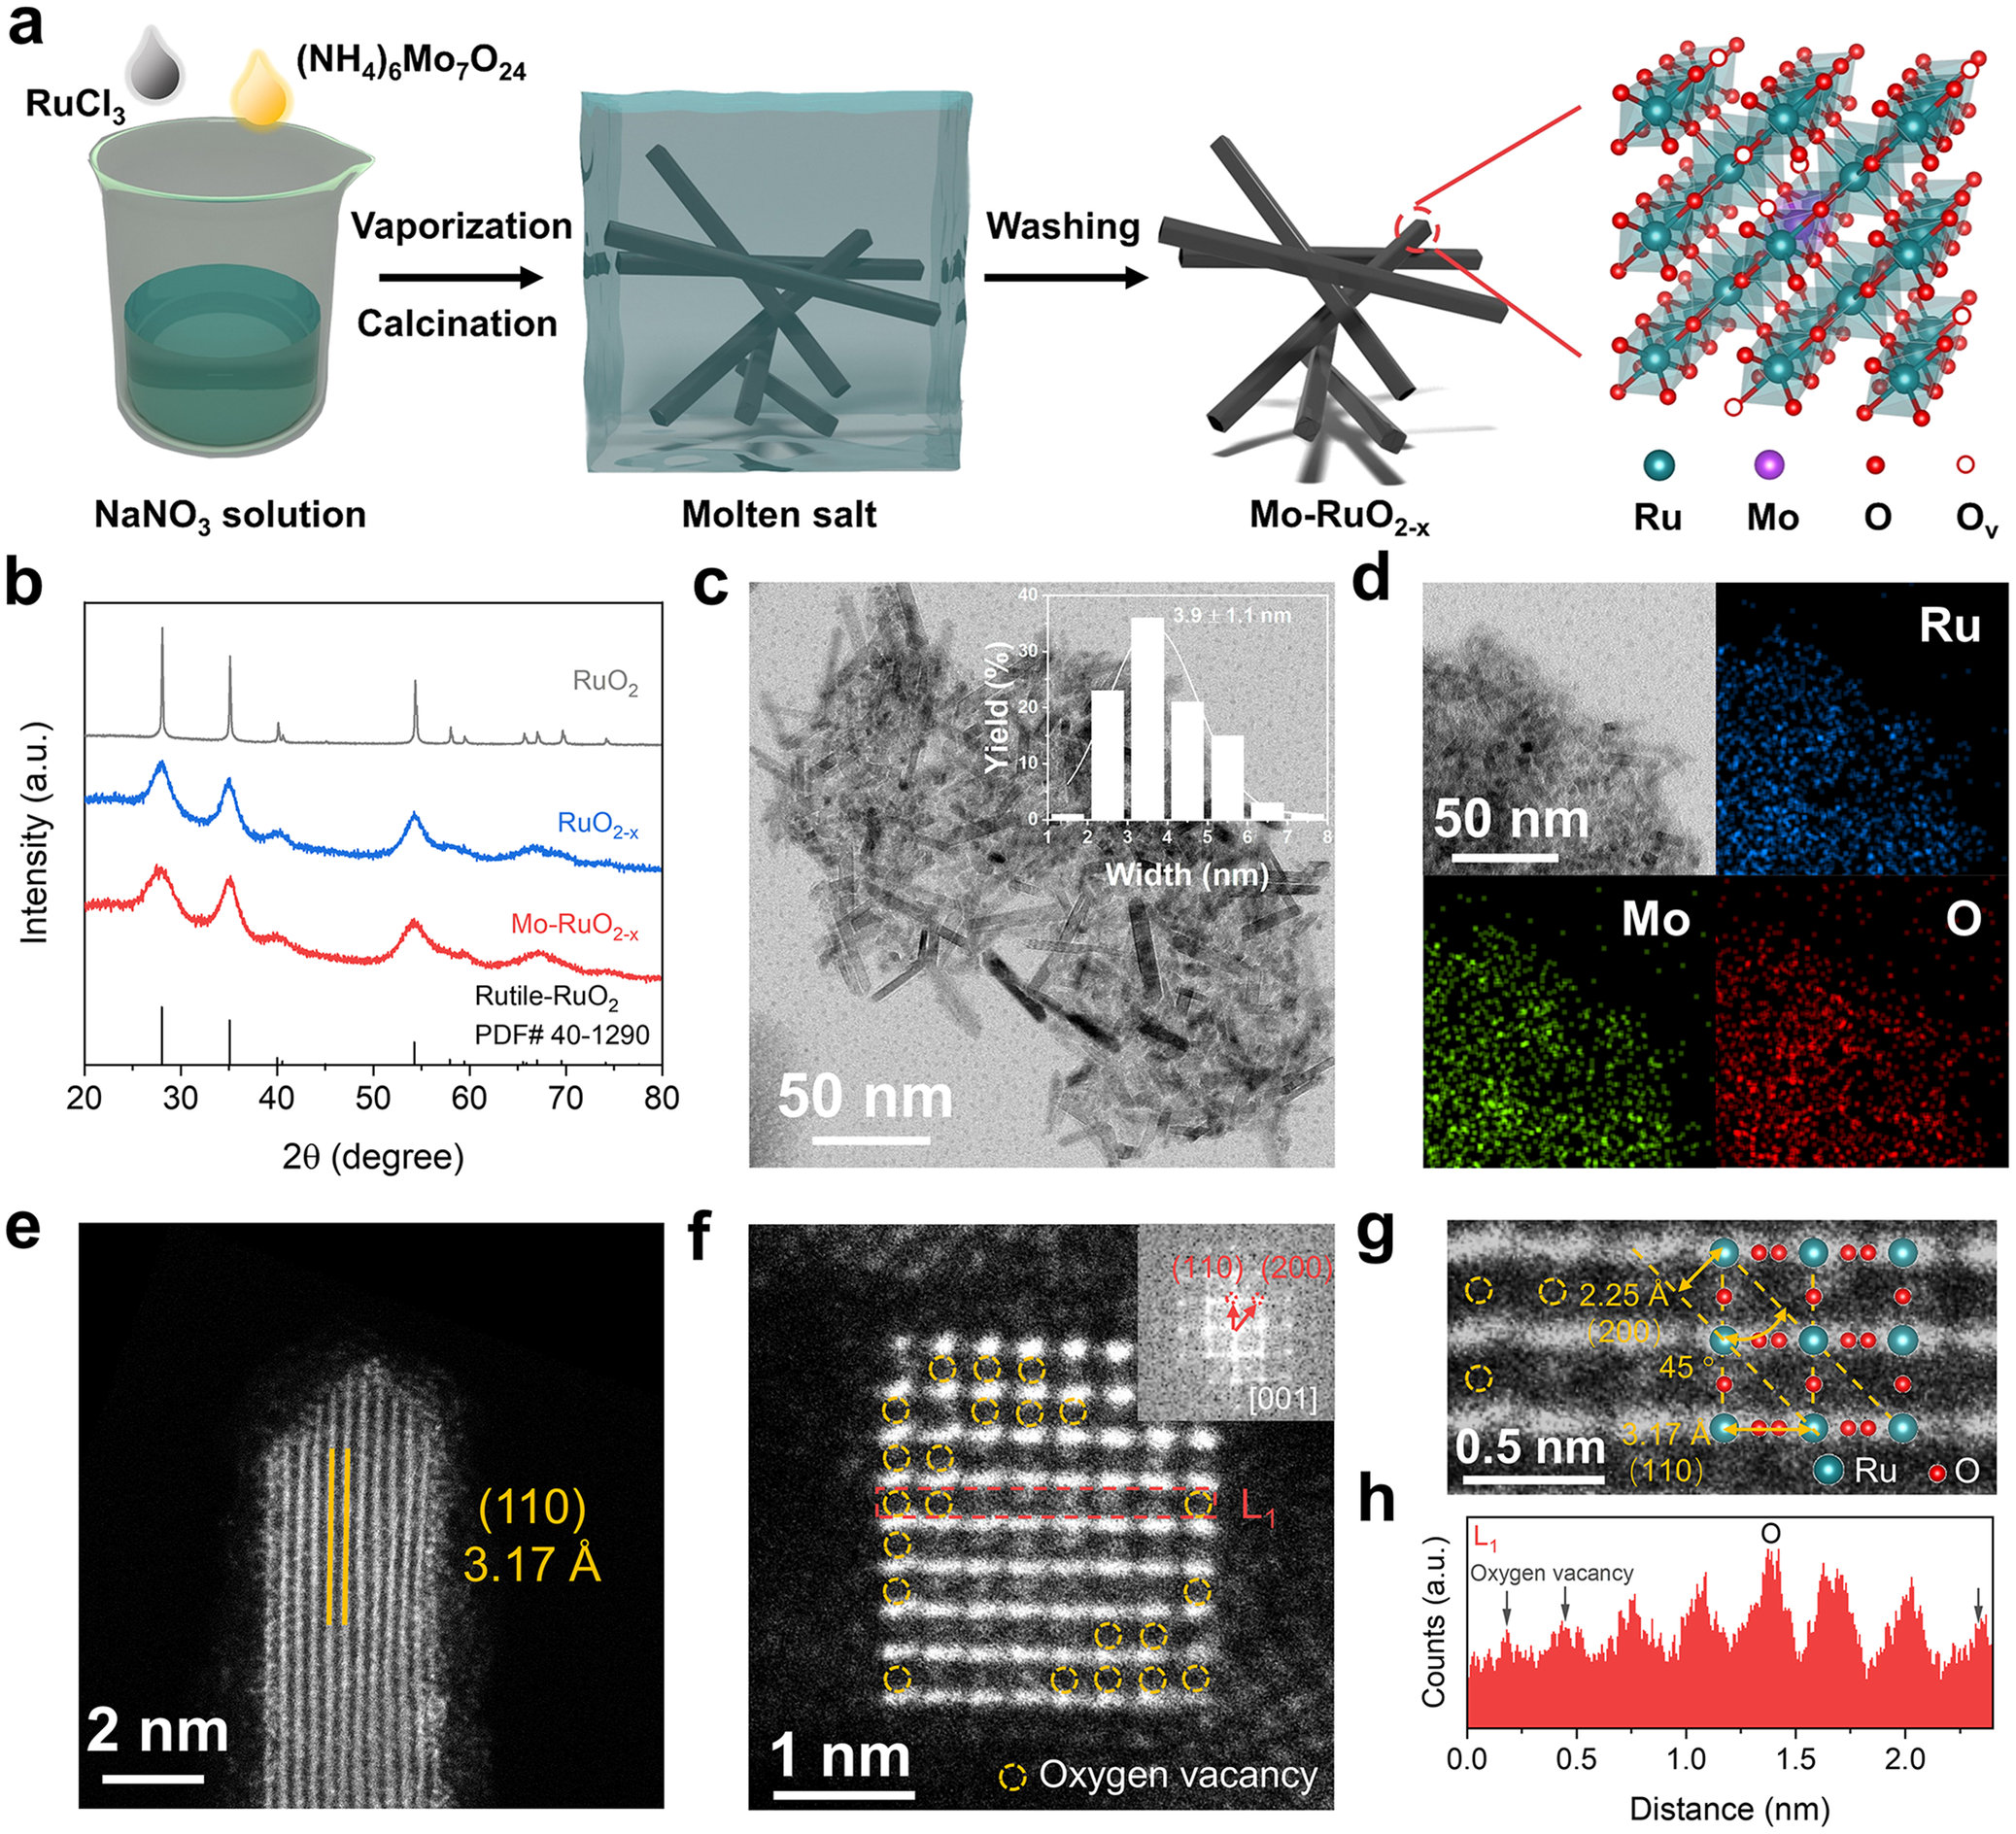
Herein, to introduce oxygen vacancies into the RuO2 lattices along with the incorporation of heterogeneous Mo atoms (Mo–RuO2-x), a NaNO3 solution dissolved with RuCl3 and (NH4)6Mo7O24 was vaporized and further calcined at 350°C (Figure 1a). During the calcination process, the NaNO3 molten salt would provide oxide anions (O2−) to bond with Ru cations [Reference Hu, Yue and Han39], followed by the gradual nucleation and crystallization of RuO2 phases. Such nucleation and crystallization process allows the Mo atoms to be incorporated in the RuO2 lattices. After cooling to room temperature and removing NaNO3 by water washing, the composition-optimized Mo–RuO2-x (Supplementary Figure S1) could be obtained for efficient acidic OER, with Ru:Mo atomic ratio determined to be 4.8:1 by ICP-MS (Supplementary Table S1). As a reference, RuO2-x was prepared by following the same procedure without (NH4)6Mo7O24 added in NaNO3 solution. XRD patterns reveal four peaks located at 2θ = 28.01°, 35.05°, 54.25°, and 66.99° for RuO2-x and Mo–RuO2-x (Figure 1b), corresponding to the rutile RuO2 phases. With XRD peaks related to MoO3 hardly detected, the Mo atoms should be incorporated and highly dispersed in the RuO2 lattices without aggregation. It should be carefully noted that the XRD peaks exhibit a full width at half maximum (FWHM) much larger for RuO2-x and Mo–RuO2-x than commercial RuO2 (Figure 1b), implying a more disordered crystal structure or smaller crystal size of RuO2 phases as induced by molten salt treatment. High-resolution transmission electron microscopy (HRTEM) image displays an ultrasmall nanorod structure with an average width of 3.9 ± 1.1 nm for Mo–RuO2-x (Figure 1c), with homogeneous distribution of Ru, Mo, and O elements (Figure 1d). The formation of this nanorod architecture is attributed to NH4+ in the precursor molten salt, which directs the linear alignment of Ru atoms during crystallization (Supplementary Figure S2) [Reference Lim, Park and Jeon40]. However, this structural feature contributes negligibly to the enhanced OER activity (Supplementary Figure S3). AC HAADF-STEM images identify the atomic structure of Mo–RuO2-x nanorods with side surfaces terminated by the RuO2 (110) plane of lattice spacing determined to be 3.17 Å (Figure 1e). With the rectangular nanorods (Figure 1f) grown along the [001] zone axis (Figure 1f, inset), the atomic arrangements at the top surface of Mo–RuO2-x, aligning well with the RuO2 structural model, exhibit the (110) and (200) planes with lattice spacings determined to be 3.17 Å and 2.25 Å (Figure 1g), respectively. The atomic intensity profile (Figure 1h) shows the absence of some O atoms in the Mo–RuO2-x lattices (Figure 1f, g), suggesting that abundant oxygen vacancies are generated during the molten salt treatment, which are induced by the rapid nucleation and crystallization of RuO2 phases and stabilized by the molten salt environment [Reference Feng, Wang and Zhang41]. These HRTEM and AC HAADF-STEM images provide evidence that the Mo–RuO2-x nanorods are enriched with oxygen vacancies, along with heterogeneous Mo incorporated in the RuO2 lattices via molten salt treatment.
(a) Schematic process for the synthesis of Mo–RuO2-x nanorods. (b) XRD patterns of RuO2, RuO2-x, and Mo–RuO2-x. (c) HRTEM images, (d) energy-dispersive X-ray spectroscopy with elemental mappings, and (e–g) AC HAADF-STEM images of Mo–RuO2-x with fast Fourier transform pattern (inset in (f)). (h) Line-scanning intensity profile (L1) of Mo–RuO2-x obtained from the area highlighted with a red frame in (f).

Figure 1. Long description
The figure is divided into eight panels labeled a through h.
* Panel a: A flowchart showing the synthesis process. It begins with a beaker containing N a N O sub 3 solution where R u C l sub 3 and (N H sub 4) sub 6 M o sub 7 O sub 24 are added. Arrows for vaporization and calcination lead to a blue cube representing molten salt containing nanorods. A washing step leads to the final Mo-Ru O sub 2 minus x nanorods. A crystal lattice model on the right shows R u (teal), M o (purple), O (red), and O sub v (white circles) atoms.
* Panel b: An X R D pattern plot with 2 theta (degree) on the x-axis from 20 to 80 and Intensity (a.u.) on the y-axis. Three curves are shown: R u O sub 2 (black), R u O sub 2 minus x (blue), and Mo-Ru O sub 2 minus x (red). Reference bars for Rutile-R u O sub 2 are at the bottom.
* Panel c: An H R T E M photo of nanorods with a 50 nm scale bar. An inset bar chart shows nanorod width distribution peaking at 3.9 plus or minus 1.1 nm.
* Panel d: Four-panel elemental mapping. Top-left is a T E M photo. Top-right shows R u (blue). Bottom-left shows M o (green). Bottom-right shows O (red).
* Panel e: An A C H A A D F S T E M photo of a single nanorod tip with a 2 nm scale bar. Yellow lines indicate a (1 1 0) lattice spacing of 3.17 Angstroms.
* Panel f: A high-resolution atomic photo with a 1 nm scale bar. Yellow dashed circles highlight oxygen vacancies. A red dashed box labeled L 1 marks a line scan area. The inset shows a fast Fourier transform pattern with (1 1 0) and (2 0 0) planes.
* Panel g: A magnified atomic photo with a 0.5 nm scale bar. It shows lattice spacings of 2.25 Angstroms for (2 0 0) and 3.17 Angstroms for (1 1 0) at a 45 degree angle. Teal and red spheres represent R u and O atoms.
* Panel h: A line-scanning intensity profile for L 1. The x-axis is Distance (nm) from 0.0 to 2.0. The y-axis is Counts (a.u.). The red jagged plot shows periodic peaks for O atoms and troughs marked with arrows for oxygen vacancies.
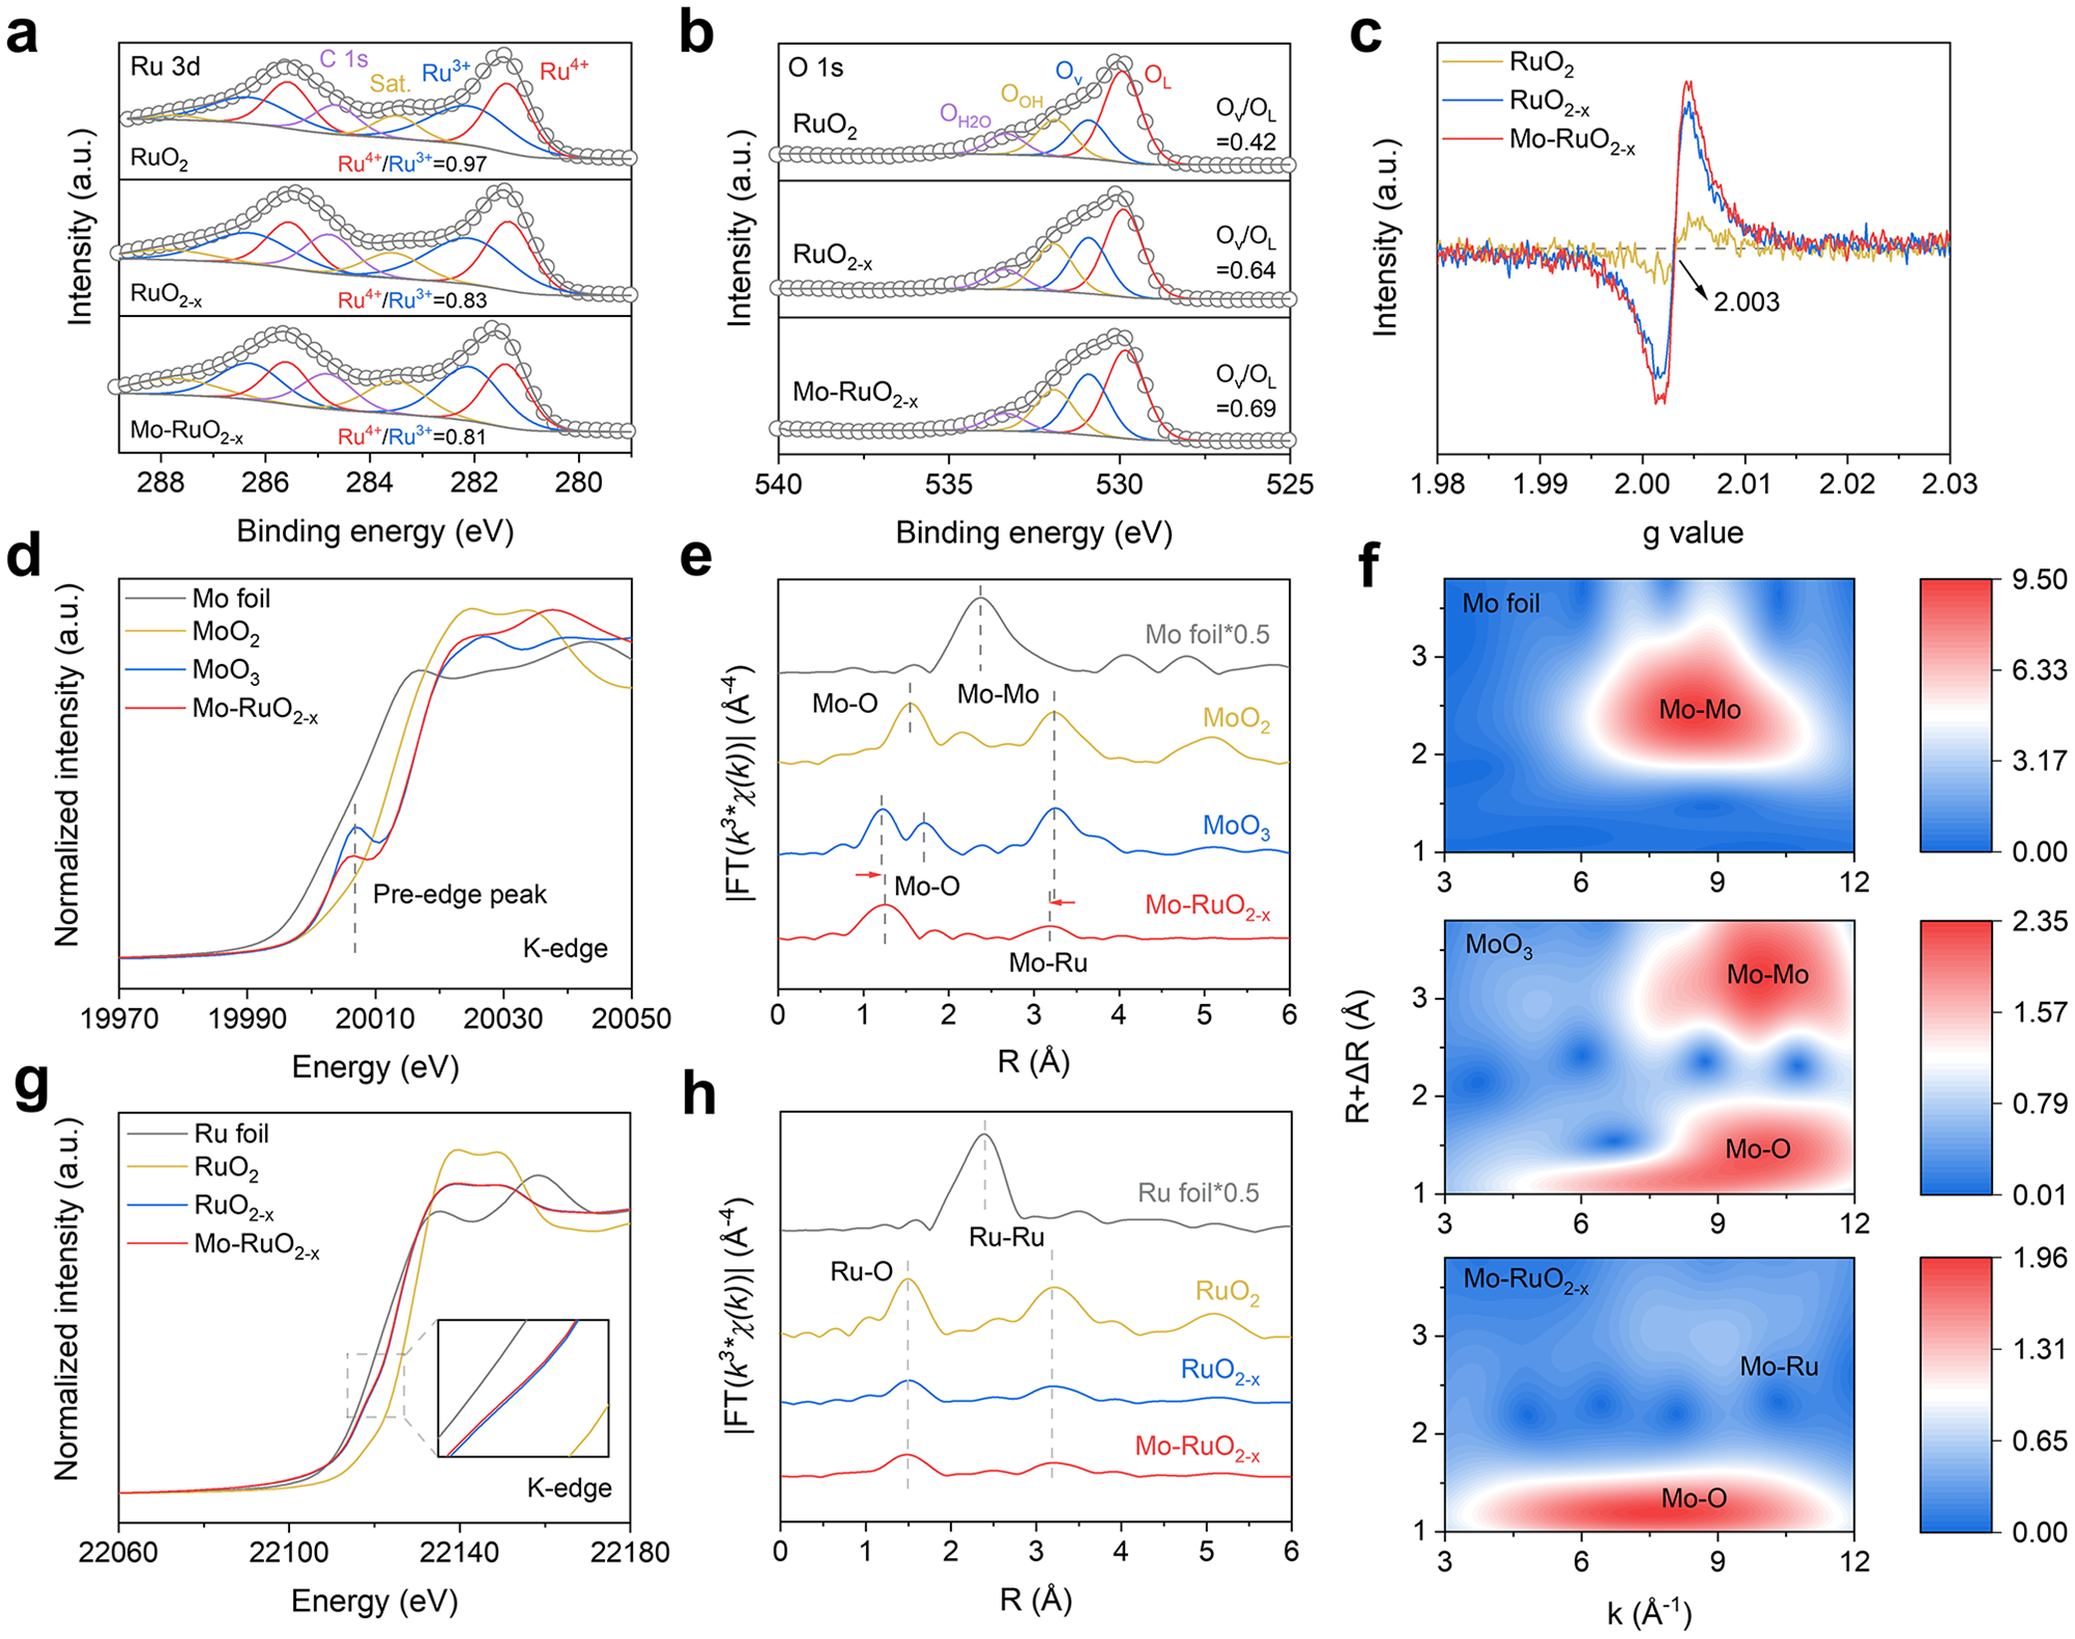
With Mo atoms incorporated and oxygen vacancies enriched in the Mo–RuO2-x lattices, the chemical compositions and electronic structures of RuO2-x and Mo–RuO2-x were investigated by XPS. As shown in Figure 2a, the Ru 3d XPS spectra reveal the Ru4+ and Ru3+ 3d5/2 signals located at ca. 281.3 and 282.2 eV [Reference Zhang, Li and Yong42], respectively, with Ru4+/Ru3+ ratio calculated to be smaller for both RuO2-x (0.83) and Mo–RuO2-x (0.81) than RuO2 (0.97), which suggests the decreased Ru oxidation states as induced by the introduced oxygen vacancies, as supported by O 1 s XPS spectra. Four distinct O 1 s signals could be observed at ca. 529.9, 530.9, 531.9, and 533.3 eV (Figure 2b), assigned to the lattice oxygen (OL), the oxygen vacancy (Ov), the adsorbed hydroxyl (OOH), and the adsorbed molecular water (OH2O), respectively [Reference Wang, Wu and Sun43, Reference Wu, Wu and Han44]. It should be noted that the Ov/OL ratios are significantly larger for RuO2-x (0.64) and Mo–RuO2-x (0.69) than RuO2 (0.42) (Figure 2b), indicating the abundant oxygen vacancies introduced into the lattices of RuO2-x and Mo–RuO2-x, as further verified by electron paramagnetic resonance (EPR) spectra (Figure 2c), with the EPR signals at g = 2.003, related to the oxygen vacancy [Reference Wang, Wu and Sun43], much stronger for both RuO2-x and Mo–RuO2-x than RuO2. Note the very similar Ru4+/Ru3+, Ov/OL ratios and EPR signals for RuO2-x and Mo–RuO2-x (Figure 2c), the incorporation of Mo atoms would not significantly alter the electronic structure of oxygen-vacancy-enriched RuO2-x nanorods obtained via molten salt treatment.
(a) Ru 3d, (b) O 1 s XPS spectra, and (c) EPR spectra of RuO2, RuO2-x, and Mo–RuO2-x. (d) Normalized XANES and (e) EXAFS spectra of Mo foil, MoO2, MoO3, and Mo–RuO2-x collected at Mo K-edge. (f) Wavelet transform analysis of the Mo K-edge EXAFS spectra of Mo foil, MoO3, and Mo–RuO2-x. (g) Normalized XANES and (h) EXAFS spectra of Ru foil, RuO2, RuO2-x, and Mo–RuO2-x collected at the Ru K-edge.

Figure 2. Long description
A multi-panel figure containing eight plots labeled a through h.
Panel a: R u 3 d X P S spectra for R u O sub 2, R u O sub 2 minus x, and M o R u O sub 2 minus x. The x-axis is Binding energy in e V from 289 to 279. The y-axis is Intensity in arbitrary units. Each spectrum shows deconvoluted peaks for C 1 s, Saturation, R u 3 plus, and R u 4 plus. Ratios of R u 4 plus to R u 3 plus decrease from 0.97 to 0.81 across the samples.
Panel b: O 1 s X P S spectra for the same three samples. The x-axis is Binding energy from 540 to 525 e V. Peaks are assigned to O H 2 O, O O H, O v, and O L. The O v over O L ratio increases from 0.42 to 0.69.
Panel c: E P R spectra showing a sharp signal at a g value of 2.003 for M o R u O sub 2 minus x and R u O sub 2 minus x, which is absent in pure R u O sub 2.
Panel d: Normalized X A N E S spectra at the M o K-edge. The x-axis is Energy in e V from 19970 to 20050. It compares M o foil, M o O sub 2, M o O sub 3, and M o R u O sub 2 minus x, highlighting a pre-edge peak.
Panel e: E X A F S spectra in R-space for the M o K-edge. Peaks correspond to M o O, M o M o, and M o R u bonds. M o R u O sub 2 minus x shows a shift in the M o O peak compared to M o O sub 3.
Panel f: Three wavelet transform heatmaps for M o foil, M o O sub 3, and M o R u O sub 2 minus x. The x-axis is k in inverse Angstroms and the y-axis is R plus delta R in Angstroms. Intensity is shown by a color scale from blue to red.
Panel g: Normalized X A N E S spectra at the R u K-edge from 22060 to 22180 e V. An inset zooms into the absorption edge region.
Panel h: E X A F S spectra in R-space for the R u K-edge. Peaks are labeled for R u O and R u R u bonds across the four samples.
XAS measurements were further carried out for RuO2-x and Mo–RuO2-x to determine the atomic coordination structures, with XANES spectra and extended X-ray absorption fine structure (EXAFS) spectra recorded at Mo and Ru K-edge. One would note an obvious pre-edge peak at ca. 20006 eV in the normalized XANES spectra collected at Mo K-edge (Figure 2d), which should be attributed to the electric-dipole forbidden 1 s → 4d transition in the highly distorted MoO6 octahedra [Reference Gaur, Stehle and Raun45, Reference Duan, Dong and Gu46]. The pre-edge peak intensity is significantly lower for Mo–RuO2-x than MoO3 (Figure 2d), indicating a less distorted MoO6 octahedra structure in Mo–RuO2-x. By evaluating the first derivative of XANES spectra collected at Mo K-edge, the average oxidation state of Mo in the bulk of Mo–RuO2-x was determined to be +6 (Supplementary Figure S4). Note the slightly lower oxidation state for surface Mo species (Supplementary Figure S5), the unsaturated Mo coordination on the surface enables the formation of Ru–Mo dual sites. The Fourier-transform (FT) EXAFS spectra were collected at Mo K-edge further present two distinct peaks located at ca. 1.23 Å and 1.72 Å for MoO3 as reference (Figure 2e), assigned to the Mo–O scattering path in the high-distortion MoO6 octahedra. In comparison, with Mo atoms incorporated into Mo–RuO2-x, only one peak could be observed at ca. 1.26 Å (Figure 2e), suggesting that Mo atoms should be well dispersed in the Mo–RuO2-x lattices with a low-distortion MoO6 octahedra structure. Furthermore, the peak positioned at ca. 3.25 Å could be assigned to the Mo–Mo scattering path in MoO3, while the negatively shifted peak observed at ca. 3.19 Å should belong to the Mo–Ru scattering path in Mo–RuO2-x. By fitting the EXAFS spectra (Supplementary Figure S6), the Mo–Ru bond length (3.130 Å) is determined to be shorter in Mo–RuO2-x than the Mo–Mo bond length (3.633 Å) in MoO3 (Supplementary Table S2). To distinguish the Mo–Ru scattering path, the wavelet transform analysis was performed on the Mo K-edge EXAFS spectra (Figure 2f). With Mo foil and MoO3 as references (Figure 2f, upper and middle), the intensity maximum in Mo–RuO2-x (Figure 2f, bottom) positioned at k ≈ 6–10 Å−1, R + ΔR ≈ 1–1.5 Å should be attributed to the Mo–O scattering path, accompanied by a faint second coordination shell detected at k ≈ 8–10 Å−1, R + ΔR ≈ 2.5–3 Å, which well suggests the atomically dispersed Mo species and the Mo–Ru bonds formed in Mo–RuO2-x [Reference Wu, Zhao and Zhai47]. The normalized XANES spectra collected at Ru K-edge were then examined with very similar absorption profiles for RuO2-x and Mo–RuO2-x (Figure 2g), with the Ru average oxidation state calculated to be +3.1 from the first derivative of Ru K-edge XANES spectra (Supplementary Figure S7). In the EXAFS spectra collected at Ru K-edge (Figure 2h), the peak located at ca. 1.50 Å should be attributed to Ru–O scattering path in RuO2 as reference, with intensity significantly decreased for both RuO2-x and Mo–RuO2-x. Such a decreased intensity indicates the much reduced Ru–O coordination number for RuO2-x and Mo–RuO2-x (CNRu-O = 5.2) relative to RuO2 (CNRu-O = 6.1) (Supplementary Table S2), as supported by the fitted EXAFS spectra (Supplementary Figure S8), which should be attributed to the abundant oxygen vacancies introduced into RuO2-x and Mo–RuO2-x via molten salt treatment. One could note another peak located at ca. 3.19 Å for both RuO2-x and Mo–RuO2-x in the Ru K-edge EXAFS spectra, corresponding to the Ru–Ru/Mo scattering path (Figure 2h). By further fitting the EXAFS spectra, the Ru–Ru/Mo bond lengths are determined to be 3.148 Å and 3.143 Å for RuO2-x and Mo–RuO2-x (Supplementary Table S2), respectively, much shorter than RuO2 (3.155 Å), which suggests that the Ru–Ru/Mo interatomic distance would be shortened by the introduced oxygen vacancies in the RuO2-x lattices. These spectral analyses demonstrate that Mo atoms are atomically dispersed in the Mo–RuO2-x lattices with the oxygen vacancies enriched via molten salt treatment, which should be responsible for the shortened Ru–Ru/Mo interatomic distance, with asymmetric Ru–Mo dual sites created to trigger the OPM for the improved acidic OER performance, as revealed in the following discussions.
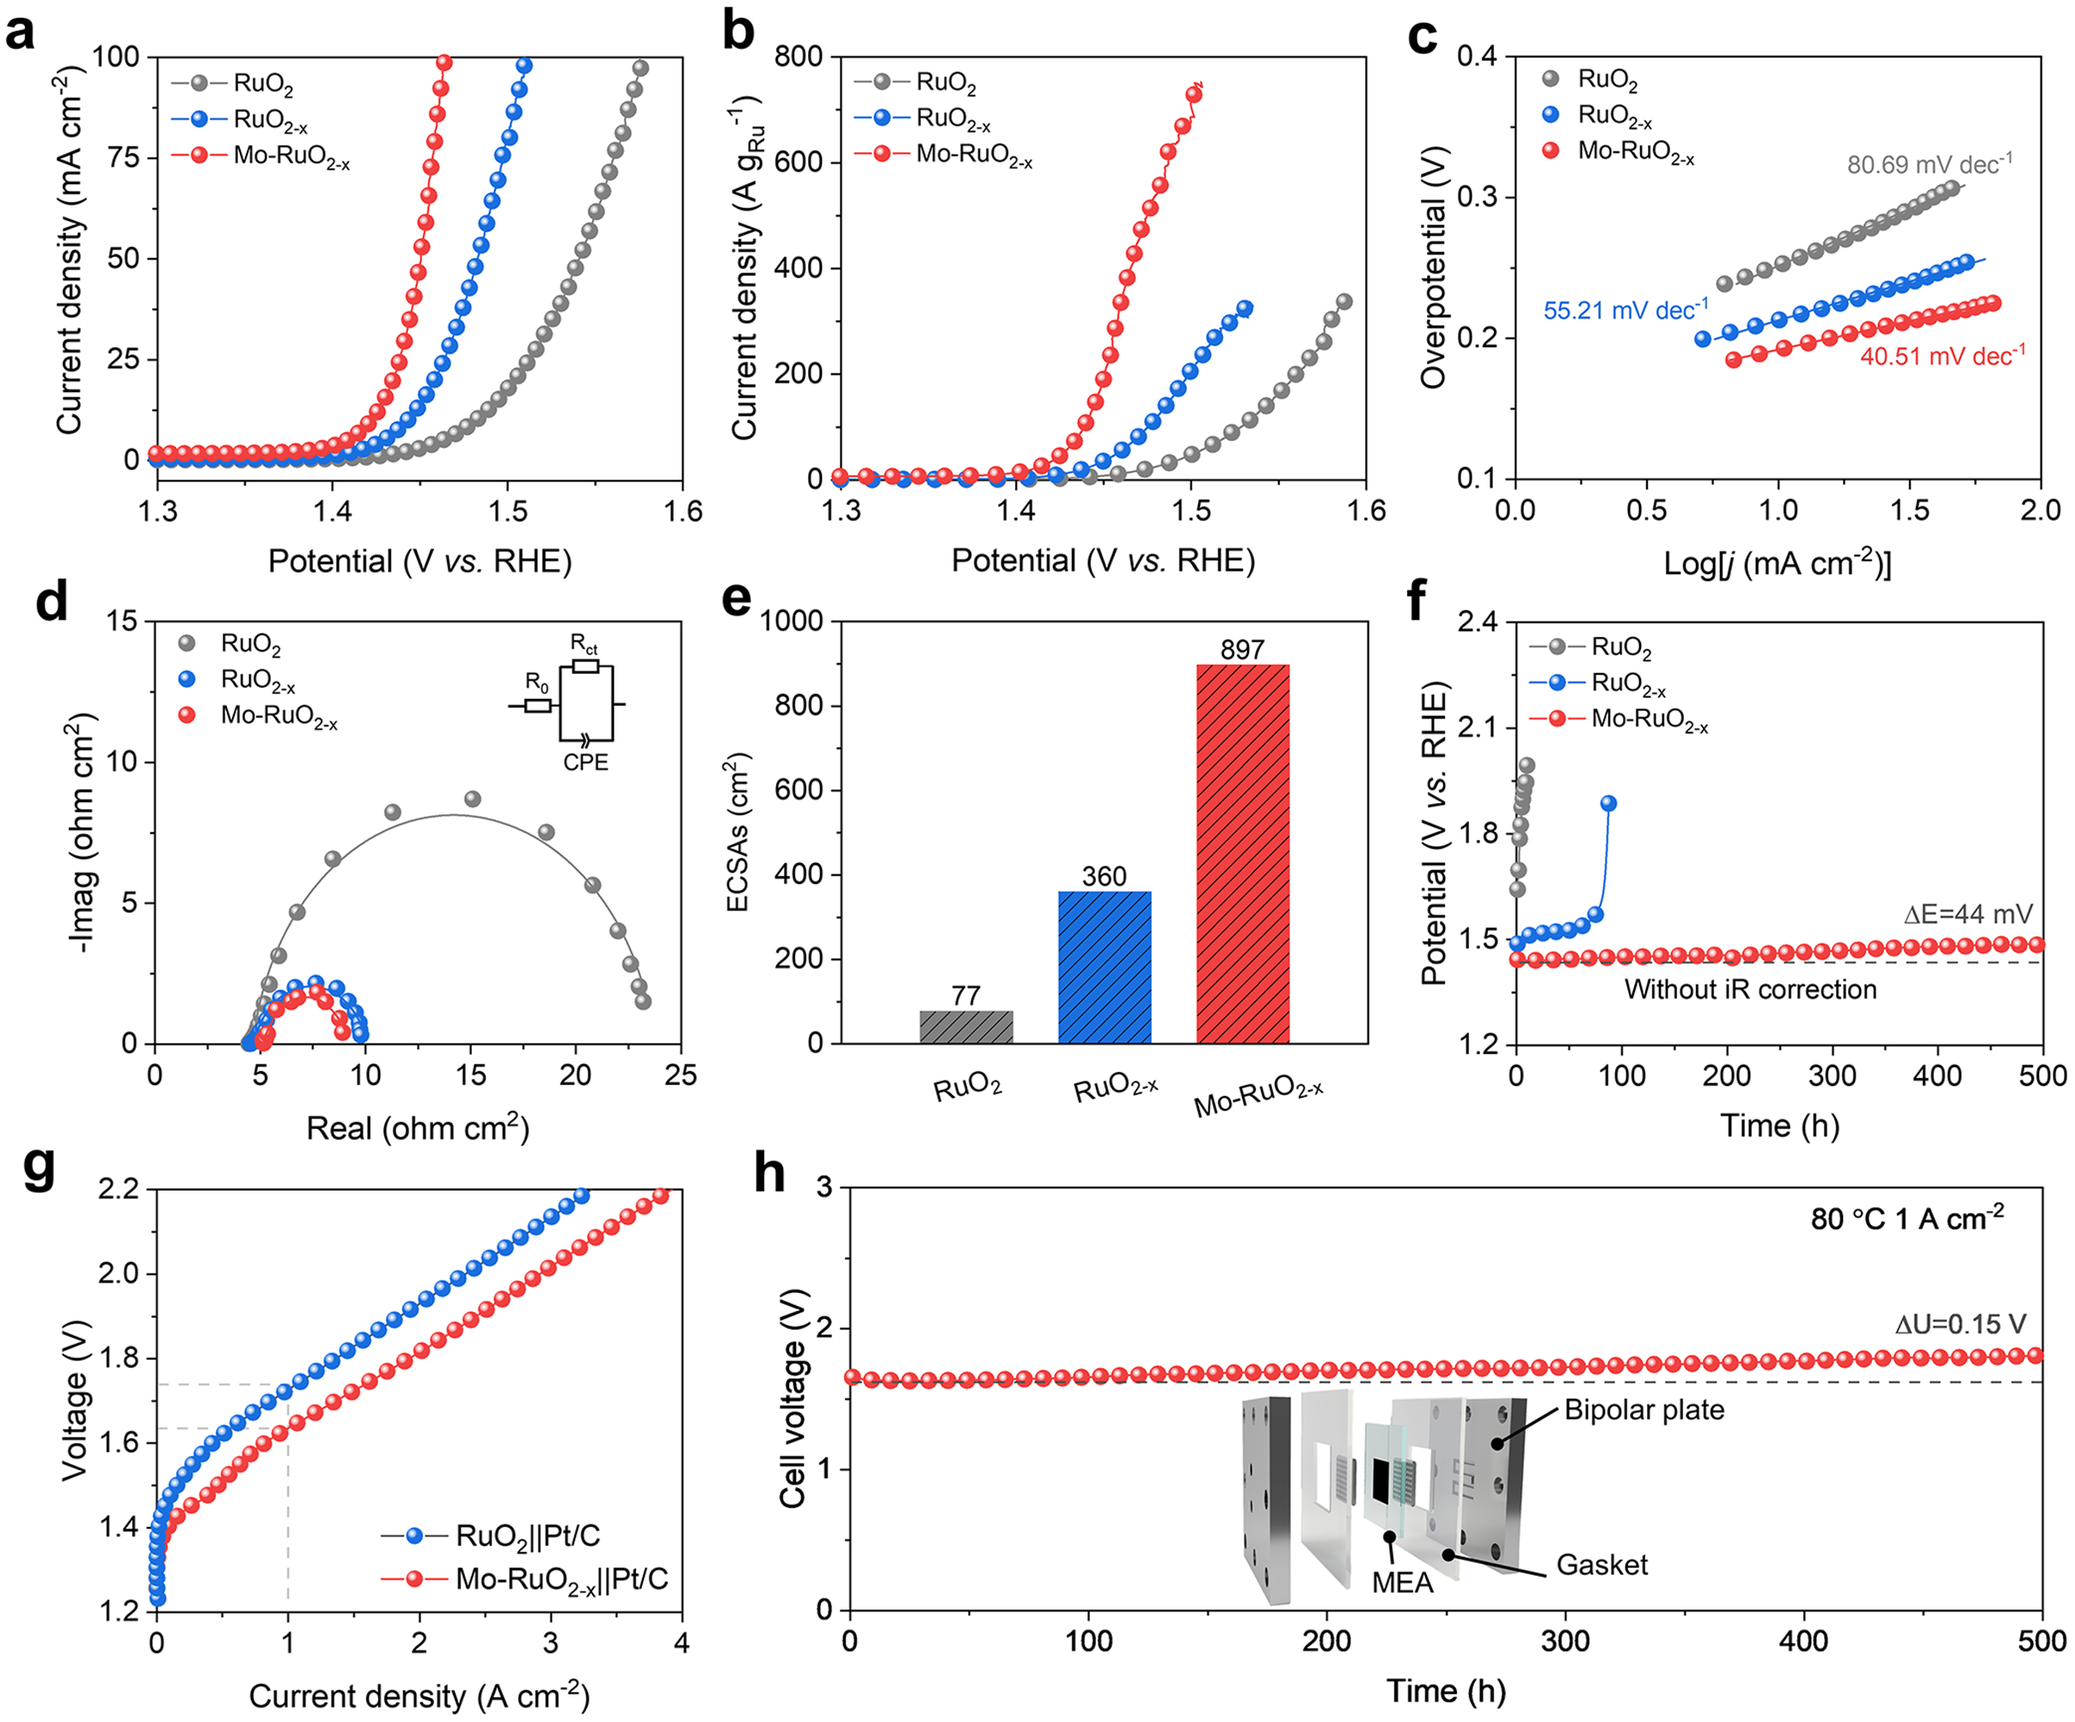
The acidic OER activity of the obtained Mo–RuO2-x electrode was evaluated in 0.5 M H2SO4 electrolyte, with a graphite rod and Hg/Hg2SO4 electrodes used as the counter and reference electrodes, respectively. The Mo–RuO2-x electrode exhibits a small OER overpotential of only 191 and 234 mV at the current densities of 10 and 100 mA cm−2 (Figure 3a), respectively, outperforming the RuO2-x (213 and 283 mV) and RuO2 (252 and 346 mV) electrodes (Figure 3a). The mass activity of Mo–RuO2-x is calculated to be 723 A gRu−1 at 1.50 V versus RHE (Figure 3b), much larger than RuO2-x (206 A gRu−1), RuO2 (89 A gRu−1) (Figure 3b), and most reported Ru-based electrocatalysts for acidic OER (Supplementary Table S3). Such great enhancement in intrinsic OER activity originated from the asymmetric Ru–Mo dual sites could be evidenced by the much reduced Tafel slope (40.51 mV dec−1) for Mo–RuO2-x as compared to RuO2 (80.69 mV dec−1) and RuO2-x (55.21 mV dec−1) (Figure 3c), suggesting the significantly improved OER kinetics, as further verified by the EIS, with the charge transfer resistance (Rct) obviously decreased from 19.07 Ω cm2 for RuO2 to 5.36 Ω cm2 for RuO2-x and then to 3.99 Ω cm2 for Mo–RuO2-x (Figure 3d and Supplementary Figure S9). This great reduction in Rct should be attributed to the significantly increased ECSAs for Mo–RuO2-x (897 cm2) relative to RuO2 (77 cm2) and even RuO2-x (360 cm2) (Figure 3e), as determined from current-scan rate plots (Supplementary Figure S10). Notably, chronopotentiometry measurements show a slight increase in the overpotentials (ΔE = 44 mV) for OER at a current density of 10 mA cm−2 during 500 h operation (Figure 3f), indicating the excellent stability of Mo–RuO2-x for acidic OER, with the incorporated Mo atoms featured with high resistance against acid corrosion (Supplementary Figures S11 and S12). More encouragingly, the obtained Mo–RuO2-x electrode exceeds the most reported Ru-based electrocatalysts toward high activity and long-term stability for acidic OER (Supplementary Table S3).
(a) LSV plots, (b) mass activities, (c) Tafel slope, (d) EIS plots, and (e) ECSAs of RuO2, RuO2-x, and Mo–RuO2-x. (f) Chronopotentiometry measurements of RuO2, RuO2-x, and Mo–RuO2-x for stability test recorded at 10 mA cm−2. (g) Polarization curves of the Mo–RuO2-x||Pt/C and RuO2||Pt/C PEMWE. (h) Chronopotentiometry measurements of the assembled Mo–RuO2-x||Pt/C PEMWE operated at the current density of 1 A cm−2.

Figure 3. Long description
The figure consists of eight panels labeled a through h.
* Panel a: L S V line graph of Current density (m A cm super minus 2) versus Potential (V vs. R H E). The red curve (M o minus R u O sub 2 minus x) shows the steepest increase, reaching 100 m A cm super minus 2 at the lowest potential, followed by blue then grey.
* Panel b: Mass activity line graph showing Current density (A g sub R u super minus 1) versus Potential. The red curve shows significantly higher mass activity than the blue and grey samples.
* Panel c: Tafel slope plot of Overpotential (V) versus Log current density. Slopes are 80.69 m V dec super minus 1 for grey, 55.21 for blue, and 40.51 for red, indicating faster kinetics for the red sample.
* Panel d: E I S Nyquist plot showing negative imaginary versus real impedance. The red and blue samples show much smaller semicircles than the grey, indicating lower charge transfer resistance. An inset shows an equivalent circuit with R sub 0, R sub c t, and C P E.
* Panel e: Bar chart of E C S A s (cm super 2) showing values of 77 for grey, 360 for blue, and 897 for red.
* Panel f: Chronopotentiometry stability test at 10 m A cm super minus 2. The red curve remains stable at approximately 1.45 V for 500 hours, while grey and blue fail rapidly.
* Panel g: Polarization curves for P E M W E. The red curve (M o minus R u O sub 2 minus x double-bar P t slash C) maintains lower voltage across current densities up to 4 A cm super minus 2 compared to the blue curve.
* Panel h: Long-term stability of the assembled P E M W E at 1 A cm super minus 2 and 80 degrees Celsius. The cell voltage remains stable near 1.7 V for 500 hours with a small increase of 0.15 V. An inset shows an exploded view of the P E M W E assembly including Bipolar plate, Gasket, and M E A.
To evaluate the application potential of the Mo–RuO2-x electrode for industrial water splitting, the PEMWE was assembled with Mo–RuO2-x as the anode and commercial Pt/C as the cathode for water electrolysis. The Mo–RuO2-x anode catalyst was loaded on a Nafion N115 membrane to achieve the CCM, with a uniform thickness of ca. 9 μm observed from the cross-sectional SEM image (Supplementary Figure S13). The polarization curves reveal a cell voltage of 1.63 V for the Mo–RuO2-x||Pt/C PEMWE to reach the current density of 1 A cm−2 (Figure 3g), much lower than that required by RuO2||Pt/C PEMWE (1.73 V). This significant decrease in cell voltage realized over the Mo–RuO2-x||Pt/C PEMWE could be inferred from the fitted EIS plots, with Rct greatly reduced from 0.28 Ω cm2 for the RuO2||Pt/C PEMWE to 0.19 Ω cm2 for the Mo–RuO2-x||Pt/C PEMWE (Supplementary Figure S14), indicating improved kinetics for water electrolysis. The overvoltage, which includes kinetic overvoltage, ohmic overvoltage, and mass-transfer overvoltage, was then analyzed to elucidate the origin of the high-performance water electrolysis activity achieved by the Mo–RuO2-x||Pt/C PEMWE. It is observed that the kinetic overvoltage is much lower in the Mo–RuO2-x||Pt/C PEMWE than in the RuO2||Pt/C PEMWE at a current density of 1 A cm−2 (Supplementary Figure S15), suggesting the favorable reaction kinetics of the Mo–RuO2-x anode catalyst. Chronopotentiometry measurements further show that Mo–RuO2-x||Pt/C PEMWE could be stably operated at the current density of 1 A cm−2 for at least 500 h, with a voltage decay rate of 0.3 mV h−1 (Figure 3h). All the above electrochemical results demonstrate that the Mo–RuO2-x electrode, as an anode in PEMWE, exhibits excellent activity and stability for water splitting, standing among the highest levels reported for Ru-based electrocatalysts (Supplementary Table S4), which could be utilized as a promising acidic OER catalyst in industrial PEMWE.
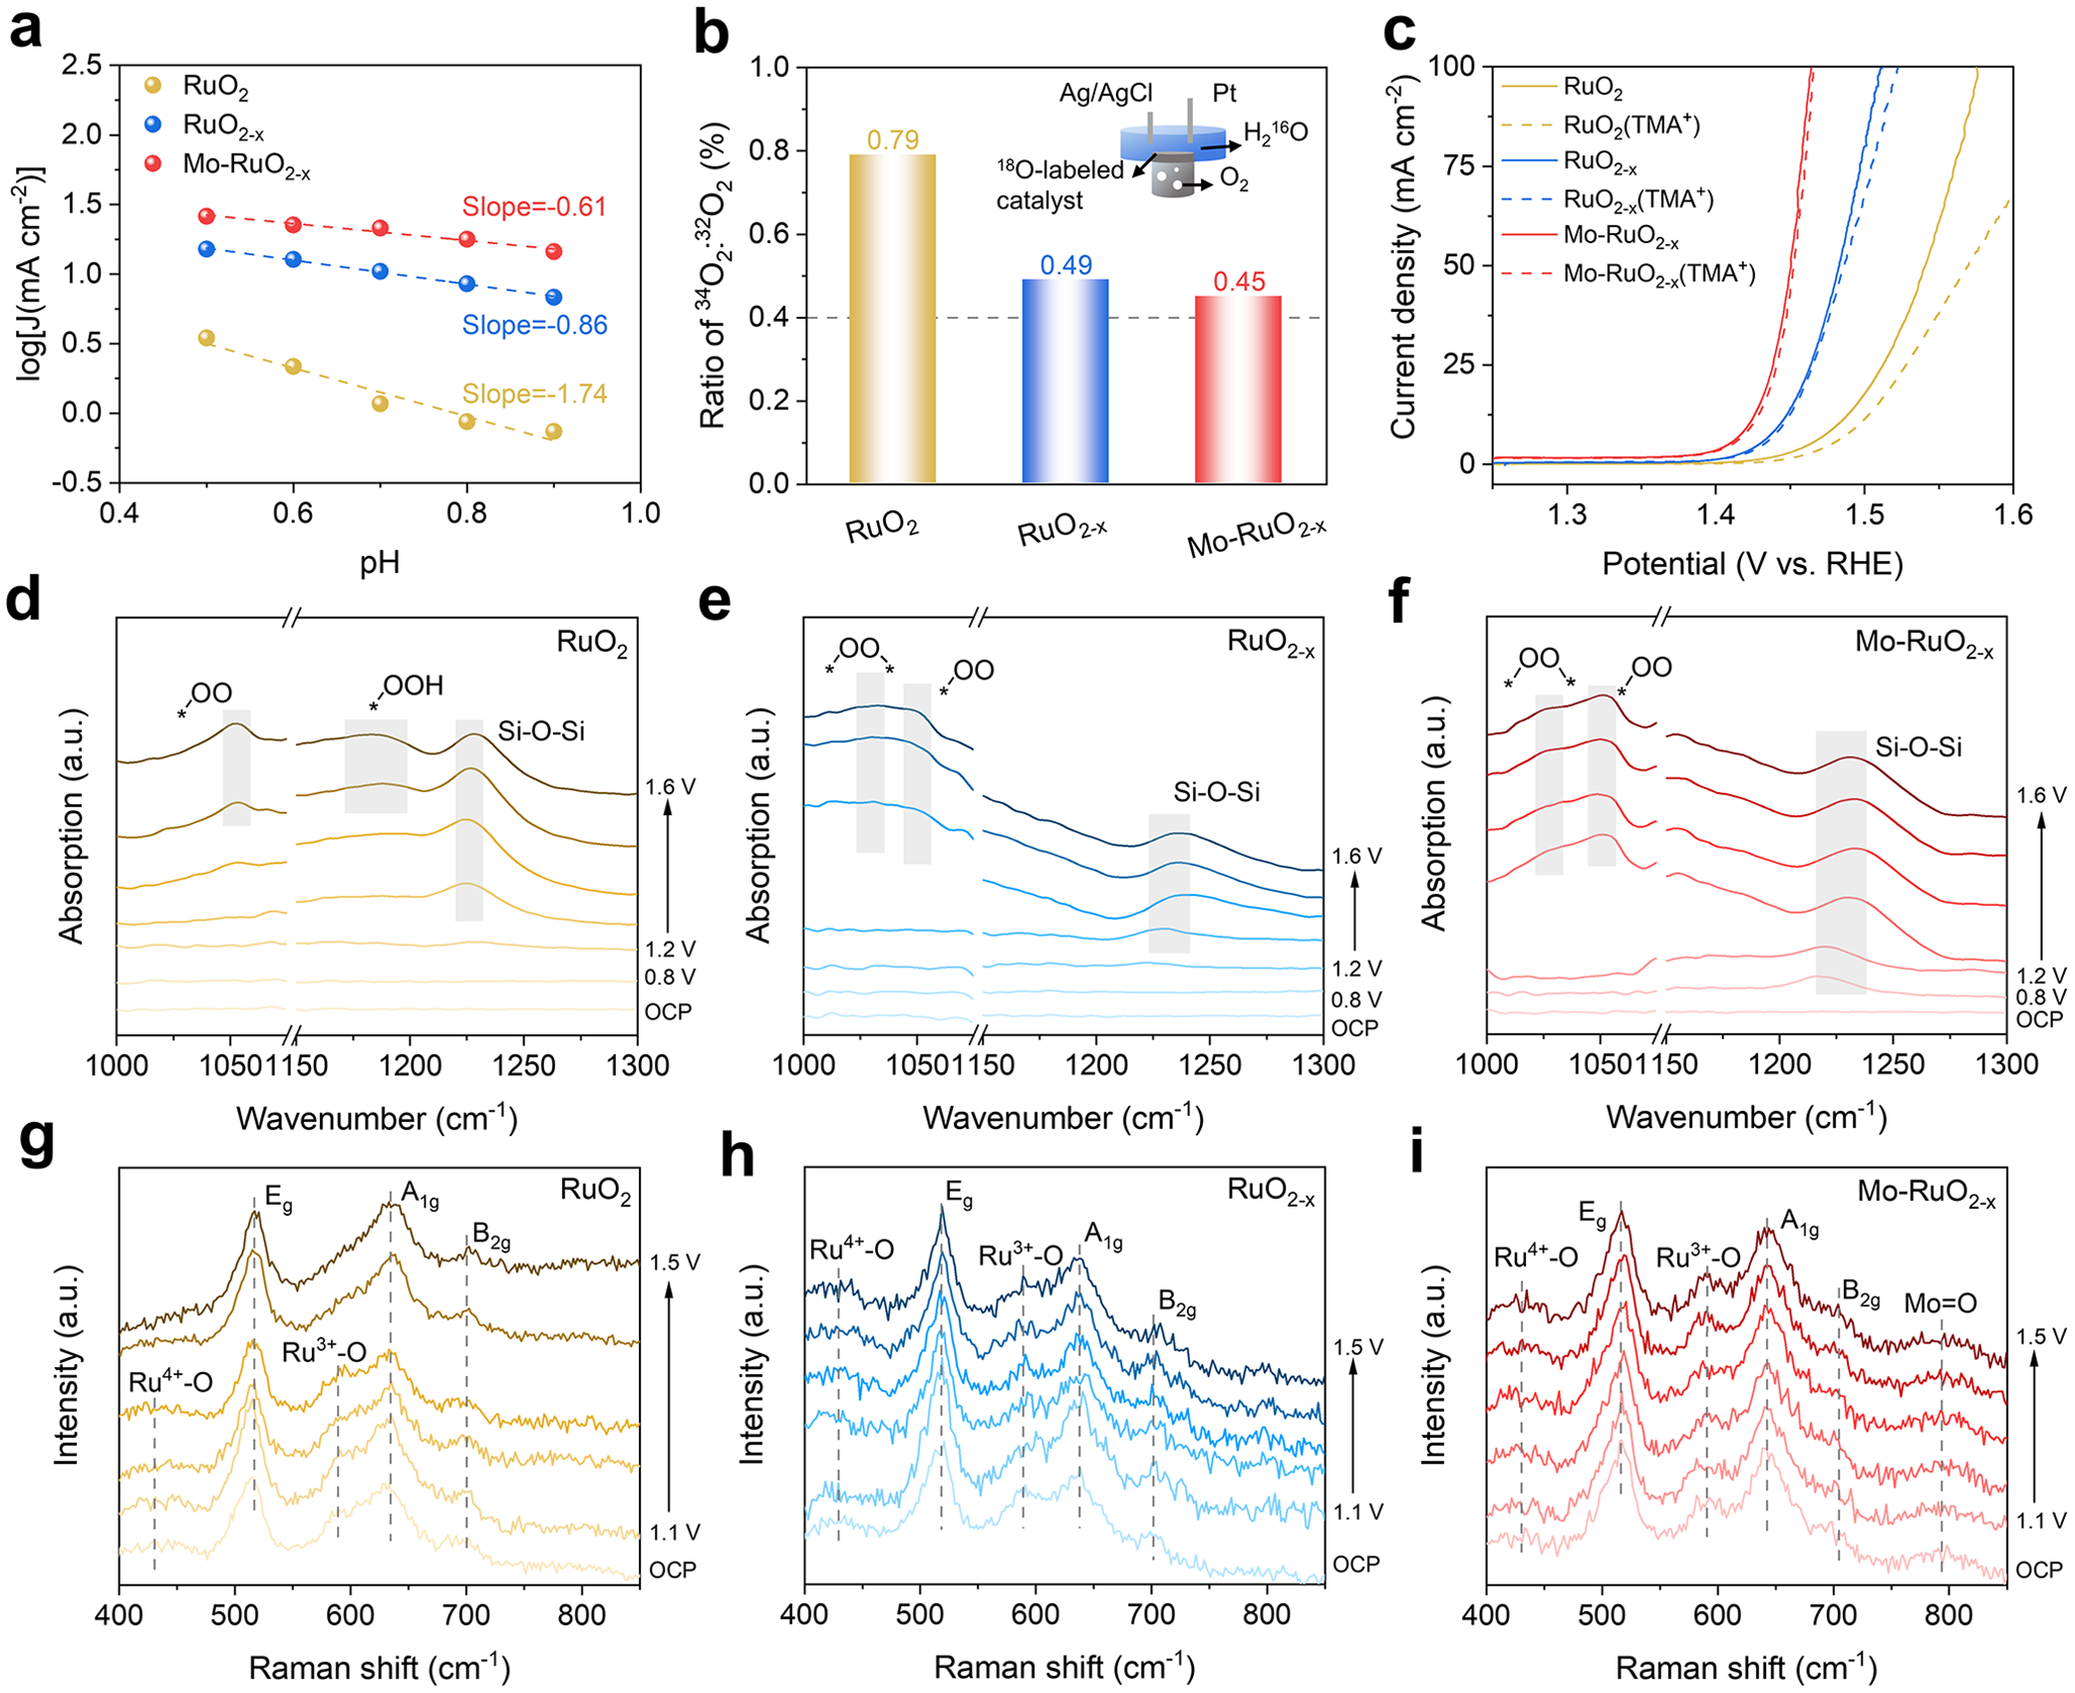
As inferred from the much improved OER stability of Mo–RuO2-x compared to RuO2 (Figure 3f), the reaction pathway for acidic OER over Mo–RuO2-x should not root in the LOM. The pH-dependent activity was then conducted and plotted to deepen the insights into the reaction pathway occurring at the RuO2-x and Mo–RuO2-x electrodes (Figure 4a and Supplementary Figure S16). At the potential of 1.45 V versus RHE for RuO2, the significant linear dependence of the logarithm of OER current density on the pH values with a slope of −1.74 (Figure 4a) suggests that RuO2 should drive OER by following the LOM via the nonconcerted proton-electron transfer (nCPET) process [Reference Giordano, Han and Risch48]. In comparison, the logarithm of OER current density displays a reduced linear dependence on pH values with a slope of −0.86 and − 0.61 for RuO2-x and Mo–RuO2-x (Figure 4a), respectively, indicating that OER happens with the AEM or OPM via the concerted proton-electron transfer (CPET) process [Reference Liu, Shen and Liang49]. The reaction pathway with oxygen atoms for O2 generation was then investigated by in situ DEMS, with electrodes labelled with isotope 18O (Figure 4b and Supplementary Figure S17). It is noted that with OER happening in H216O serving as the solvent, the reaction pathway following AEM or OPM should generate 32O2 through the coupling of two 16O atoms from H216O, while the reaction pathway following LOM would create 34O2 by coupling one 18O atom from the catalyst lattice with another 16O from H216O. Therefore, the reaction pathway could be distinguished by analyzing the integral area ratio of 34O2/32O2 from the DEMS measurements. It is revealed that the integral area ratio of 34O2/32O2 for RuO2-x and Mo–RuO2-x is calculated to be 0.49% and 0.45% (Figure 4b), respectively, very close to the natural isotopic abundance (0.41%) [Reference Mu, Fan and Gao9], indicating that AEM or OPM should dominate on the RuO2-x and Mo–RuO2-x electrocatalysts for acidic OER. In contrast, a much higher integral area ratio of 34O2/32O2, detected at 0.79% for RuO2 (Figure 4b), implies the involvement of the LOM in the acidic OER over RuO2. To further identify LOM occurring at RuO2, the tetramethylammonium cation (TMA+) was used to probe the O22− intermediates derived via LOM, due to its strong interaction with negative oxygenated species [Reference Yao, Jia and Zhu50]. As shown in Figure 4c, with TMA+ added to the electrolyte, the OER activity displays a much more significant decrease for RuO2 than RuO2-x and Mo–RuO2-x, evidencing that the OER happening on RuO2 should follow LOM.
(a) Logarithm of OER current densities at 1.45 V versus RHE plotted with different pH values for RuO2, RuO2-x and Mo–RuO2-x. (b) Integral area ratio of 34O2/32O2 for RuO2, RuO2-x, and Mo–RuO2-x, as determined by DEMS measurements. (c) LSV curves of RuO2, RuO2-x, and Mo–RuO2-x measured in 0.5 M H2SO4 with/without 0.01 M TMA+. ATR-SEIRAS spectra of oxygen-containing intermediates over (d) RuO2, (e) RuO2-x, and (f) Mo–RuO2-x in 0.5 M H2SO4, collected from OCP to 1.6 V versus RHE in a three-electrode system. In situ Raman spectra of metal-oxygen bonds at (g) RuO2, (h) RuO2-x, and (i) Mo–RuO2-x in 0.5 M H2SO4, collected from OCP to 1.5 V versus RHE in a three-electrode system.

Figure 4. Long description
A multi-panel figure with nine panels labeled a through i.
Panel a is a line graph of log J versus p H. Three linear trends show decreasing current density as p H increases from 0.5 to 0.9. Mo-Ru O sub 2-x (red) has the highest values and shallowest slope of minus 0.61, followed by Ru O sub 2-x (blue, slope minus 0.86) and Ru O sub 2 (gold, slope minus 1.74).
Panel b is a bar chart showing the ratio of 34 O sub 2 to 32 O sub 2. Ru O sub 2 is highest at 0.79, Ru O sub 2-x is 0.49, and Mo-Ru O sub 2-x is 0.45. An inset schematic shows an 18 O-labeled catalyst in a cell with Ag forward slash Ag Cl and P t electrodes.
Panel c is an L S V curve showing current density versus potential. Mo-Ru O sub 2-x reaches 100 m A per cm squared at the lowest potential, approximately 1.45 V versus R H E. Solid lines represent base electrolyte and dashed lines represent electrolyte with T M A super plus.
Panels d, e, and f are A T R-S E I R A S spectra showing absorption versus wavenumber from 1000 to 1300 inverse centimeters. As potential increases from O C P to 1.6 V, peaks emerge for star O O, star O O H, and Si-O-Si. Mo-Ru O sub 2-x shows the most distinct evolution of these intermediate species.
Panels g, h, and i are in situ Raman spectra showing intensity versus Raman shift from 400 to 850 inverse centimeters. As potential increases from O C P to 1.5 V, peaks are identified for Ru super 4 plus-O, E sub g, Ru super 3 plus-O, A sub 1 g, and B sub 2 g. Panel i for Mo-Ru O sub 2-x includes an additional peak for Mo double bond O near 800 inverse centimeters.
To distinguish the oxygen-containing intermediates generated during OER for confirmation on different reaction pathways, i.e., AEM, OPM, and LOM, in situ attenuated total refraction surface-enhanced infrared spectroscopy (ATR-SEIRAS) was performed over these obtained electrocatalysts. With the potentials increasing from 1.4 V to 1.5 V versus RHE, a significant peak located at ca. 1050 cm−1 (Figure 4d–f) could be observed on all the electrodes, attributed to the OO* intermediates adsorbed at Ru sites before O2 release in LOM or OPM (Supplementary Table S5) [Reference Jia, Wang and Yan51]. It is noted that one weak peak at ca. 1190 cm−1 also appears in RuO2 (Figure 4d) at 1.5 V versus RHE, assigned to the OOH* intermediates (Supplementary Table S5) [Reference Wu, Fu and Chang21], suggesting that AEM should be triggered on the RuO2 surface at high potentials. For RuO2-x and Mo–RuO2-x, an additional peak located at 1025 cm−1 is clearly detected at 1.3–1.6 V versus RHE (Figure 4e, f), which should be attributed to the *OO* intermediates directly coupled at the Ru–Ru/Mo dual sites (Supplementary Table S5) [Reference Lang, Li and Yang52]. Such coupled *OO* intermediates demonstrate that OPM has been activated at the oxygen vacancies of the shortened Ru–Ru/Mo dual sites, thus improving the OER activity (Supplementary Figure S18). By further noting the signal of *OO* intermediates emerging at 1.3 V versus RHE for Mo–RuO2-x, lower than 1.4 V versus RHE for RuO2-x, it is deduced that the Mo atoms dispersed in the Mo–RuO2-x lattice could accelerate the *OO* coupling process in OPM. To elucidate the underlying mechanism of the *OO* coupling process, the signals related to the metal-oxygen bonds during acidic OER were monitored by in situ Raman spectra. Three Raman bands are obviously positioned at ca. 515, 640 and 702 cm−1 (Figure 4g–i), corresponding to the Eg bending, A1g stretching, and B2g stretching vibrations of Ru–O bonds in RuO2, respectively [Reference Chen, Yu and Yu53]. With the potentials increasing from 1.3 V to 1.4 V versus RHE, two weak Raman bands attributed to the Ru4+–O and Ru3+–O bonds gradually disappear at ca. 430 and 589 cm−1 for RuO2 (Figure 4g), [Reference Zhang, Li and Yong42], respectively, which implies the over-oxidation of Ru sites with soluble high-valence Ru species formed over RuO2, responsible for the deactivation of OER (Figure 3f). In comparison, both RuO2-x and Mo–RuO2-x display the almost unchanged signals of Ru4+–O and Ru3+–O bonds (Figure 4h, i), suggesting the Ru–Ru/Mo dual sites stabilized by switching the reaction pathway from LOM to OPM. One would note that an additional Raman band positioned at ca. 796 cm−1 for Mo–RuO2-x (Figure 4i), which should be related to the Ag stretching vibration of Mo = O bonds [Reference Zou, Wang and Zhou54]. With the potential increased from OCP to 1.5 V versus RHE, this Mo = O signal shows negligible change, indicative of abundant oxygen radical (O*) intermediates preferentially adsorbed at the oxophilic Mo atoms, which would participate in and accelerate the *OO* coupling process at the asymmetric Ru–Mo dual sites, thereby greatly improving the OER activity. Given the Mo atoms serving as active sites with high resistance against acid corrosion, the Mo–RuO2-x electrode thus achieves a significantly enhanced OER stability as compared to RuO2-x (Figure 3f). These experimental results reveal that the oxophilic Mo incorporated into Mo–RuO2-x should preferentially adsorb the O* intermediates and then accelerate the *OO* coupling process in OPM, contributing to the improved OER activity.
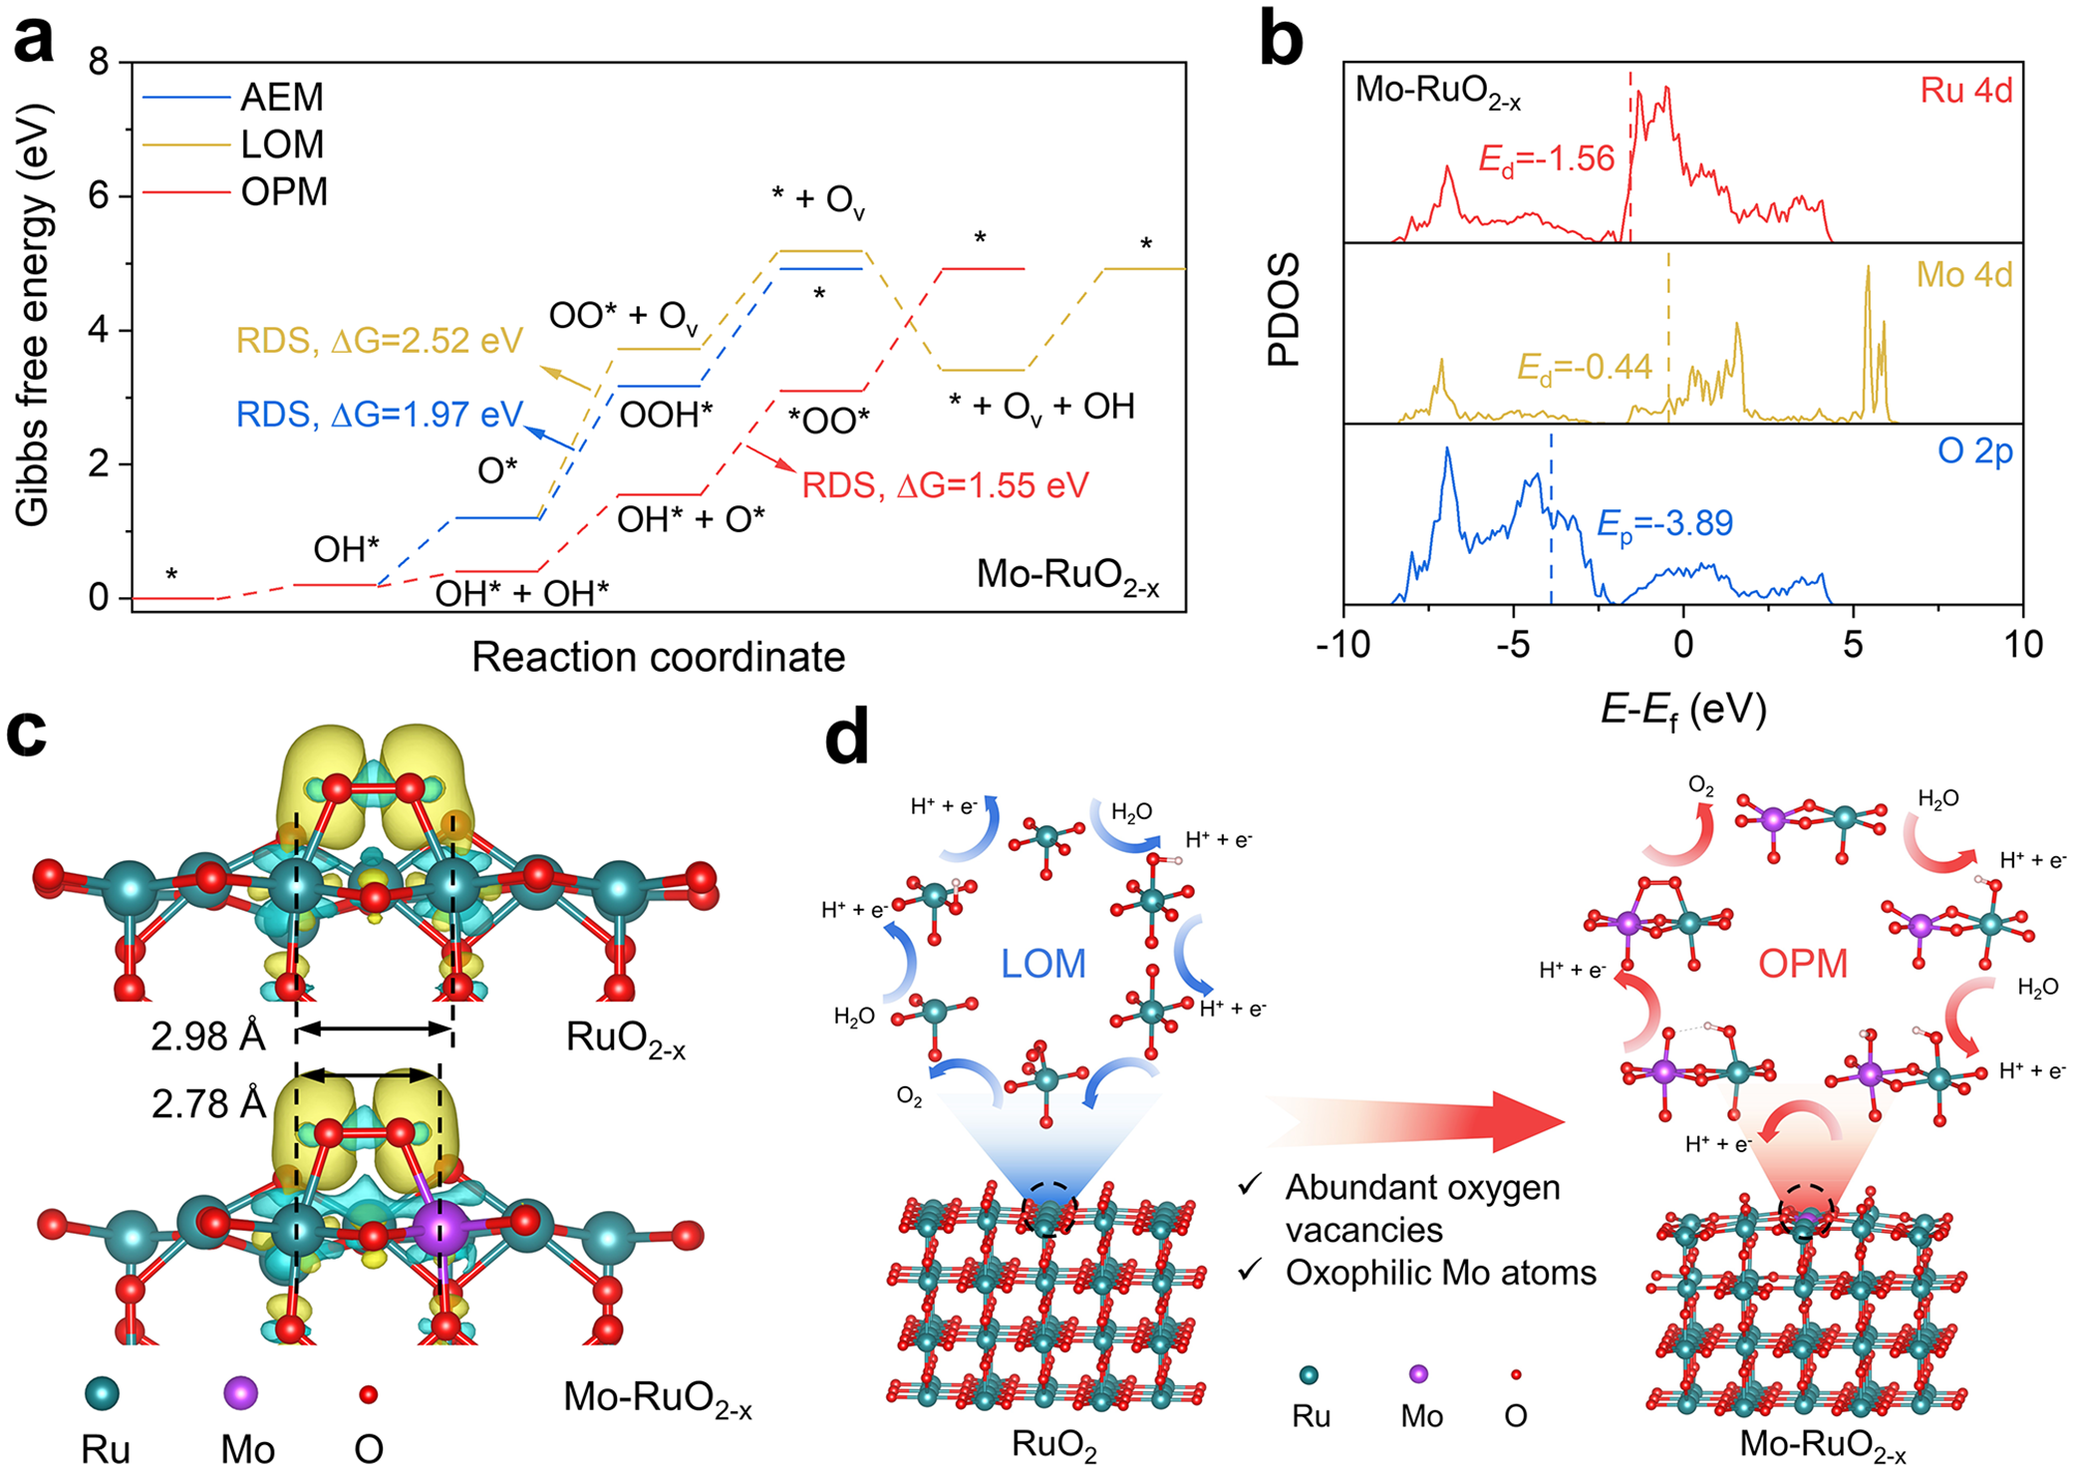
As inspired by the above analysis, the OPM could be efficiently triggered over Mo–RuO2-x incorporated with abundant oxygen vacancies and oxophilic Mo atoms for the accelerated *OO* coupling process and thus the excellent acidic OER performance. To support this experimental deduction, Gibbs free energy changes were then calculated for each elementary step over the optimized Mo–RuO2-x model structure (Supplementary Figure S19) with OER happening via AEM, LOM, and OPM (Figure 5a). It is clear that the coupling process of *OO* intermediates (OH* + O* → *OO* + H+ + e −) acts as the rate-determining step (RDS) for OPM, with energy barrier calculated to be ΔG = 1.55 eV (Figure 5a), which is much lower than those of LOM (ΔG = 2.52 eV) and AEM (ΔG = 1.97 eV), as limited by the generation of OO* intermediates from the bonding of OL and O* (O* + OL → OO* + Ov) and the generation of OOH* from O* via water dissociation (O* + H2O → OOH* + H+ + e −) (Figure 5a), respectively. By further calculating the Gibbs free energy changes for RuO2 and RuO2-x, it is observable that RuO2 should follow LOM with an energy barrier of RDS (OO* + Ov → O2 + * + Ov) of ΔG = 1.71 eV (Supplementary Figures S20a and S21), while RuO2-x should follow OPM with an energy barrier of RDS (OH* + O* → *OO* + H+ + e −) of ΔG = 1.65 eV (Supplementary Figures S20b and S21). Given the energy barrier of RDS (OH* + O* → *OO* + H+ + e −) at Ru–Mo dual sites on Mo–RuO2-x (Figure 5a) much smaller than at Ru–Ru dual sites on RuO2-x (Supplementary Figure S20b) and Mo–RuO2-x (Supplementary Figure S20c), it is confirmed that the oxygen-vacancy-shortened Ru–Mo dual sites could accelerate the *OO* coupling process for the improved OER activity. The projected densities of states (PDOS) of Ru, Mo, and O atoms were further calculated to understand the *OO* coupling process at the electronic structure level. RuO2-x exhibits an obvious downshift in the O p-band centers (E p) of −3.87 eV as compared to RuO2 (−3.48 eV) (Supplementary Figures S22a and S22b), with a negligible change in the Ru d-band centers (E d, −1.57 eV for RuO2-x and −1.55 eV for RuO2), suggesting that oxygen vacancies could weaken the Ru-O covalency for inhibiting the LOM [Reference Yang, An and Yu55]. With oxophilic Mo incorporated into Mo–RuO2-x, the calculated PDOS reveals E d of −1.56 eV for Ru atoms and E p of −3.89 eV for O atoms in Mo–RuO2-x (Figure 5b), very similar to RuO2-x (Supplementary Figure S22b), indicating that the incorporated Mo atoms should not significantly disturb the electronic structure of RuO2-x, as supported by the previous XPS and XANES analysis (Figure 2a–h). One could further note a much higher E d (−0.44 eV) for Mo atoms than Ru atoms (−1.56 eV) in Mo–RuO2-x, which demonstrates that the Mo sites featured with high oxophilicity would preferentially adsorb O* intermediates to accelerate the *OO* coupling process at the asymmetric Ru–Mo dual sites (Supplementary Figure S23), well matching the in situ Raman spectra (Figure 4g–i). Differential charge density patterns were performed to reveal the charge transfer behaviors in the *OO* coupling process (Figure 5c). With charge accumulated at the *OO* intermediates, the Ru–Mo dual sites in Mo–RuO2-x present a more delocalized charge depletion as compared to the Ru–Ru dual sites in RuO2-x (Figure 5c), which should be related to the shorter interatomic distance for Ru–Mo (2.78 Å) in Mo–RuO2-x than Ru–Ru (2.98 Å) in RuO2-x. This structural feature then enables efficient charge transfer and the accelerated *OO* coupling process at the surface of Mo–RuO2-x. These theoretical analyses conclude that the oxygen-vacancy-shortened Ru–Mo dual sites activate the OPM by leveraging the oxophilic nature of Mo atoms to stabilize O* intermediates, which facilitates the *OO* coupling process (Figure 5d) and reduces the energy barrier for OPM, consequently improving the acidic OER activity.
(a) Calculated Gibbs free energy diagrams for OER over Mo–RuO2-x following AEM, LOM, and OPM. (b) Projected density of states of Ru 4d, Mo 4d, and O 2p orbitals calculated for Mo–RuO2-x. (c) Differential charge density patterns of *OO* intermediates adsorbed at the Ru–Ru dual sites in RuO2-x (upper) and Ru–Mo dual sites in Mo–RuO2-x (bottom). The yellow and cyan contours represent electron accumulation and depletion regions, respectively. (d) Schematic illustration of LOM for OER over RuO2 and OPM for OER over Mo–RuO2-x.

Figure 5. Long description
Panel a: A line graph of Gibbs free energy in e V versus reaction coordinate. Three paths are shown: A E M in blue, L O M in yellow, and O P M in red. The O P M path shows the lowest rate-determining step energy of Delta G equals 1.55 e V, compared to 1.97 e V for A E M and 2.52 e V for L O M.
Panel b: Stacked P D O S plots for Ru 4d, Mo 4d, and O 2p orbitals. The x-axis is E minus E sub f in e V from minus 10 to 10. Vertical dashed lines mark the d-band centers: E sub d equals minus 1.56 for Ru 4d and E sub d equals minus 0.44 for Mo 4d. The O 2p p-band center E sub p is at minus 3.89.
Panel c: Two molecular models showing differential charge density. The top model for Ru O sub 2 minus x shows a Ru-Ru distance of 2.98 Angstroms. The bottom model for Mo-Ru O sub 2 minus x shows a Ru-Mo distance of 2.78 Angstroms. Yellow clouds indicate electron accumulation and cyan clouds indicate depletion around the star O O star intermediates.
Panel d: Two cyclic reaction schematics. On the left, Ru O sub 2 follows the L O M cycle. On the right, Mo-Ru O sub 2 minus x follows the O P M cycle. A large red arrow points from the L O M side to the O P M side, accompanied by text noting abundant oxygen vacancies and oxophilic Mo atoms. Legend at the bottom identifies teal spheres as Ru, purple as Mo, and red as O.
4. Conclusion
In summary, highly oxophilic Mo atoms were atomically dispersed in the oxygen-vacancy-enriched RuO2 lattices through molten salt treatment. The optimized Mo–RuO2−ₓ electrocatalyst achieves a low OER overpotential of 191 mV at 10 mA cm−2 and exhibits remarkable stability exceeding 500 h. Impressively, the PEMWE assembled with Mo–RuO2-x as the anode and Pt/C as the cathode could be operated stably for at least 500 h at the industrial-level current density of 1 A cm−2, with a cell voltage of 1.63 V. It is experimentally and theoretically revealed that the oxygen-vacancy-shortened Ru–Mo dual sites effectively activate the OPM, with oxophilic Mo possessing a higher d-band center than Ru, which favors the adsorption of O* intermediates and accelerates the *OO* coupling process at the asymmetric Ru–Mo dual sites, thereby improving the acidic OER performance. This study demonstrates a promising approach for the regulation of the *OO* coupling process at dual sites via lattice and oxophilicity engineering, and guides the design of applicable Ru-based electrocatalysts for industrial-level PEMWE.
Open peer review
To view the open peer review materials for this article, please visit http://doi.org/10.1017/S2978169826000045.
Supplementary material
To view supplementary material for this article, please visit http://doi.org/10.1017/S2978169826000045.
Author contributions
Conceptualization: H.D. and S.S; Funding acquisition: S.S; Investigation: H.D.; Investigation (synchrotron radiation research): C-L.D., T.T.T.N.; Methodology: H.D., Y.W., Y.W.; Project administration: S.S.; Resources: S.S.; Supervision: S.S.; Writing – original draft: H.D.; Writing – review: S.S.
Financial support
The authors thank the financial support from the National Natural Science Foundation of China (Grant No. 52488201, 52225606), the Key R&D Program of Shaanxi Province (No. 2024CY-GJHX-28), and the Leadership Talent Program (Science and Education) of SIP.
Competing interests
The authors declare that they have no competing interests.
Data availability statement
The data of this work are available from the corresponding author upon reasonable request.


 Open access


Comments
Dear Tierui Zhang,
Enclosed please find our manuscript, “Oxygen Vacancy Shortened Oxophilic Mo-Lattice Ru Dual Sites in Ruthenium Oxide with Accelerated Oxygen-Oxygen Radical Coupling for Efficient Acidic Oxygen Evolution Reaction”, submitted for its possible publication as a Research Article in Cambridge Materials: Energy.
Replacing expensive Ir (~US$140 gIr<sup>-1</sup>) with Ru (~US$16 gRu<sup>-1</sup>) can significantly reduce the cost of proton exchange membrane water electrolyzer (PEMWE) for green hydrogen production. However, the acidic oxygen evolution reaction (OER) pathway on Ru-based electrocatalysts usually follows the lattice-oxygen-mediated mechanism (LOM), leading to the over-oxidation and deactivation of Ru active sites, which limits the industrial development of Ru-based PEMWE. Thus, significant efforts have been devoted to steering the OER pathway of Ru-based electrocatalysts at the anode. Given that the reaction pathway is determined by the atomic coordination structure of active sites, our group has carried out some research on precisely regulating the coordination number, type, and location of active sites (Adv. Energy Mater. 2022, 12, 2200716; Adv. Energy Mater.2025, 15, 2405364; Mater. Horiz., 2026,13, 326-336), and meanwhile revealing the reaction pathway in electrochemical reactions (Angew. Chem. Int. Ed. 2023, 135, e202217369; Angew. Chem. Int. Ed. 2023, 62, e202306876; Angew. Chem. Int. Ed. 2025, 64, e202512179), aiming to enhance electrocatalytic activity and stability. In recent, the oxide path mechanism (OPM), which involves direct oxygen-oxygen radical (*OO*) coupling at dual sites, has been proposed and verified to achieve efficient and stable acidic OER on the Ru-based electrocatalysts. Nevertheless, it remains challenging to construct asymmetric Ru-M (M: heteroatoms) dual sites for accelerating the *OO* coupling process in OPM and promising the high-performance OER. Considering that the oxophilicity of asymmetric dual sites may be determinative to the *OO* coupling process, it is highly desirable to elucidate the underlying mechanism of OPM regulated by the asymmetric dual sites for the design of Ru-based electrocatalysts towards industrial-level PEMWE.
In this work, highly oxophilic Mo atoms were atomically dispersed in the oxygen vacancies enriched RuO<sub>2</sub> lattice (Mo-RuO<sub>2-x</sub>) through molten salt treatment, in which oxygen vacancies shortened Ru-Mo dual sites are constructed and responsible for the improved acidic OER. The Mo-RuO<sub>2-x</sub> electrocatalyst exhibits a low overpotential of 191 mV at 10 mA cm<sup>-2</sup> for acidic OER, and maintains a sustained operation exceeding 500 h. More excitingly, the PEMWE assembled with Mo-RuO2-x as the anode could survive from a 500-h operation at the industrial-level current density of 1 A cm<sup>-2</sup>, with a cell voltage of 1.63 V, surpassing most of the previously reported Ru-based electrocatalysts. Experimental characterizations and theoretical calculations together evidence that the oxygen vacancies shortened Ru-Mo dual sites efficiently activate the OPM, with oxophilic Mo performing a higher d-band center than Ru, which favors the adsorption of O* intermediates and accelerates the *OO* coupling process for the improved acidic OER performance. This work demonstrates an alternative approach for the regulation of OPM happened at dual sites via lattice and oxophilicity engineering, which is guidable to the design of Ru-based electrocatalysts towards industrial-level PEMWE.
The specific innovations demonstrated in this manuscript are as follows:
(1) Oxophilic Mo atoms were atomically dispersed in the oxygen vacancies enriched RuO<sub>2</sub> lattices through molten salt treatment, with the oxygen vacancies shortened Ru-Mo dual sites constructed in Mo-RuO<sub>2-x</sub>.
(2) The Mo-RuO<sub>2-x</sub> electrocatalyst exhibits a low overpotential of 191 mV at 10 mA cm<sup>-2</sup> for acidic OER, and maintains a sustained operation exceeding 500 h. More excitingly, the PEMWE assembled with Mo-RuO<sub>2-x</sub> as the anode could survive from a 500-h operation at the industrial-level current density of 1 A cm<sup>-2</sup>, with a cell voltage of 1.63 V.
(3) It is experimentally and theoretically revealed that the oxygen vacancies shortened Ru-Mo dual sites can effectively activate the OPM, with oxophilic Mo possessing a higher d-band center than Ru, which favors the adsorption of O* intermediates and accelerates the *OO* coupling process at the asymmetric Ru-Mo dual sites, consequently improving the acidic OER performance.
We confirm that this manuscript, or its content in some other form, has not been published previously by any of the authors and/or is not under consideration for publication in another journal. We also confirm that all authors have seen and approved the submission of this manuscript. We declare no competing financial interest.
Thank you very much for your time and consideration of our manuscript. If further information is needed, please do not hesitate to contact me.
Yours sincerely,
Shaohua Shen, Professor
Xi’an Jiaotong University
Email: shshen_xjtu@mail.xjtu.edu.cn.