Introduction
Minerals belonging to the eudialyte group are of practical importance as potential sources of rare and rare-earth metals (Lebedev, Reference Lebedev2003; Lebedev et al., Reference Lebedev, Shchur, Maiorov, Popova and Serkova2003; Zakharov et al., Reference Zakharov, Maiorov, Alishkin and Matveev2011; Friedrich et al., Reference Friedrich, Hanebuth, Kruse, Tremel and Vossenkaul2016; Davis et al., Reference Davis, Stopic, Balomenos, Panias, Paspaliaris and Friedrich2017; Ma et al., Reference Ma, Stopic and Freidrich2019). In particular, these minerals are the main concentrators of zirconium and important concentrators of Nb and rare-earth elements (REE) in some ultra-agpaitic igneous rocks.
The crystal structures of eudialyte-group minerals (EGMs) (Johnsen et al., Reference Johnsen, Ferraris, Gault, Grice, Kampf and Pekov2003; Rastsvetaeva et al. Reference Rastsvetaeva, Chukanov and Aksenov2012) are based on heteropolyhedral frameworks composed of the [Si9O27] and [Si3O9] rings of tetrahedra, six-membered [M16O24] rings of edge-sharing M1O6 octahedra (M1 = Ca, Na, REE, Mn, Fe2+) linked together by ZO6 octahedra (Z = Zr, Ti) and M2On polyhedra (M2 = Fe2+, Fe3+, Mn, Zr, Na; n = 4–7). Additional sites at the centres of the [Si9O27] rings are occupied by [4]Si, [6]Nb, [6]W or [6]Ti atoms. Extra-framework cations (Na+, K+, Ca2+, Sr2+, Mn2+, REE 3+, H3O+) occur at five sites (N1–5) and extra-framework anions (OH–, Cl–, F–, O2–, CO32–, SO42–, S2–) and water molecules occupy X1 and X2 sites.
The content of Ca in EGMs is highly variable. Four kinds of EGMs can be distinguished: nominally Ca-free, Ca-deficient, common and hypercalcium. In nominally Ca-free EGMs (voronkovite, ideally Na15[Na3Mn3]Fe2+3Zr3Si2(Si24O72)(OH)4Cl·H2O, and amableite-(Ce), Na15[(Ce1.5Na1.5)Mn3]Mn2Zr3□Si[Si24O69(OH)3](OH)2·H2O), the [M16O24] rings do not contain Ca-dominant sites and M1 cations are ordered in two alternating sites, M1a and M1b. In Ca-deficient EGMs (oneillite, Na15(Ca3Mn3)Fe3Zr3NbSi25O73(OH,O,H2O)5, sergevanite, Na15(Ca3Mn3)(Na2Fe)Zr3Si26O72(OH)3·H2O, raslakite, Na15(Ca3Fe2+3)(Na2Zr)Zr3Si26O73(OH)2Cl·H2O, and selsurtite, (H3O)12Na3(Ca3Mn3)(Na2Fe)Zr3□Si[Si24O69(OH)3](OH)Cl·H2O), the Ca2+ cations occur in amounts close to 3 atoms per formula unit (apfu) and alternate with smaller cations (Mn2+ or Fe2+) in the [M16O24] rings. All EGMs belonging to the Ca-free and Ca-deficient types have lowered R3 symmetry (Johnsen et al., Reference Johnsen, Grice and Gault1999; Chukanov et al., Reference Chukanov, Pekov, Zadov, Korovushkin, Ekimenkova and Rastsvetaeva2003, Reference Chukanov, Aksenov, Pekov, Belakovskiy, Vozchikova and Britvin2020, Reference Chukanov, Vigasina, Rastsvetaeva, Aksenov, Mikhailova and Pekov2022, Reference Chukanov, Aksenov, Kazheva, Pekov, Varlamov, Vigasina, Belakovskiy, Vozchikova and S.N2023; Khomyakov et al., Reference Khomyakov, Nechelyustov and Rastsvetaeva2007) whereas all other EGMs, except aqualite, (H3O)8(Na,K,Sr)5Ca6Zr3Si26O66(OH)9Cl, (Khomyakov et al., Reference Khomyakov, Nechelyustov and Rastsvetaeva2007) are characterized by R 3m or R3m symmetry.
Most EGMs belong to the common type with a single M1 site predominantly occupied by Ca and N sites mainly occupied by other cations. However, high-calcium varieties of these EGMs contain up to 7.5 Ca apfu.
In hypercalcium EGMs with Ca contents > 7.5 apfu, Ca dominates not only at the M1 site but also at one or two N sites. Currently, three hypercalcium EGMs are known: feklichevite, Na11Ca3Ca6Fe3+2Zr3NbSi25O75(OH)2·H2O (Pekov et al., Reference Pekov, Ekimenkova, Chukanov, Rastsvetaeva, Kononkova, Pekova and Zadov2001), golyshevite, Na10Ca3Ca6Fe3+2Zr3NbSi25O72(OH)3(CO3)·H2O, and mogovidite, Na9(Ca,Na)6Ca6Fe3+2Zr3□Si25O72(CO3)(OH,H2O)4 (Chukanov et al., Reference Chukanov, Moiseev, Rastsvetaeva, Rozenberg, Zadov, Pekov and Korovushkin2005). These minerals are very rare. All of them were discovered in peralkaline pegmatites of the Kovdor alkaline–ultrabasic complex with carbonatites, in the Kola Peninsula. The interaction of pegmatite-forming fluids with calcite carbonatites is considered the most likely cause of the elevated calcium content of these EGMs. As a rule, Ca- and CO32–-rich EGMs are enriched in H2O molecules, which is in agreement with the assumption on their formation as a result of low-temperature alteration of primary EGMs crystallized at the peralkaline stage. Another specific feature of the hypercalcium EGMs is the presence of CO32– groups at the X sites. In golyshevite and mogovidite, the CO32– group is a species-defining component.
Besides golyshevite and mogovidite, three more CO32–-dominant EGMs are known: odikhinchaite, zirsilite-(Ce) and carbokentbrooksite. The crystal-chemical formula of odikhinchaite is N 1–N5[Na10(Sr,Ca)3(H2O)2] M 1Ca6 M 2Mn3 ZZr3 M 3,M4[SiNb] (Si24O72) O (OH)3(CO3)·H2O (Gritsenko et al., Reference Gritsenko, Chukanov, Aksenov, Pekov, Varlamov, Pautov, Vozchikova, Ksenofontov and Britvin2020). This mineral was discovered in the Odikhincha ultrabasic-alkaline massif (Maimecha-Kotui province, Siberia) characterized by the presence of abundant carbonatites which are derivatives of the deepest magmas (Kostitsyn et al., Reference Kostitsyn, Tskhovrebova, Rass and Anosova2023). Calcite carbonatites are considered as the main source of Sr and CO32– as well as the cause of high amounts of Ca in odikhinchaite.
The other CO32–-dominant EGMs are carbokentbrooksite and zirsilite-(Ce). Their crystal-chemical formulae are N 1–N5(Na,□,REE,Ca)15 M 1Ca6 M 2Mn3 ZZr3 M 3,M4[SiNb] (Si24O74) O (OH)3 (CO3)·H2O and N 1–N5(REE,Na,□,Ca)15 M 1Ca6 M 2Mn3 ZZr3 M 3,M4[SiNb] (Si24O74) O (OH)3 (CO3)·H2O, respectively (Khomyakov et al., Reference Khomyakov, Dusmatov, Ferraris, Gula, Ivaldi and Nechelyustov2003). Both minerals contain more than 6 Ca apfu and significant Sr impurity. Carbokentbrooksite and zirsilite-(Ce) were discovered in a peralkaline rock from the Dara-i Pioz alkaline massif, Tajikistan. In Dara-i Pioz carbonatites are abundant and are characterized by a sharp predominance of LREE over HREE and high Sr:Ba ratios (Faiziev et al., Reference Faiziev, Gafurov and Sharipov2010).
All the facts show a confinement of Ca- and CO32–-dominant EGMs to alkaline complexes with abundant calcite carbonatites. This paper describes a new find of CO32–-rich, high-calcium and hypercalcium EGMs in a peralkaline pegmatite altered under the influence of carbonatite fluid, situated in the Tamazeght peralkaline complex, Central High Atlas, Morocco. This find confirms the conclusion that high contents of calcium and carbonate groups in EGMs can be considered as a marker of their alteration by carbonatite fluid.
The Eocene Tamazeght complex (initially called Bou Agrao Massif) is situated close to Midelt town, in Central High Atlas. It forms a magmatic intrusion, ∼5 × 15 km, orientated NE–SW, cutting Liasic limestones. It is composed mainly of nepheline syenites, associated with monzonites, shonkinite, ultramafics, and carbonatites (Aghchmi, Reference Aghchmi1984; Bouabdli et al., Reference Bouabdli, Dupuis and Dostal1988; Kchit, Reference Kchit1990; Marks et al., Reference Marks, Schilling, Coulson, Wenzel and Markl2008; Bouabdellah et al., Reference Bouabdellah, Hoernle, Duggen, Hauff, Klügel, Lowry and Beaudoin2010).
In the Tamazeght complex, eudialyte has been first described as a component of pegmatoid syenite from Oued Endt (Jeremine and Dubar, Reference Jeremine and Dubar1947), where it associates with orthoclase and aegirine as well as violet fluorite filling late fractures. More details about the petrography of magmatic rocks and metamorphosed limestones were given by Jeremine (Reference Jeremine1949). Tamazeght carbonatites were identified by Agard (Reference Agard1960 and Reference Agard1973), who published the first geological map.
Numerous petrographic and geochemical studies have been performed since these historical works, among which several have given information about the chemistry and petrology of eudialyte which occurs in late aegirine-rich nepheline syenite and pegmatites (Khadem Allah et al., Reference Khadem Allah, Monchoux, Fontan, Béziat and Kadar1996). The first electron microprobe analyses of eudialyte from Tamazeght were performed by Kadar (Reference Kadar1984), followed by detailed analyses of Khadem Allah (Reference Khadem Allah1993), and Schilling et al. (Reference Schilling, Marks, Wenzel and Markl2009). Halogen abundance in eudialyte is described by Wang et al. (Reference Wang, Marks, Wenzel and Markl2016). Late eudialyte alteration has been studied by Khadem Allah (Reference Khadem Allah1993) and Salvi et al. (Reference Salvi, Fontan, Monchoux, Williams-Jones and Moine2000).
Experimental methods and data processing
Infrared (IR) spectroscopic measurements were carried out at the Federal Research Center of Problems of Chemical Physics and Medicinal Chemistry, Chernogolovka. In order to obtain IR absorption spectra, powdered samples were mixed with anhydrous KBr, pelletized, and analysed using an ALPHA FTIR spectrometer (Bruker Optics) at a resolution of 4 cm–1. A total of 16 scans were collected. The IR spectrum of an analogous pellet of pure KBr was used as a reference. The assignment of IR bands was made based on the analysis of IR spectra of several tens of structurally investigated eudialyte-group minerals, in accordance with Rastsvetaeva et al. (Reference Rastsvetaeva, Chukanov and Aksenov2012).
Raman spectra were obtained at the Faculty of Geology, Lomonosov Moscow State University using an EnSpectr R532 spectrometer based on an OLYMPUS CX 41 microscope coupled with a diode laser (λ = 532 nm) at room temperature (Moscow State University, Faculty of Geology). The spectra were recorded in the range from 100 to 4000 cm–1 with a diffraction grating (1800 gr mm–1) and spectral resolution of ∼6 cm–1. The output power of the laser beam was in the range from 5 to 13 mW. The diameter of the laser spot on the sample was 5–10 μm. The back-scattered Raman signal was collected with a 40× objective; signal acquisition time for a single scan of the spectral range was 1 s, and the signal was averaged over 50 scans. Crystalline silicon was used as a standard.
Preliminary chemical analyses of EGMs and associated minerals were obtained at the Nantes University with a scanning electron microscope JEOL JSM equipped with energy dispersive spectrometer SAMx with a silicon drift detector, at an accelerating voltage of 15 kV and electron current of 0.5 nA. SEM analyses were performed directly on mineral fragments selected under the binocular and put on a brass plate.
A second set of chemical analysis was carried out at the Institute of Experimental Mineralogy RAS, Chernogolovka using a digital scanning electron microscope Tescan VEGA-II XMU equipped with an energy-dispersive spectrometer (EDS) INCA Energy 450 with semiconducting Si (Li) detector Link INCA Energy at an accelerating voltage of 20 kV, electron current of 190 pA and electron beam diameter of 160–180 nm (analyst D.A. Varlamov). Attempts to use WDS mode, with a higher beam current, were unsuccessful because of instability of the mineral under electron beam due to partial dehydration and migration of Na. This phenomenon is typical for high-hydrous sodium minerals with microporous structures. A good agreement was observed between compositional data obtained under these standard conditions and those obtained under more ‘mild’ conditions (with a current lowered to 90–100 pA and electron beam defocused to an area of 30×30 μm). The L-lines of Ta are not observed in the spectrum, which indicates the absence of detectable amounts of tantalum in the studied samples.
Elemental CHN analysis of EGMs was performed at the Federal Research Center of Problems of Chemical Physics and Medicinal Chemistry by gas chromatography of the products of their heating at 1200°C using a vario Micro CUBE automatic analyser.
Single-crystal X-ray diffraction studies were carried out at the Kurchatov Complex of Crystallography and Photonics NRC “Kurchatov Institute” using a XtaLAB Synergy R, DW system, HyPix-Arc 150 diffractometer (MoKα radiation). The CrysAlisPro software was used for further processing (CrysAlisPro, 2015). An absorption correction was introduced using the SCALE3 ABSPACK algorithm. The data obtained was loaded into the Olex2 program software (Dolomanov et al., Reference Dolomanov, Bourhis, Gildea, Howard and Puschmann2009) and the crystal structure was solved and refined by the ShelX program package (Sheldrick, Reference Sheldrick2015). Crystal data and structure refinement parameters are shown in Table 1.
Crystal data, data collection information and structure refinement details for a crystal from Tmz-1

Results
Occurrence and general appearance
The specimens studied in this work, collected in the Tamazeght massif by a Moroccan mineral prospector, were provided to us by A. Guillet, a French mineral collector and dealer, and are in the personal collection of one of the authors (Y.M.). The exact source location of these samples is unknown. The samples studied in this work are fragments of a carbonatite-related rock with a pegmatitic texture (Fig. 1a), mainly composed of calcite, fluorite and EGMs, with subordinate aegirine–augite. The EGMs form brownish-red euhedral crystals up to 2 cm long (Fig. 1b).
(a) Carbonatite-related rock with EGMs in brownish-red, with calcite and fluorite (white, not differentiated), and aegirine–augite (dark green to black). The field of view width is 10 cm. Photographer: A. Guillet. (b) Well-developed EGM crystal. The field of view width is 2.5 cm. Photographer: A. Guillet.

Two varieties of EGMs were studied: slightly altered (Tmz-1) and strongly hydrolytically altered (Tmz-2). The individuals of Tmz-1 (Fig. 1a) are cherry-red. They are Na-deficient, heterogeneous in composition (see below) and contain zones with different contents of Ca and Nb as well as inclusions of calcite and fluorapatite (Figs 2, 3). The typical empirical formula of fluorapatite inclusions is (Ca4.86Sr0.08La0.04Ce0.02)Σ5.00(PO4)2.96(CO3)0.04F0.90O0.10 (CO3 and O were calculated by stoichiometry, taking into account charge balance). Calcite has the formula (Ca0.925Mg0.030Mn0.030Fe0.015)Σ1.00(CO3).
Fragment of a EGM crystal from Sample 1 with zones having different composition: Nb-deficient (1, dark grey), Nb-rich (2, light grey) and Ca,Nb-rich reaction zones around fluorapatite (Fap) and calcite (Cc) inclusions (3 and 4, respectively). Back-scattered electron (BSE) image of a polished section.

Fluorapatite (Fap) inclusion with reaction zone of Ca,Nb-rich EGM (3) in a crystal Tmz-1 containing Nb-deficient (1) and Nb-rich (2) zones. BSE image of a polished section.

The empirical formula of aegirine–augite calculated from an average of four spot analyses based on four cations is (Na0.67Ca0.34Mg0.14Fe0.75Al0.05Mn0.04Ti0.01)Σ2.00Si2.00O6. In the ternary system aegirine–diopside–hedenbergite, it is close to Ae0.66Di0.17Hd0.17. It is to be noted that Khadem Allah et al. (Reference Khadem Allah, Monchoux, Fontan, Béziat and Kadar1996) observed a two-step trend of clinopyroxene chemistry in eudialyte-bearing syenite of Tamazeght, with increasing Na concentration, first from diopside to hedenbergite and then to a pyroxene close to Ae0.60Di0.15Hd0.25. Thus, the sample studied in this work corresponds to a late step of syenite evolution.
Tmz-2 is presented by brownish grains of strongly altered EGM. They are also heterogeneous in composition, with very low-sodium areas, and contain inclusions of calcite and zircon (Fig. 4). A detailed examination of a crystal of Tmz-2 revealed a small area composed of four unnamed complex Pb and Zr silicates (Fig. 5). One can propose, provisionally, the following formulas (Zr fixed; O calculated; H2O, OH and CO3 not determined):
EGM crystal from the sample Tmz-2. Low sodium zones are dark grey, high sodium zones are light, and central parts of the light zones are Nb-rich. Points of analyses are shown. BSE image of a polished section.

Polymineral inclusion composed of calcite (Cal) and Pb- and Zr-bearing silicates (UN1–UN4) in Tmz-2. SEM image with false colours.

UN1: Na0.9Ca6.5Pb2.02(Ce0.9La0.1)(Mn14.7Fe2.9Zn1.1Ti0.3Mg0.6)Zr2Nb0.9(Si8.5Al1.1)Cl9.0(O,OH,H2O,CO3)x;
UN2: Na0.6Ca4.9Pb0.6(Ce0.4La0.1)(Mn5.3Fe2.1Mg1.1Zn0.3Ti0.3)Zr3Nb0.8(Si11.6Al1.2P0.4)Cl3.5(O,OH,H2O,CO3)x;
UN3: Na0.5Ca4.3Pb0.2(Ce0.2La0.1)(Mn3.3Mg1.9Fe1.0Zn0.2Ti0.1)Zr6Nb0.8(Si15.3Al2.4)P0.8Cl2.8(O,OH,H2O,CO3)x;
UN4: Na0.7K0.3Ca2.6Ce0.2Pb0.5(Mn9.4Mg5.8Fe1.4Zn0.8)Zr2Nb0.2(Si18.7Al4.2)Cl2.2(O,OH,H2O,CO3)x.
These Mn- and Cl-rich, Pb-bearing Zr silicates are indicative of EGMs alteration by late hydrothermal process (Salvi et al., Reference Salvi, Fontan, Monchoux, Williams-Jones and Moine2000), probably related to post-magmatic fluorite mineralization (Achmani et al., Reference Achmani, Blaise, Chraibi, Barbarand, Brigaud and Bounajma2023).
Infrared spectroscopy
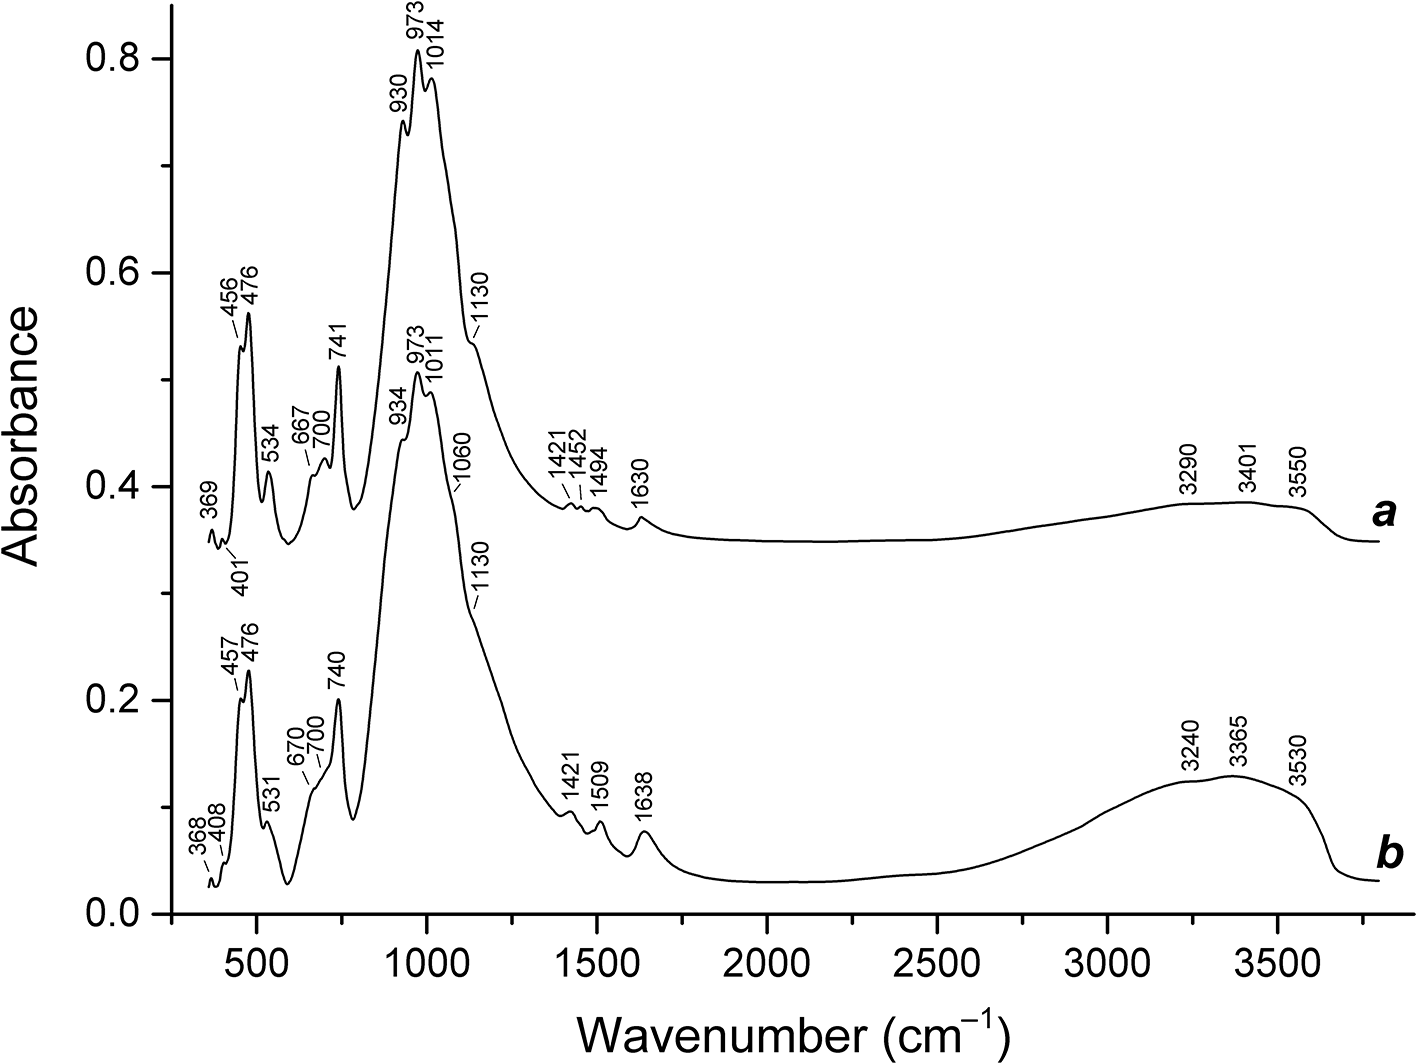
The IR spectra of Tmz-1 and Tmz-2 are given in Fig. 6. The assignment of the IR bands (Table 2) was made based on the analysis of IR spectra of several tens of structurally investigated eudialyte-group minerals partly characterized by Mössbauer spectroscopy. These data are presented in detail in the monograph by Rastsvetaeva et al. (Reference Rastsvetaeva, Chukanov and Aksenov2012). Our subsequent investigations (Chukanov et al., Reference Chukanov, Rastsvetaeva, Rozenberg, Aksenov, Pekov, Belakovsky, Kristiansen and Van2017, Reference Chukanov, Rastsvetaeva, Kruszewski, Aksenov, Rusakov, Britvin and Vozchikova2018, Reference Chukanov, Aksenov, Pekov, Belakovskiy, Vozchikova and Britvin2020, Reference Chukanov, Aksenov, Kazheva, Pekov, Varlamov, Vigasina, Belakovskiy, Vozchikova and S.N2023, Reference Chukanov, Zolotarev, Schäfer, Varlamov, Pekov, Vigasina, Belakovskiy, Aksenov, Vozchikova and Britvin2024; Zaitsev et al., Reference Zaitsev, Aksenov and Chukanov2022; Rastsvetaeva et al., Reference Rastsvetaeva, Chukanov, Zaitsev, Aksenov and Viktorova2018, Reference Rastsvetaeva, Chukanov, Möckel, Dudka and Aksenov2020a, Reference Rastsvetaeva, Chukanov, Pekov, Varlamov and Aksenov2020b, Reference Rastsvetaeva, Chukanov, Pekov and Varlamov2020c, Reference Rastsvetaeva, Chukanov and Van2020d, Reference Rastsvetaeva, Chukanov, Sipavina and Voronin2020e, Reference Rastsvetaeva, Chukanov and Lisitsin2021, Reference Rastsvetaeva, Chukanov, Pekov, Varlamov and Kazheva2022, Reference Rastsvetaeva, Chukanov, Pekov and Vigasina2023; Rastsvetaeva and Chukanov, Reference Rastsvetaeva and Chukanov2021a, Reference Rastsvetaeva and Chukanov2021b; Gritsenko et al., Reference Gritsenko, Chukanov, Aksenov, Pekov, Varlamov, Pautov, Vozchikova, Ksenofontov and Britvin2020) as well as a number of recent works completely confirmed this assignment of IR absorption bands of EGMs.
Powder infrared absorption spectra of (a) Tmz-1 and (b) Tmz-2. The spectra are offset for comparison.

Wavenumbers (cm–1) of bands in the IR and Raman spectra of the studied EGMs samples and their assignment

The most important conclusions made based on these works are as follows. The band in the range of 540–545 cm–1 in IR spectra of EGMs is related to Fe2+ in five-fold coordination (flat square) occupying the M2 site. This band is not observed in the IR spectra of Tmz-1 and Tmz-2. The bands of IVMn2+–O, VFe2+–O, and VFe3+–O stretching vibrations are observed in the range of 522–532 cm–1. There are positive correlations between the intensities of the bands at 665–702 and 928–935 cm–1 and contents of Nb and Si at the centres of nine-fold rings of SiO4 tetrahedra (the sites M3 and M4, respectively). Incorporation of acid H3O+ groups into the structures of EGMs results in enhanced absorption in the range of 3200–3300 cm–1. Carbonate and basic hydroxyl groups situated on the three-fold axis of the EGMs structures absorb in the ranges of 1450–1510 and 3510–3570 cm–1. The IR band at 720–760 cm–1 (so-called ‘ring band’ corresponding to a mixed mode involving stretching and bending internal coordinates) is typical for silicates with isolated rings of SiO4 tetrahedra (members of the eudialyte and labuntsovite groups, catapleiite, wadeite etc.). In IR spectra of eudialyte-group minerals this band is observed in the range of 739–745 cm–1. Wavenumbers of Si–O stretching and O–Si–O bending vibrations of rings of SiO4 tetrahedra are in the ranges of 960–1160 and below 500 cm–1, respectively. Bands of O–Si–O bending vibrations are partly overlapping with bands of lattice modes involving VIM–O stretching vibrations.
The IR spectrum of Tmz-2 differs from that of Tmz-1 in higher intensities of the bands of O–H stretching and H–O–H bending vibrations.
Raman spectroscopy
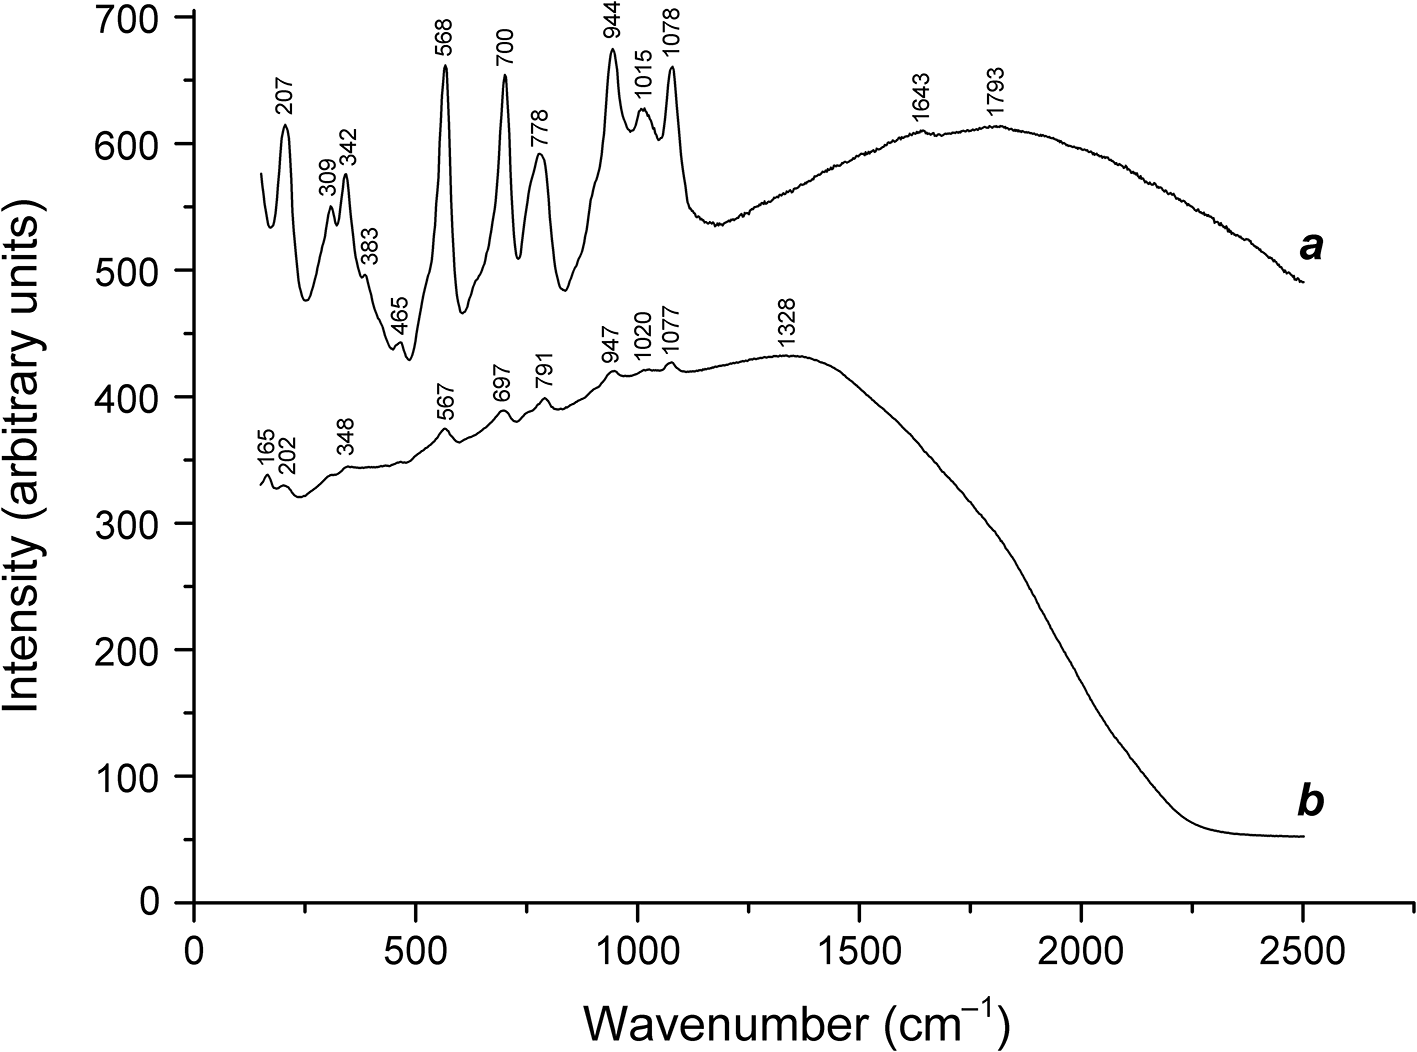
Raman shifts of Tmz-1 and Tmz-2 (Fig. 7) are similar, but these samples vary greatly in the nature and intensity of the luminescence they exhibit. The Raman spectrum of Tmz-1 is characterized by moderate luminescence with a maximum at ∼1800 cm–1 whereas luminescence observed in the Raman spectrum of Tmz-2 is very strong and has the maximum intensity at 1328 cm–1. The most probable luminescence centres are Fe3+, rare-earth elements (REE) as well as Mn2+ in calcite inclusions.
Raman spectra of (a) Tmz-1 and (b) Tmz-2.

The assignment of most Raman bands (Table 2) was made tentatively by analogy with IR spectra. The Raman band at 567–568 cm–1, which is not observed in the IR spectra, was assigned to the symmetric Zr–O stretching mode of ZrO6 octahedra because this mode is forbidden in the IR spectra. An indistinct feature at 1793 cm–1 was assigned to bending vibrations of H3O+ cations by analogy with hydronium EGMs (Chukanov et al., Reference Chukanov, Vigasina, Rastsvetaeva, Aksenov, Mikhailova and Pekov2022).
Chemical composition
During the preliminary SEM examination, two spot analyses were obtained on distinct EGM crystals. Corresponding empirical formulas based on 26 Si+Al+Nb apfu are as follows:
Tmz-1: (Na10.9K0.4)(Ca6.6Mg0.3)(Mn1.0Fe1.7)Zr3.1(Si25.3Al0.4Nb0.3)P0.5Cl0.8(O,OH,H2O,F,CO3)x;
Tmz-2: (Na4.7K0.5)(Ca8.2Mg0.3)(Mn2.4Fe1.6Ti0.1)Zr3.2(Si24.9Nb1.08Al0.4)P1.0Cl1.1(O,OH,H2O,F,CO3)x.
Analytical data for different zones in Tmz-1 (electron microprobe analyses of a polished section) are given in Table 3. Based on IR spectroscopy data, all iron is considered as Fe3+. Contents of other elements with atomic numbers > 8 are below detection limits.
Chemical composition of different zones in Tmz-1

Two kinds of the main zones (with > 0.58 and < 0.58 Nb apfu) can be distinguished in Tmz-1 (Fig. 2). The reaction zones around fluorapatite and calcite in Tmz-1 are characterized by the highest calcium content. The averaged analytical data for these zones correspond to a hydrolysed (Na-deficient), Mn-dominant (with Mn > Fe) analogue of feklichevite with the simplified formula Ca3(Na,K)9(H3O)3Ca6Zr3(Mn2+,Fe3+,Zr)3(Nb,□)Si(Si24O72)(OH,H2O)5(F,Cl)2/3(CO3)1/3. The crystal-chemical formula for the studied single-crystal fragment of Tmz-1 was derived based on the single-crystal structural data (see below).
In Tmz-2, contents of most components vary in wide limits: Na2O 3.49–8.64, K2O 0.65–0.99, CaO 10.68–15.39, MnO 2.16–5.61, Fe2O3 3.24–5.21, La2O3 0.06–2.27, Ce2O3 0.12–1.90, Nd2O3 below detection limit (bdl)–0.71, Al2O3 bdl–0.38, SiO2 45.85–49.32, TiO2 0.13–0.54, ZrO2 12.09–14.88, HfO2 bdl–0.73, Nb2O5 1.49–4.82, SO3 0–0.34, F bdl–1.56, Cl 0.02–0.78, O=(F,Cl) 0.68–0.81, total 90.24–98.23 wt.%. No distinct zones could be selected in Tmz-2. For this reason, chemical data for Tmz-2 are presented only as correlations. The contents of H2O and CO2 determined by elemental CHN analysis are 3.24 and 0.45 wt.% in Tmz-1, and 5.83 and 0.72 wt.% in Tmz-2, respectively.
Thus, EGMs in Tmz-1 and Tmz-2 are Ca- and Mn-rich, with Ca > 6.6 apfu and Mn + Fe > 3.6 apfu which is unusual for the EGMs. In both samples, La dominates among REE.
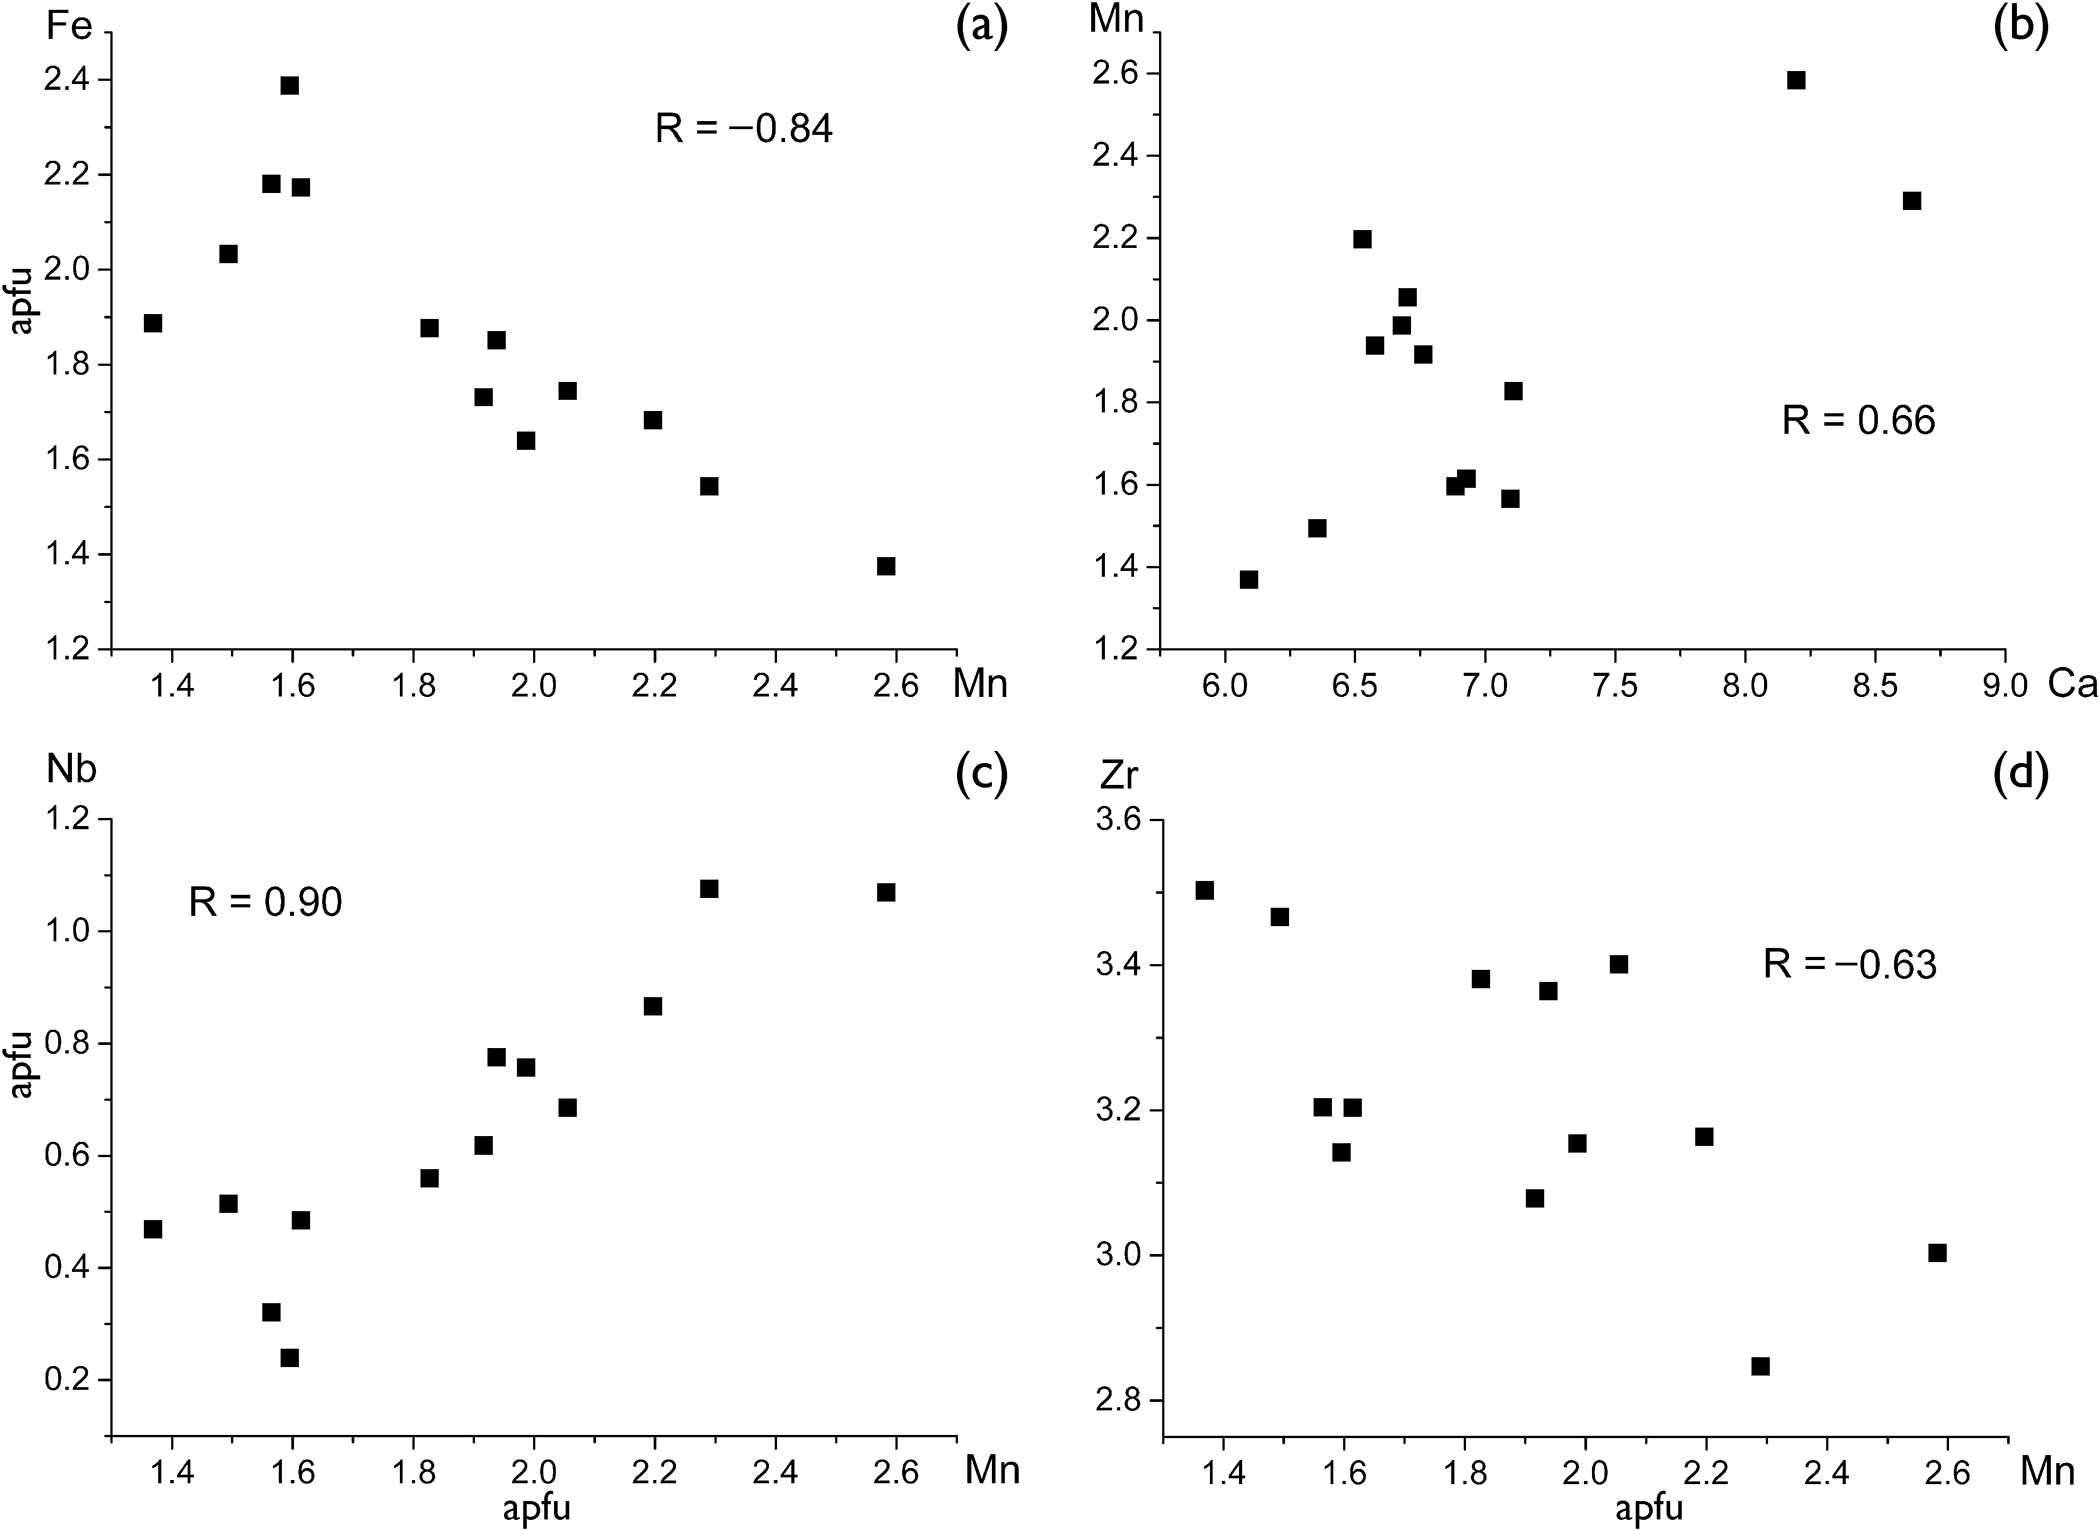
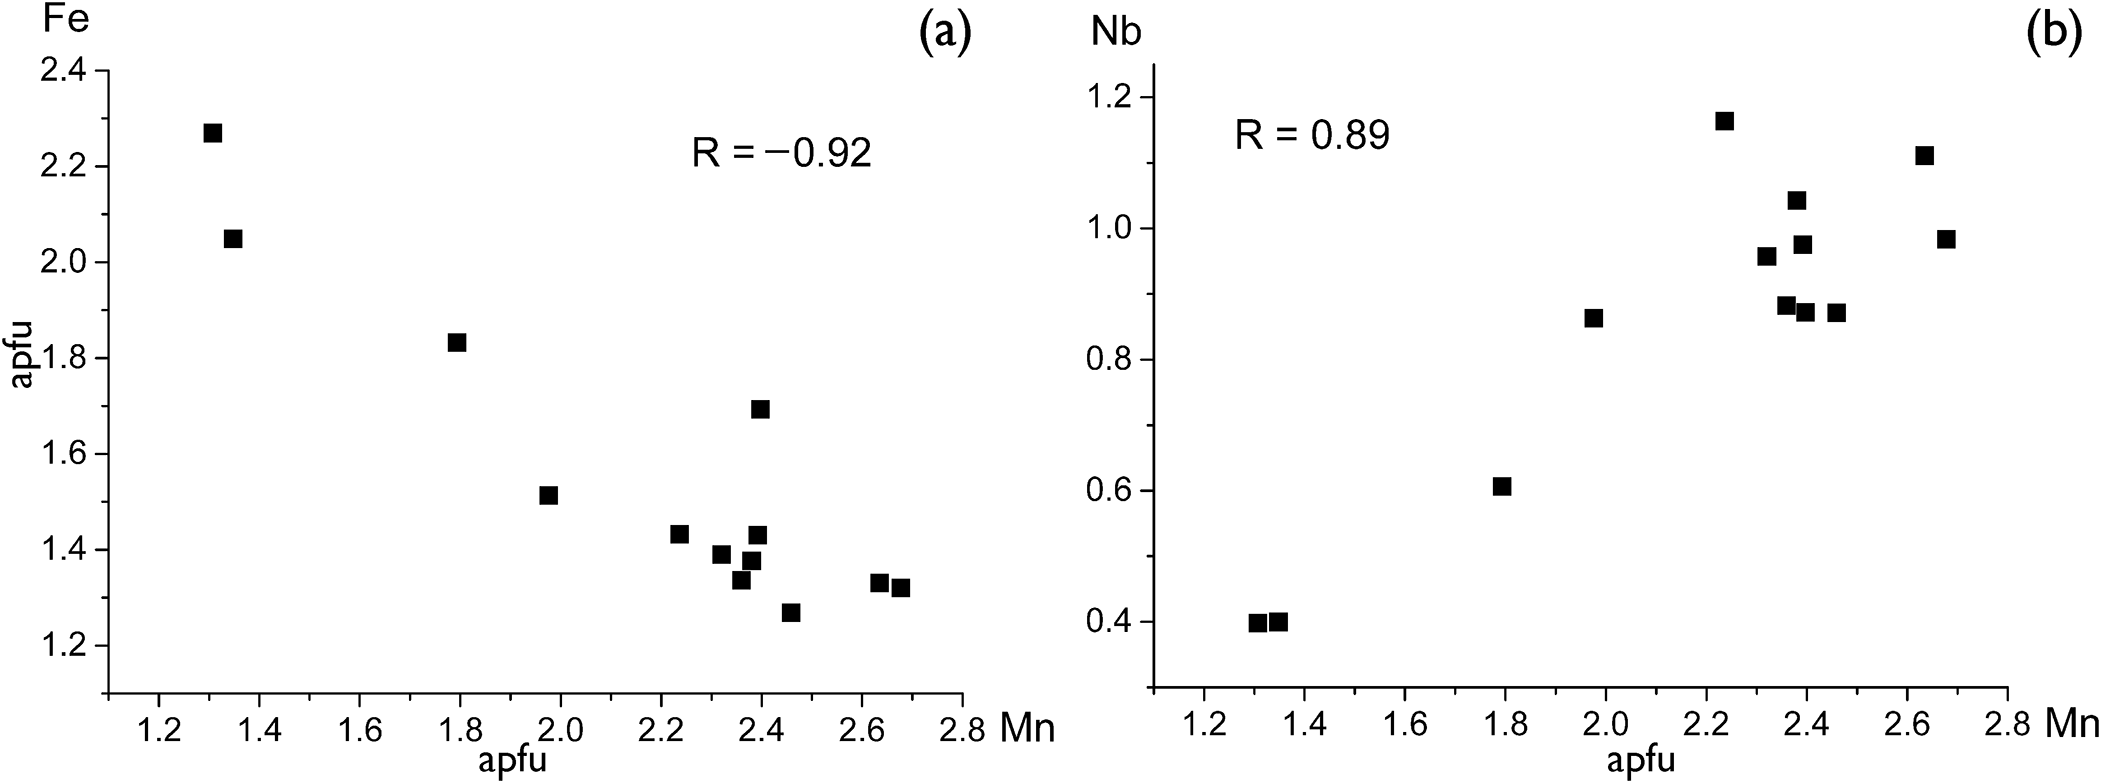
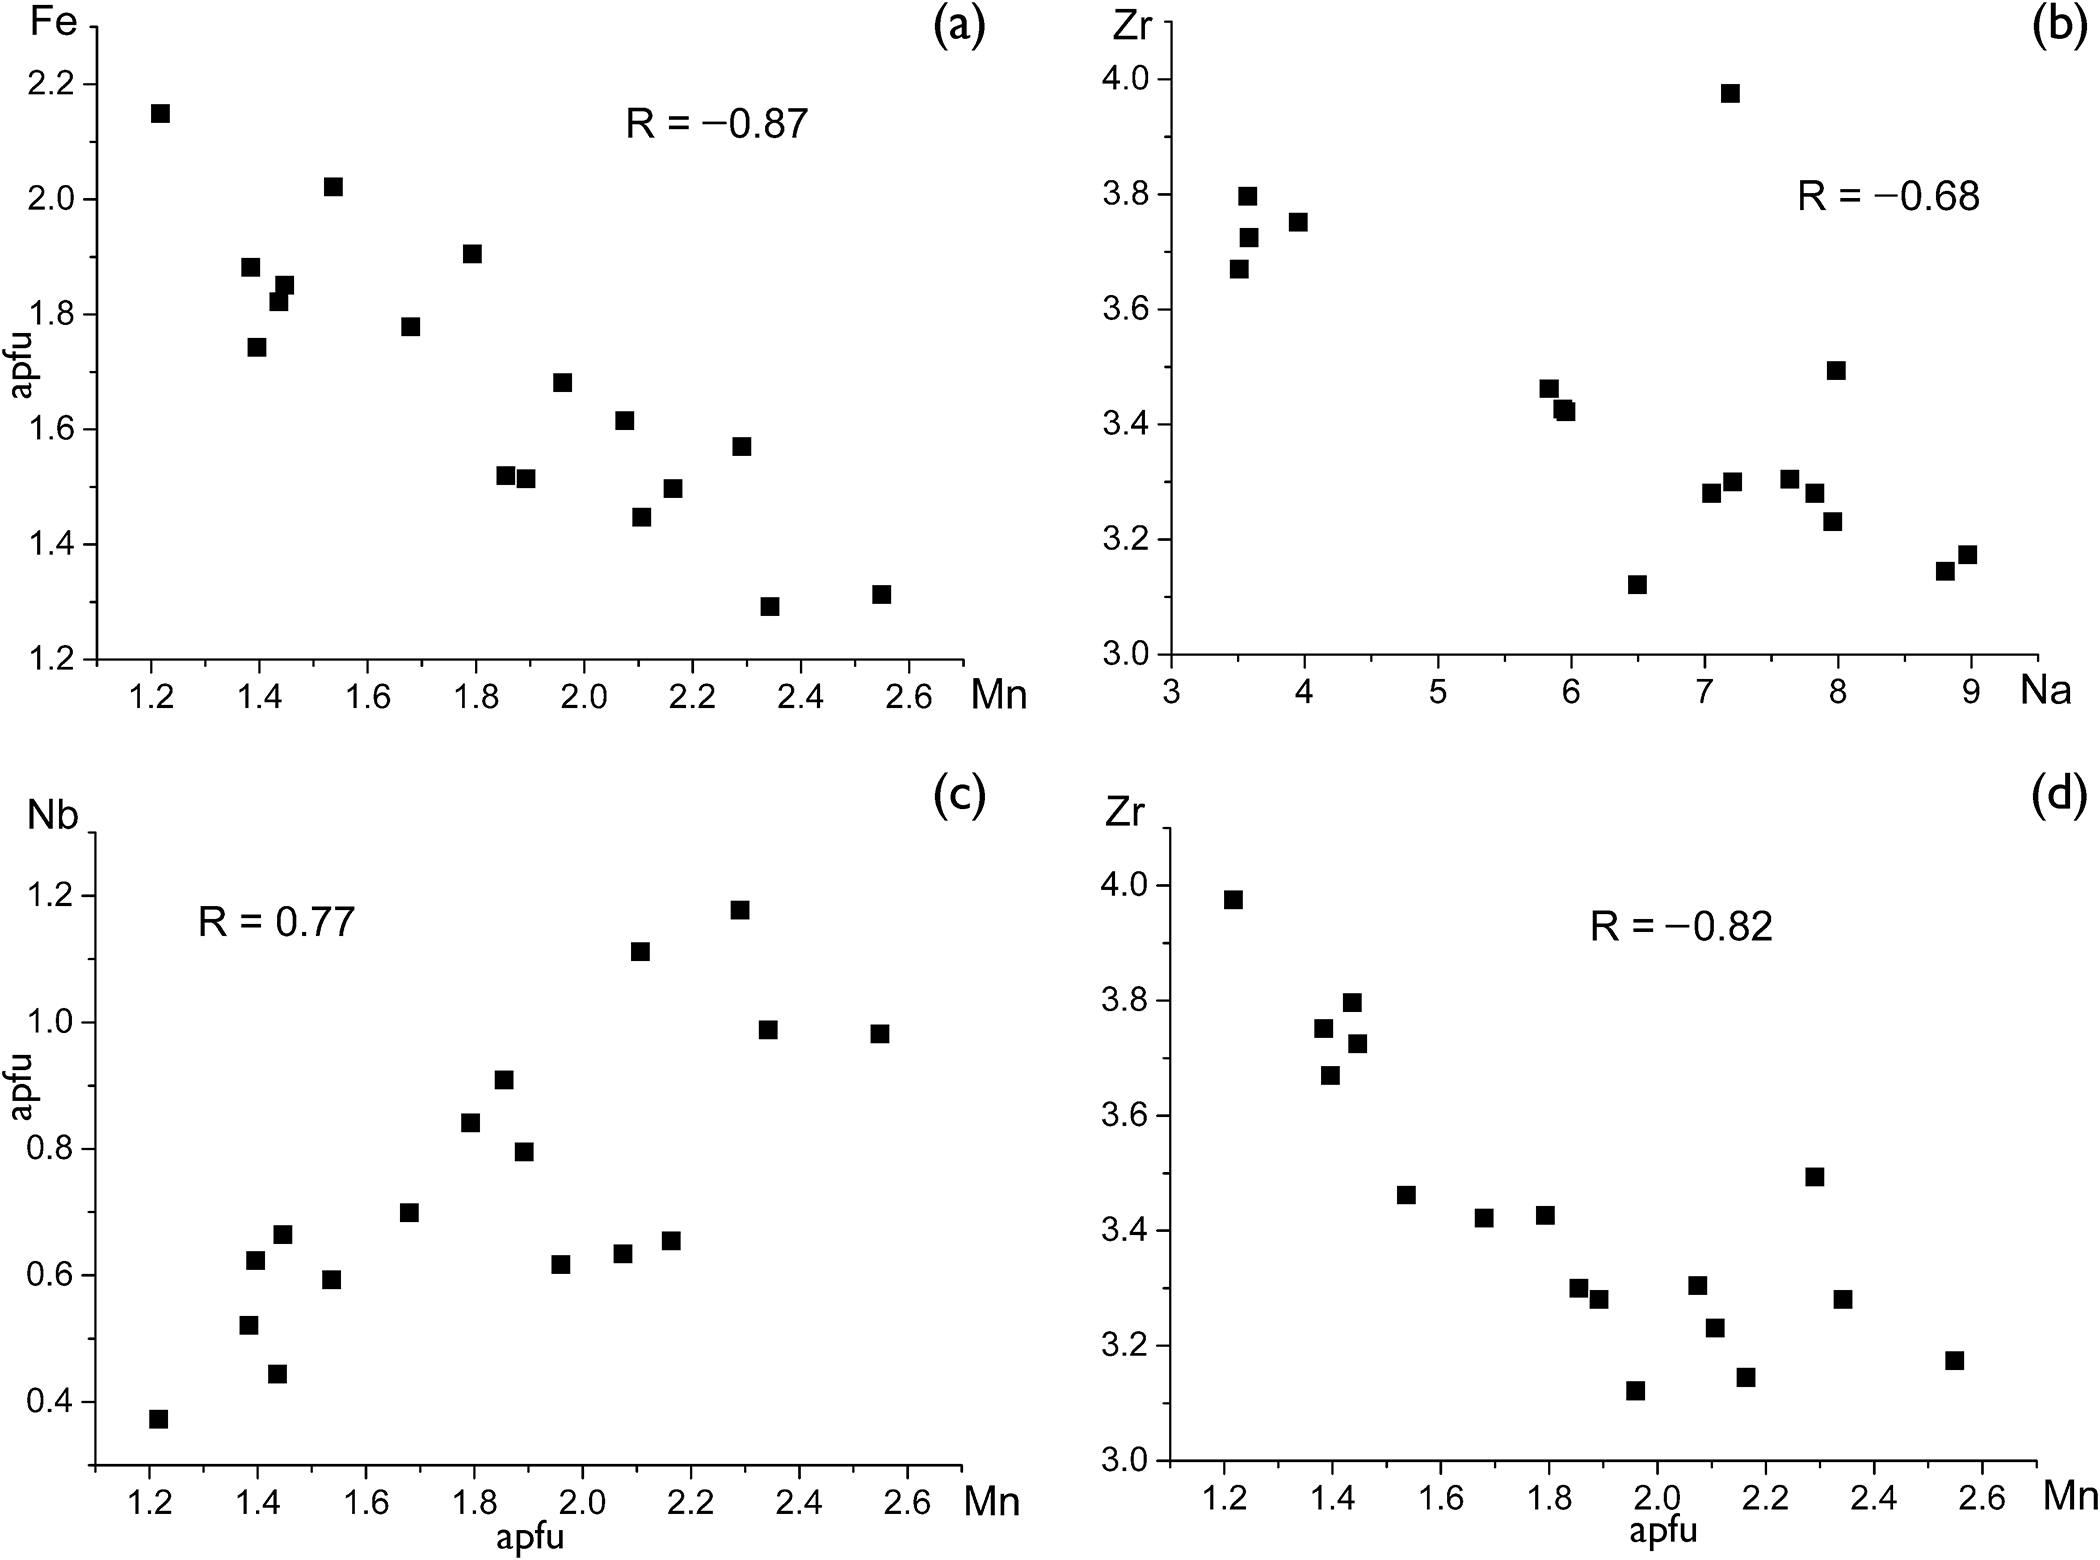
The most remarkable correlations between formula coefficients with correlation coefficients |R| > 0.6 are given in Figs 8–10.
Correlations between formula coefficients of EGMs in Tmz-1.

Correlations between formula coefficients of the EGM-forming reaction zone around fluorapatite in Tmz-1.

Correlations between formula coefficients of EGMs in Tmz-2.

Single-crystal X-ray diffraction and crystal structure
The crystal structure (Figs 11 and 12) of a single-crystal fragment with the stoichiometry (H3O)xNa6.67K0.50Ln 0.55Ca6.54Mn1.87Fe1.61Zr3.28Ti0.17Nb0.63Si25F0.40Cl0.18S0.06(O,OH,H2O)y(CO3)z, extracted from the Nb-rich zone of Tmz-1, was refined on the basis of 4658 independent reflections with I > 2σ(I). The final refinement cycles converged to R 1 = 3.35%. The mineral is trigonal, space group R3m, the unit cell parameters are: a = 14.18516(4) Å, c = 30.07418(9) Å and V = 5240.75(3) Å3. Atomic coordinates, site occupancies, site-scattering values, equivalent isotropic parameters and anisotropic displacement parameters are presented in Tables 4 and 5. Selected bond lengths are given in Table 6. Refined and empirical occupancies and site-scattering values in the structure of Tmz-1 are given in Supplementary data (Table S1).
The crystal structure of the studied Tmz-1 sample: general view. Drawn using VESTA (Momma and Izumi, Reference Momma and Izumi2008).

A local arrangement involving 6-membered rings of octahedra in the structure of Tmz-1. Drawn using VESTA (Momma and Izumi, Reference Momma and Izumi2008).

Atomic coordinates, occupancies, site-scattering values (s.s.) and equivalent isotropic displacement parameters (U eq, Å2) in the structure of Tmz-1

* Electrons calculated from the empirical formula. **Electrons calculated from the structural formula.
Anisotropic displacement parameters (Å2) for Tmz-1

Selected bond lengths d (Å) in the structure of Tmz-1

Note: φ = O, F, Cl, OH, H2O.
The crystallographic information file (cif) has been deposited via the joint Cambridge Crystallographic Data Centre CCDC/FIZ Karlsruhe deposition service https://www.ccdc.cam.ac.uk/structures/ (the deposition number is CSD 2427867) and is also available as Supplementary Material.
Discussion
The Tamazeght complex is a suite of ultramafic to peralkaline units cross-cut by carbonatite bodies and dykes of silicate rocks. EGMs are common components of nepheline syenites of the Tamazeght complex and are considered there as indicators of agpaitic silicate rocks (Schilling et al., Reference Schilling, Marks, Wenzel and Markl2009). Most studied samples of EGMs from Tamazeght nepheline syenites belong to the eudialyte–kentbrooksite solid-solution series with > 13 Na apfu, 5 to 6 Ca apfu, 0 to 0.7 Nb apfu and variable Fe:Mn ratios. Significant contents of Sr (0.3–1.3 apfu) are common for these minerals.
According to Schilling et al. (Reference Schilling, Marks, Wenzel and Markl2009) and Marks et al. (Reference Marks, Neukirchen, Vennemann and Markl2009), the transformation of primary agpaitic rocks included the formation of sodalite at the expense of nepheline accompanied by the infiltration of carbonatite fluid rich in Ca, Mn, REE, Nb and CO2. Considering that the EGMs studied in this work are enriched in these components, it can be assumed with a high degree of probability that the rock containing them was formed as a result of metasomatic alteration of primary nepheline syenite under the influence of carbonatite fluid. Consequently, a specific zoning of the studied crystals may be a result of post-crystallization ion-exchange processes. In this reference, it is important to note that all holotype samples of hypercalcium EGMs from the Kovdor massif (namely, feklichevite, golyshevite and mogovidite) originate from metasomatically altered peralkaline pegmatites occurring in direct contacts with carbonatite bodies. These EGMs from Kovdor are Na-deficient, Fe3+-dominant and contain variable amounts of CO32– groups. The main feldspathoid of the peralkaline pegmatites of Kovdor is cancrinite, which indicates a deeper metasomatic alteration of the primary pegmatite compared to typical eudialyte-bearing rocks of the Tamazeght complex, in which nepheline and sodalite are the most common feldspathoids.
Previous electron microprobe analyses of EGMs from the Tamazeght complex (Kadar, Reference Kadar1984; Khadem Allah, Reference Khadem Allah1993; Schilling et al., Reference Schilling, Marks, Wenzel and Markl2009) indicated Ca content from 4.3 to 7.5 apfu, and Nb content from 0 to 0.7 apfu, as well as strong variation of the Mn/(Fe+Mn) ratio (from 0.2 to 0.8 in atomic proportions). This study agrees with these results, and makes it possible to precise the crystal-chemical features of high-calcium EGMs.
Low contents of Cl in the EGMs studied (except reaction rims around calcite and apatite) and the absence of Cl in associated fluorapatite can be explained by a depletion of Cl in the remaining fluid after the crystallization of sodalite (Wang et al., Reference Wang, Marks, Wenzel and Markl2016) as well as (in the case of EGMs) a high activity of CO2. The EGMs studied in this work are high-hydrous and Na-deficient, which indicates their alteration (Na leaching and hydrolysis) under hydrothermal conditions, by analogy with other ‘hydroeudialytes’, including ikranite (Chukanov et al., Reference Chukanov, Pekov, Zadov, Korovushkin, Ekimenkova and Rastsvetaeva2003), aqualite (Khomyakov et al., Reference Khomyakov, Nechelyustov and Rastsvetaeva2007), ilyukhinite (Chukanov et al., Reference Chukanov, Rastsvetaeva, Rozenberg, Aksenov, Pekov, Belakovsky, Kristiansen and Van2017) and selsurtite (Chukanov et al., Reference Chukanov, Aksenov, Kazheva, Pekov, Varlamov, Vigasina, Belakovskiy, Vozchikova and S.N2023).
The general trends for all groups of analyses are positive correlations for the pairs Fe + Mn and Nb + Mn. The former trend has a distinct crystal-chemical origin (the occurrence of a major part of these elements at the M2 site) whereas the latter trend may be due to the evolution of the geochemical environment.
A positive correlation between Mn and Ca in Tmz-1 (Fig. 8b) and the absence of a distinct correlation between these elements show the absence of incorporation of significant amounts of these elements in the N4 site, unlike other Mn-rich (georgbarsanovite, siudaite) and Ca-rich (feklichevite, golyshevite, mogovidite) EGMs. Negative correlations between Mn and Zr (Figs 8d and 10d) can be explained by the incorporation of excessive (>3 apfu) Zr atoms in the M2 site, mainly populated by Mn and Fe. The cause of a distinct negative correlation between Zr and Na in Tmz-2 (Fig. 10b) is not obvious. Taking into account a low mobility of Zr under hydrothermal and supergene conditions, one can suppose that Zr-rich zones are more susceptible to hydrolysis and sodium leaching than zones with lower zirconium contents.
The EGMs studied in this work contain significant amounts of lanthanides. The total REE 2O3 content varies from 1.5 to 2.5 wt.% in Nb-deficient zones and the reaction zone around calcite and from 3 to 5 wt.% in Nb-rich zones and reaction zone around fluorapatite. In all spot analyses, La dominates over other REE.
The studied single-crystal fragment of TMZ-1 is isostructural with other 12-layered members of the eudialyte group with the space group R3m. Based on the refined site-scattering factors and chemical data, the crystal chemical formula of the mineral can be written as follows (Z = 3):
N 1–3(Na6.75Ca0.96□1.29)Σ9 N 4(Ca0.66Ln 0.51K0.48Mn0.39□0.96)Σ3 N 5((H3O)1.69(H2O)0.86□0.45)Σ3 ZrZ(Zr2.80Ti0.17Hf0.03)Σ3 M 1(Ca5.00Mn1.00)Σ6M 2(Fe1.60□0.60Mn0.40Zr0.40]Σ3M 3(Nb0.63□0.37)Σ1 M 4(Si1.00)[Si1–6Si24O72]X 1,O19–24[(OH)3.70H2O1.60(CO3)0.33F0.30Cl0.16] where [Si1–6Si24O72] are rings of tetrahedra.
Based on the structural data and crystal-chemical criteria, combined with the data of chemical analysis, the following structural features of this EGM can be distinguished:
(1) No cation ordering within the six-membered ring of octahedra is observed, and the mineral has R3m symmetry. The M1O6-octahedra are predominantly occupied by Ca (with the Ca:Mn ratio of 5:1).
(2) Iron is the dominant component at the M2 site. However, rather high amounts of Mn2+ and Zr occur at this site.
(3) Nb octahedra dominate over vacancies at the M3 site.
(4) The M4 site is fully occupied by Si.
(5) The extra-framework N1–3 sites are Na-dominant, with subordinate Ca.
(6) The extra-framework N4 site has mixed occupancy by Ca, Ln, K and Mn with the predominance of Ca and significant amount of vacancies (∼32%).
(7) H3O is the dominant component at the extra-framework N5 site.
(8) The occupancy of the anion X1 site is (CO3)0.33F0.30Cl0.16, the O20 site being occupied by oxygen of the CO3 groups.
(9) Most probably, the extra-framework O22–O23 oxygen sites are occupied by H2O molecules whereas the O19, O21and O24 sites are occupied by hydroxyl groups.
These structural features correspond to a Mn-rich variety of and H3O-dominant (at the N5 site) analogue of feklichevite and golyshevite which also have a Ca-dominant N4 site (Pekov et al., Reference Pekov, Ekimenkova, Chukanov, Rastsvetaeva, Kononkova, Pekova and Zadov2001; Chukanov et al., Reference Chukanov, Moiseev, Rastsvetaeva, Rozenberg, Zadov, Pekov and Korovushkin2005). However, taking into account the complex character and multivariable of their occupancies by various cations in different ratios, other distribution options are theoretically possible, especially for the M2 and N4 sites. In mogovidite (Chukanov et al., Reference Chukanov, Moiseev, Rastsvetaeva, Rozenberg, Zadov, Pekov and Korovushkin2005) Ca dominates at two extra-framework sites (N3 and N4). Golyshevite and mogovidite differ from Tmz-1 by lower Nb contents and predomination of CO32– groups among X anions.
We consider IR spectroscopy as a reliable method for the determination of the state of iron in EGMs based on IR spectra of several tens of structurally investigated eudialyte-group minerals partly characterized by Mössbauer spectroscopy. However, crystal structure analysis provides an independent tool to determine valence state of iron based on the cation–oxygen distances. Mössbauer study of eudialyte-group minerals was carried out by Pol’shin et al. (Reference Pol’shin, Platonov, Borutzky, Taran and Rastsvetaeva1991). According to their data, the mean Fe–O distance for the M2 site varies from 2.09 Å for Fe3+-dominant samples to 2.21 Å for Fe2+-dominant ones. Numerous subsequent studies confirmed this conclusion (Rastsvetaeva et al., Reference Rastsvetaeva, Chukanov and Aksenov2012). In particular, in golyshevite (a Fe3+-dominant EGM, according to Mössbauer data), the mean M 2Fe–O distance is equal to 2.09 Å whereas in eudialyte s.s. it is between 2.18 and 2.21 Å (see e.g. Rastsvetaeva et al., Reference Rastsvetaeva, Chukanov, Pekov, Ch and Van2020f). In the EGM from Tamazeght studied in this work, the mean M2–O distances are 2.062 and 2.090 Å (the latter value may correspond to the Mn-bearing subsite).
According to the correlations by McClellan and Pimentel (Reference McClellan and Pimentel1960), Novak (Reference Novak1974) and Libowitzky (Reference Libowitzky1999), the IR bands of O–H stretching vibrations at 3550, 3401 and 3290 cm–1 and the broad wing in the range of 2800–3200 cm–1 correspond to hydrogen bonds with the O···O distances > 2.9 Å, ∼2.8 Å, ∼2.7 Å and < 2.7 Å, respectively. These values correspond to hydrogen bonds with the O···O distances of 2.92 Å for O19···O14, 2.795 Å for O19···O17, 2.73 Å for O21···O23, 2.70 Å for N5···O17, 2.92 Å for O19···O14, and 2.63 Å for O24···O18.
Some assumptions about the crystallization conditions of the studied EGMs from Tamazeght can be made based on their comparison with recent experimental data. Perfect crystals of Na- and Fe-deficient high-calcium and hypercalcium EGMs were synthesized hydrothermally at 600°C from a charge composed of Na2CO3, CaO, Fe2O3, ZrOCl2, and SiO2 (in the ratio 22.5:9.5:7:16:45) in the presence of 1M aqueous solution of NaCl at the charge to solution ratio of 1:1000 (Kovalskaya et al., Reference Kovalskaya, Ermolaeva, Chukanov, Varlamov, Kovalskiy, Zakharchenko, Kalinin and Chaichuk2023a). Their typical empirical formulae calculated based on local electron microprobe analyses are: (Na12.70–xCa1.16)Ca6(Fe1.58Zr0.40Nax)(Zr2.97Hf0.03)Si2(Si24O72)(O,OH,CO3)yCl0.88·n(H2O,H3O) and (Na13.16–xCa2.78)Ca6(Fe1.05Zr0.23Nax)(Zr2.99Hf0.01)Si2(Si24O72)(O,OH,CO3)yCl0.99·n(H2O,H3O). Like high-calcium and hypercalcium EGMs from the Tamazeght complex, these compounds are Na-deficient, with Zr > 3 apfu and contain significant amounts of H2O and CO32–. Gradual enhancement of the Na:Ca ratio in the reaction system results in the formation of normal (with ∼6 Ca apfu) EGMs, Ca-deficient (with ∼3 Ca apfu) EGMs and, finally, zirsinalite, Na6CaZr(Si6O18) (Kovalskaya et al., Reference Kovalskaya, Ermolaeva, Chukanov, Kovalskiy, Varlamov and Chaichuk2023b).
Conclusion
New data on EGMs from the Tamazeght complex of alkaline and ultramafic rocks and carbonatites obtained in this work confirm the general trends according to which reaction zones around calcite and apatite inclusions, Na- and Cl-deficiency, high contents of Ca, Mn, REE, Nb, carbonate and H-bearing groups, positive correlation between Nb and Mn and negative correlations between the pairs Fe–Mn and Zr–Mn are the specific features of EGMs from peralkaline pegmatites metasomatically altered under the influence of carbonatite fluid rich in Ca, Mn, REE, Nb, CO2 and H2O. Crystallization of sodalite at the expense of nepheline in the formation of carbonatite-related rocks of the Tamazeght complex could be the cause of low Cl contents in pegmatites of this type.
Supplementary material
The supplementary material for this article can be found at https://doi.org/10.1180/mgm.2025.10125.
Acknowledgements
We sincerely thank A. Guillet (Mineralorme shop, Blain, France), who provided us with the studied samples. Useful information was provided by Prof. P. Monchoux (Toulouse University), as well as B. Hogrel and Y. Lulzac (BRGM ore geologists – retired). The X-ray diffraction data were obtained within the state assignment of NRC «Kurchatov Institute». The refinement of crystal structure and crystal chemistry analysis was carried out at the Center for X-Ray Diffraction Research of the Science Park of St. Petersburg State University within the framework of project 125021702335-5. Chemical analyses, correlation analysis, infrared spectroscopy, interpretation of the Raman spectra and identification of associated minerals were carried-out in accordance with the state task of Russian Federation, registration number 124013100858-3.
Competing interests
The authors declare none.