Implications
An a posteriori granddaughter design was applied to the entire genome to determine haplotype effects for 33 traits of Holsteins. There were a total of 133 chromosomal segment-by-trait combinations, for which the nominal probability of significance for the haplotype effect was <10−8, which corresponds to genome-wide significance of <10−4. By trait, from one (rear legs, rear view) to seven (net merit) chromosomal segments met this criterion. Confidence intervals ranged from one to eight haplotype segments of ~75 markers each. These results can be used to determine the actual polymorphisms responsible for variation in quantitative traits.
Introduction
Since 2008, genomic evaluation has become a reality chiefly because of the development of high-density single nucleotide polymorphism (SNP) chips that allow for relatively inexpensive genotyping of individuals for tens of thousands of genetic markers. The methods developed for genomic evaluations are based on population-wide linkage disequilibrium between closely linked markers and the actual quantitative trait locus (QTL) that determine phenotypes for the traits of interest (e g. VanRaden et al., Reference VanRaden, Van Tassel, Wiggans, Sonstegard, Schnabel, Taylor and Schenkel2009). Since linkage disequilibrium is generally incomplete, even if a SNP has a major estimated effect on an economic trait, the SNP genotypes of individual animals do not necessary correspond to their QTL genotypes. With the exception of the DGAT1 and ABCG2 genes (Grisart et al., Reference Grisart, Coppieters, Farnir, Karim, Ford, Berzi, Cambisano, Mni, Reid, Simon, Spelman, Georges and Snell2002; Winter et al., Reference Winter, Krämer, Werner, Kollers, Kata, Durstewitz, Buitkamp, Womack, Thaller and Fries2002; Cohen-Zinder et al., Reference Cohen-Zinder, Seroussi, Larkin, Loor, Everts-van der Wind, Lee, Drackley, Band, Hernandez, Shani, Lewin, Weller and Ron2005), the actual polymorphisms responsible for detected QTL, the quantitative trait nucleotides (QTN) remain unknown. Determination of the QTN should result in increased rates of genetic gain (Weller and Ron, Reference Weller and Ron2011). If the QTN are known, then these factors can be included directly in the genomic analysis model, resulting in more accurate genetic evaluations.
Ron and Weller (Reference Ron and Weller2007) presented a schematic strategy for determination if a genetic variant is a QTN in farm animals. The most convincing proof that the QTN has been determined is ‘concordance,’ that is determination for a group of animals that their genotypes for the putative QTN correspond to their inferred genotypes for the QTL. They proposed application of the ‘a posteriori granddaughter design’ (APGD) to determine QTL genotypes for bulls from large populations of individuals genotyped using high-density SNP chips. Similar to the original granddaughter design, sires with many progeny-tested sons are analyzed. However, rather than genotype the sons specifically for application of a granddaughter design, the data generated by genotyping many bulls for high-density SNP chips are utilized. Thus, the design is considered ‘a posteriori.’ The sons of each bull are divided into two groups based on which paternal haplotype was passed to each son for the chromosomal region with the putative QTL. For both DGAT1 and ABCG2, the QTN was first determined by concordance.
The granddaughter design has been applied to nearly all major commercial dairy cattle populations (Weller, Reference Weller2007). So far, 7091 QTL for 441 economical traits have been reported based on marker–QTL linkage analyses (http://www.animalgenome.org/cgi-bin/QTLdb/BT/index), the overwhelming majority by granddaughter designs. However, relatively little practical use has been made of the results. The reasons were twofold. First, because of the very large number of tests performed, the usual P-values of 0.05 or 0.01 will be obtained many times purely by chance. Lander and Kruglyak (Reference Lander and Kruglyak1995) developed a formula that accounts for linkage among sites along a chromosome. For a complete analysis of the bovine genome with 30 chromosomes and a map length of 30 M, a pointwise P-value of 5×10⁻⁵ is required to obtain a genome-wide P-value of 0.05; that is, the probability is 0.05 that a nominal P-value of 5×10⁻⁵ (log10(5×10⁻⁵)=−4.3) for a specific genome location will be obtained at least once in the genome. However, very few of the effects actually detected by daughter or granddaughter designs met that stringent criterion (e.g. Georges et al., Reference Georges, Nielsen, Mackinnon, Mishra, Okimoto, Pasquino, Sargeant, Sorensen, Steele, Zhao, Womack and Hoeschele1995).
The second difficulty in application of daughter or granddaughter design results to commercial breeding programs was that confidence intervals (CIs) for QTL location, except for the largest effects such as ABCG2 and DGAT1, were very wide (if computed at all) and generally included most of the chromosome (Ron et al., Reference Ron, Feldmesser, Golik, Tager-Cohen, Kliger, Reiss, Domochovsky, Alus, Seroussi, Ezra and Weller2004). Again, because sites along the chromosome are linked, CI cannot be computed by an analytical formula. Visscher et al. (Reference Visscher, Thompson and Haley1996) proposed that CI could be estimated by application of the nonparametric bootstrap. Multiple samples are drawn from the data with repeats; those samples are analyzed, and CI are derived from the distributions of the samples.
Compared with application of granddaughter designs based on microsatellites (e.g. Georges et al., Reference Georges, Nielsen, Mackinnon, Mishra, Okimoto, Pasquino, Sargeant, Sorensen, Steele, Zhao, Womack and Hoeschele1995), the APGD, in which each haplotype is based on the genotypes of tens of tightly linked SNP and the paternal haplotype of nearly all sons can be determined (Weller et al., Reference Weller, VanRaden and Wiggans2013), is more powerful for detection of segregating QTL. Furthermore, the APDG is potentially much more extensive than previous granddaughter design analyses, both in the number of animals included in the analysis and the number of traits analyzed. Georges et al. (Reference Georges, Nielsen, Mackinnon, Mishra, Okimoto, Pasquino, Sargeant, Sorensen, Steele, Zhao, Womack and Hoeschele1995) analyzed 1518 sons of 14 sires for five milk production traits. Ashwell et al. (Reference Ashwell, Heyen, Sonstegard, Van Tassell, Da, VanRaden, Ron, Weller and Lewin2004) analyzed 1415 sons of 10 sires for the same milk production traits, pregnancy rate, somatic cell score (SCS) and productive life. Approximately 70 000 US Holstein bulls have already been genotyped, but most of these bulls do not yet have genetic evaluations based on progeny test.
For all 33 traits evaluated for US Holsteins, Weller et al. (Reference Weller, VanRaden and Wiggans2013) applied APGD to the specific autosomal region that included the SNP with the greatest effect for each trait as determined by genome-wide analysis including all valid SNP. The effects of nearly all of the chromosomal segments analyzed were nominally significant at P<0.001. Because only a single haplotype segment was analyzed per trait, multiple comparisons were not a serious problem. The objective of this study was to apply APGD to the entire genome for all 33 traits and to estimate CI for large effects of interest.
Material and methods
Animals, genotypes and traits analyzed
Similar to Weller et al. (Reference Weller, VanRaden and Wiggans2013), of 19 365 US Holstein bulls with genotypes for the BovineSNP50 BeadChip (Illumina Inc., 2011), and ⩾10 valid daughter records; 9178 bulls that were sons of 52 bulls with ⩾100 sons per sire were retained for APGD application. These sons had a total of 7334 778 daughters with valid records for the milk production traits. As in Weller et al. (Reference Weller, VanRaden and Wiggans2013), 45 188 SNP from the BovineSNP50 BeadChip were retained for analysis, and haplotypes with a maximum of 75 markers per haplotype segment were determined using the findhap.f90 Fortran program (VanRaden, Reference VanRaden2011). Over the entire genome of ~3×10⁹ bp and a length of 3000 cM, there were 617 nonoverlapping haplotype segments; each haplotype segment included ~5×10⁶ bp and 5 cM. Only 608 autosomal segments were included in the analysis, because the other nine segments were located on the X chromosome in the region that is nonhomologous to the Y chromosome, and sons did not receive the paternal X chromosome. A total of 19 335 unique haplotypes were found among the 52 grandsires analyzed, for a mean of 32 unique haplotypes per segment.
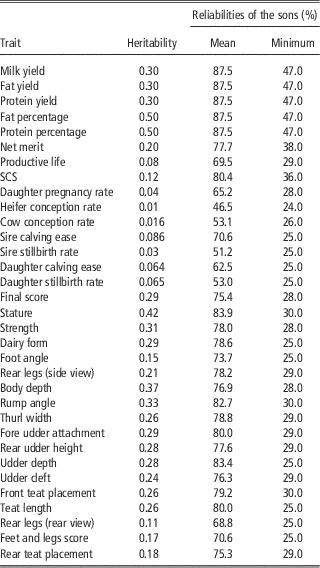
The 33 traits analyzed by Weller et al. (Reference Weller, VanRaden and Wiggans2013) were included: milk, fat and protein yields; component percentages; SCS; productive life; daughter pregnancy rate; heifer and cow conception rates; service-sire and daughter calving ease; service-sire and daughter stillbirth rates; 18 conformation traits; and the net merit genetic–economic index. Genomic evaluations were analyzed, but they were expected to be very similar to traditional genetic evaluations computed with a standard animal model (VanRaden and Wiggans, Reference VanRaden and Wiggans1991), because each son was required to have ⩾10 daughters with a record usable for genetic evaluation. Heritabilities, and mean and minimum reliabilities of the sons included in the analysis by trait are given in Table 1. Heritabilities ranged from 0.01 for heifer conception rate to 0.5 for fat and protein percentage. Mean reliabilities ranged from 46.5% for heifer conception rate to 87.5% for milk production traits. Minimum reliabilities ranged from 24% for heifer conception rate to 47% for milk production traits.
Heritabilities and mean reliabilities of the sons included in the analysis by trait

SCS=somatic cell score.
Statistical analyses
The statistical model of Weller et al. (Reference Weller, VanRaden and Wiggans2013) was used for each haplotype segment:
 $$Y_{{ijk}} \,=\,S_{i} \,{\plus}\,H_{{ij}} \,{\plus}\,e_{{ijk}} $$
where Y ijk is the genetic evaluation of bull k, which is a son of sire i that received sire haplotype j, S i is the effect of sire i, H ij is the effect of haplotype j of sire i, and e ijk is the random residual associated with each evaluation. All sons were given equal weight in the analysis, even though there were differences in their reliabilities. Model analysis was by the GLM procedure of SAS (SAS Institute Inc., 2012). An overall haplotype effect indicates that a QTL is segregating within or near the haplotype segment. A specific within-family haplotype effect (P<0.001) indicates that the specific bull is segregating for the QTL.
A nonparametric bootstrap analysis (Visscher et al., Reference Visscher, Thompson and Haley1996) was applied to the chromosome that included the haplotype segment with the greatest effect (lowest P-value) for nine traits: milk and protein yields; SCS; net merit; productive life; daughter pregnancy rate; heifer and cow conception rates; and final score. A total of 100 bootstrap samples were generated for each trait-by-chromosome combination by sampling the 9178 sons with repeats. For each bootstrap sample, all haplotype segments along the chromosome were analyzed by APGD, and the segment with the lowest P-value was selected. A 90% CI then was determined by the distribution of the segments with the lowest P-value. Because distributions generally were nonsymmetric, especially if QTL were located near the end of a chromosome, the shortest chromosomal segment that included 90% of the samples was selected as the CI.
Results and discussion
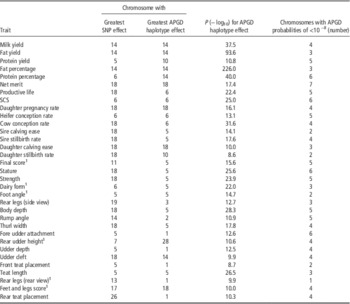
Bos taurus chromosome (BTA) for the SNP with the greatest effect by all-SNP analysis (Weller et al., Reference Weller, VanRaden and Wiggans2013) and by the APGD, nominal P-value (−log10) for APGD haplotype effects, and the number of chromosomes with a nominal P<10−8 for the APGD haplotype effect are shown in Table 2. For six traits, the SNP with the greatest effect was on the sex chromosome. This could either be because of a major QTL located on the sex chromosome with effects on several traits or a possible bias in the effect estimates due to the fact that sires always pass their single X chromosome to all daughters. For those traits, the autosome with the greatest SNP effect was shown in Table 2. For 23 of the 33 traits analyzed the greatest APGD haplotype effect was not on the chromosome with the greatest SNP effect. This is not surprising, considering that the effect associated with a specific SNP on average underestimates the actual QTL by a factor of five (Weller et al., Reference Weller, VanRaden and Wiggans2013).
Chromosomes with the SNP with the greatest effect by all-SNP analysis (Weller et al., Reference Weller, VanRaden and Wiggans2013) and by the APGD, −log10 P-values for this effect and the number of chromosomes with APGD probabilities <10-8

SNP=single nucleotide polymorphism; APGD=a posteriori granddaughter design; SCS=somatic cell score.
1 The SNP with the greatest effect was on the sex chromosome.
A nominal P<10−8 for the APGD haplotype effect corresponds to genome-wide P<10−4. There were a total of 133 chromosomal segment-by-trait combinations that met this criterion. Thus, many more QTL were detected with genome-wide significance, as compared with the previous granddaughter designs for the traits analyzed (http://www.animalgenome.org/cgi-bin/QTLdb/BT/index). Rear legs (rear view) had only a single autosomal region with a nominal P<10−8 for the APGD haplotype effect; all other traits had more than a single region. Genetic correlations from Interbull are lower for this trait than for other conformation traits, averaging 0.76 for United States with other countries (http://www-interbull.slu.se/conform/c-appen4-061.html) compared with 0.85 to 0.95 for most conformation traits, indicating that the trait is defined less consistently or evaluated less accurately.
Net merit had seven chromosomes with a nominal P<10−8, which was more than any other trait. For daughter stillbirth rate, the greatest APGD haplotype effect, as measured by the negative log of the nominal probability, was 8.6. For all other traits, the greatest APDG haplotype effect was larger. Daughter stillbirth rate had the sixth lowest heritability among the traits analyzed (Table 1).
The effects for milk and fat yields and fat and protein percentages on BTA14 had by far the greatest F-values and lowest P-values. Those effects correspond to the effect associated with the DGAT1 gene located near the beginning of that chromosome (Grisart et al., Reference Grisart, Coppieters, Farnir, Karim, Ford, Berzi, Cambisano, Mni, Reid, Simon, Spelman, Georges and Snell2002; Winter et al., Reference Winter, Krämer, Werner, Kollers, Kata, Durstewitz, Buitkamp, Womack, Thaller and Fries2002). The effect associated with the ABCG2 gene on BTA6 that chiefly affects protein percentage (Cohen-Zinder et al., Reference Cohen-Zinder, Seroussi, Larkin, Loor, Everts-van der Wind, Lee, Drackley, Band, Hernandez, Shani, Lewin, Weller and Ron2005) was not the effect associated with the lowest probability for that trait. This may be due to the fact that the frequency of the favorable allele that decreases milk yield but increases protein concentration is now at a very high frequency in the North American Holstein population. In addition, the effect of the QTL may be spread over several closely linked markers, or alternatively no single marker may be in strong linkage disequilibrium with the QTL.
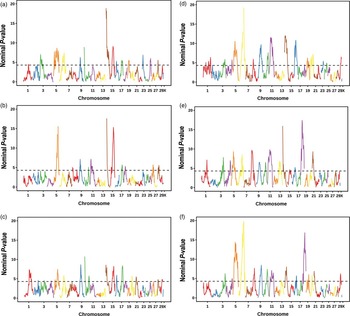
Manhattan plots of the APGD haplotype effects are depicted in Figure 1 for milk, fat and protein yields; SCS; net merit; and productive life; Manhattan plots for the remaining traits are in the Supplementary Figures S1–S4. In the figures, −log10 nominal P for each chromosome segment is plotted as a function of genome location. In addition to the major effect on BTA14 associated with DGAT1, large effects were found for milk yield on BTA5, 6, 10 and 15 and for protein yield on BTA9 and 10. Of the 29 autosomes, 17 had a nominal P<5×10⁻⁵ for protein yield. Thus, numerous segregating QTL can be detected, even though milk and protein yields have been under intense selection for 50 years. (Although protein has been measured directly only since 1977, protein yield is highly correlated to milk yield.) For net merit, the largest effect was on BTA18, which also was the chromosome that had the SNP with the greatest effect; however, a very large effect also was found on BTA14. For both productive life and SCS, the largest effects were on BTA6, even though the SNP with the greatest effect on productive life was on BTA18, which had the second largest effect for that trait. Cole et al. (Reference Cole, Wiggans, Ma, Sonstegard, Lawlor, Crooker, Van Tassel, Yang, Wang, Matukumalli and Da2009) reported the discovery of a large QTL associated with net merit on BTA18. The QTL on BTA14 is in the region that includes DGAT1, which has an effect on net merit because of the economic value associated with milk components (Cole et al., Reference Cole and VanRaden2010). The SCS findings are consistent with a QTL on BTA6 as previously reported by Bennewitz et al. (Reference Bennewitz, Reinsch, Guiard, Fritz, Thomsen, Looft, Kühn, Schwerin, Weimann, Erhardt, Reinhardt, Reents, Boichard and Kalm2004) and Lund et al. (Reference Lund, Guldbrandtsen, Buitenhuis, Thomsen and Bendixen2008).
Manhattan plots of the a posteriori granddaughter design for milk yield (a), fat yield (b), protein yield (c), SCS (d), net merit (e), and productive life (f), where nominal P (–log10) is plotted as a function of haplotype segment. The dotted line at P=4.3 corresponds to genome-wide P=0.05. Each chromosome is plotted in a different color. SCS=somatic cell score.

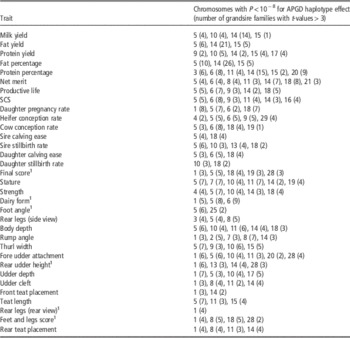
Chromosomes with nominal APDG P<10−8 and numbers of grandsire families with t-values >3 for within-family contrasts are shown in Table 3 by chromosome. For each of these putative QTL, at least one grandsire family had a within-family contrast with t-value >3. The effect for fat percentage on BTA14 had the greatest number (26) of segregating families followed by fat yield (21), protein percentage (15) and milk yield (14) on this chromosome. As noted, all of those appear to be related to the DGAT1 gene. BTA5 had the next highest number of segregating families for fat percentage (10). That QTL apparently also affects milk and fat yields. Both protein percentage and dairy form had effects segregating in nine families (BTA20 and six, respectively); however, for both traits, those chromosomes were not the one with the overall lowest P-value.
Chromosomes with nominal P<10−8 for APGD haplotype effects
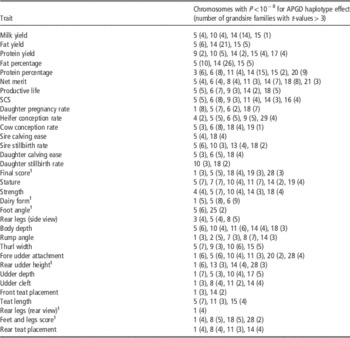
SNP=single nucleotide polymorphism; APGD=a posteriori granddaughter design; SCS=somatic cell score.
Numbers of grandsire families with t-values >3 for within-family contrasts in parentheses.
1 The SNP with the greatest effect was on the sex chromosome.
Weller et al. (Reference Weller, Kashi and Soller1990) considered 20 grandsire families each with 200 sons. In that case, power to detect a QTL with a substitution effect of 0.1 phenotypic standard deviations is 0.61 with 50 daughters per son and equal frequency for the two QTL alleles. Increasing the number of grandsires to 50 results in nearly complete power of detection. Because a QTL of that magnitude and allelic frequencies accounts for only 0.5% of phenotypic variance, the detection of several QTL for each trait is not surprising.
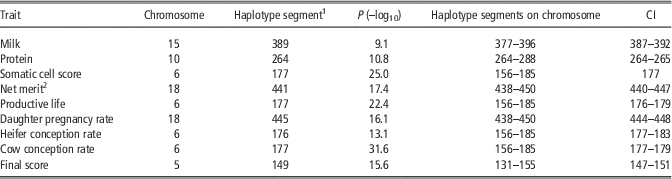
Table 4 shows 90% CI for selected effects of nine traits using the nonparametric bootstrap method as well as nominal P. Generally, CI narrowed as −log10 P increased. A bimodal distribution was observed only for net merit. That is two peaks were observed for the distribution of the bootstrap samples. Furthermore, this trait had the widest CI (eight haplotype segments). Thus, two QTL that are segregating on BTA18 likely are affecting net merit, which is consistent with the findings of Cole et al. (Reference Cole, VanRaden, O'Connell, Van Tassell, Sonstegard, Schnabel, Taylor and Wiggans2011). For all other chromosomes, the CI spanned less than a third of the chromosome. The narrowest CI was for SCS; the maximum effect was found in the same haplotype segment for more than 90% of bootstrap samples. In previous attempts to estimate CI using a nonparametric bootstrap method for either daughter or granddaughter designs, CI generally spanned almost half of the chromosome (Weller et al., Reference Weller, Weller, Kliger and Ron2002).
Confidence intervals (CI) of 90% and nominal P(–log10) for selected a posteriori granddaughter design effects using a nonparametric bootstrap

1 Genome was divided into 617 segments of ~75 markers each. Haplotype segments were numbered consecutively beginning with BTA1 and concluding with the sex chromosome.
2 Bimodal distribution for bootstrap results.
Lander and Botstein (Reference Lander and Botstein1989) proposed the use of support intervals to estimate CI for QTL location; that is the points at which the score for the logarithm of the odds falls below a certain value relative to the maximum. However, Darvasi et al. (Reference Darvasi, Weinreb, Minke, Weller and Soller1993) demonstrated that this method does not reliably reflect actual CI, and Bennewitz et al. (Reference Bennewitz, Reinsch and Kalm2002) found that the bootstrap tends to overestimate actual CI. Furthermore, this method is not effective if more than a single QTL is segregating on the chromosome for the trait of interest.
A CI of three haplotype segments included ~1.5×10⁷ bp, 15 cM and 150 genes. For a dense genome scan, Darvasi and Soller (Reference Darvasi and Soller1997) and Weller and Soller (Reference Weller and Soller2004) developed formula to estimate CI for QTL location as a function of experimental design, QTL substitution effect and the number of individuals analyzed. However, none of their experimental designs correspond to the granddaughter design, in which multiple families are analyzed but only a fraction of those families are segregating for the QTL. The backcross design presented in those studies is roughly parallel to the granddaughter design for a single family. A total of 4917 backcross progeny are required to obtain a CI of 95% for a substitution effect of 0.25 phenotypic standard deviations. The width of the CI is inversely proportional to the square of the substitution effect relative to the residual standard deviation (Weller and Soller, Reference Weller and Soller2004). For the granddaughter design, in which genetic evaluations are analyzed, the variance among sons will be approximately equal to three-fourths of the genetic variance, but only half of the substitution effect of the QTL will be passed from sons to their daughters. Thus, for a given substitution effect, fewer sons are required to obtain the same CI as compared with a backcross design, but the CI will also be a function of heritability.
Ron and Weller (Reference Ron and Weller2007) showed that if 50 grandsire families are analyzed and ⩾5 grandsires are segregating for a QTL, the probability of obtaining concordance by chance for even a single nucleotide would still be very low. Thus, assuming that a QTL is the result of a single point mutation, determining the causative polymorphism for the 52 grandsires included in this analysis should be possible by DNA sequencing of their genomes. A possible pitfall is that significance of the within-grandsire effect may not be definitive for all families. Grandsires with dubious QTL genotype status should be deleted from the concordance analysis as suggested by Weller et al. (Reference Weller, VanRaden and Wiggans2013). The causative polymorphism may also be the result of a more complicated mechanism such as copy number variation (e.g. Seroussi et al., Reference Seroussi, Glick, Shirak, Yakobson, Weller, Ezra and Zeron2010). In that case, ascertaining the causative DNA sequence probably would be more difficult.
Considering that CI generally spanned individual chromosomal segments, it is likely that CI could be reduced by analysis of shorter segments. In addition, CI could be further reduced by various methods that have been proposed in previous studies. Korol et al. (Reference Korol, Ronin and Kirzhner1995) demonstrated that CI could be decreased by multitrait analysis of correlated traits. Of the two genes for which the QTN have been determined in dairy cattle, ABCG2 and DGAT1, both affected multiple traits. Thus, if a common peak location is observed in the Manhattan plots for more than a single trait, it would be reasonable to concentrate the search on the trait with the lowest probability, based on the hypothesis that the same polymorphism is likely to be affecting other correlated traits.
Meuwissen et al. (Reference Meuwissen, Karlsen, Lien, Olsaker and Goddard2002) presented an algorithm for joint linkage disequilibrium and linkage analysis (LDLA) mapping. They used a Gibbs sampling algorithm but included only those haplotypes that could be determined with near certainty. Using this method, they were able to map a QTL affecting twinning rate to a chromosomal region of <1 cM in the middle part of BTA5. Olsen et al. (Reference Olsen, Lien, Gautier, Nilsen, Roseth, Berg, Sundsaasen, Svendsen and Meuwissen2005) used this method to map the QTL affecting protein concentration on BTA6 (later identified to be ABCG2) to a region of 420 kb, ∼0.5 cM. With linkage mapping via a granddaughter design, the CI for QTL location was 7.5 cM. LDLA mapping was extended by Meuwissen and Goddard (Reference Meuwissen and Goddard2004) to multitrait and multiple QTL analysis and by Druet and Georges (Reference Druet and Georges2010) to include reconstruction of haplotypes by a hidden Markov model. Druet and Georges (Reference Druet and Georges2010) applied their method to analyze the effect of DGAT1 in a Dutch Holstein–Friesian pedigree of 199 sires and their 1502 sons. To date, LDLA methods have not been applied to a complete genome analysis.
Finally, Weller et al. (Reference Weller, VanRaden and Wiggans2013) demonstrated that residual variances for the APGD can be reduced to approximately one-quarter if the genetic evaluations of sons are corrected for SNP effects associated with all chromosomes other than the one under analysis. Because, as noted previously, the width of the CI is inversely proportional to the square of the substitution effect relative to the residual standard deviation, this procedure may reduce CI by half. It is also possible that shorter CI may be obtained by using smaller haplotypes.
Conclusions
For 33 traits analyzed with the APGD, each trait had at least one significant (P<10−8) within-family haplotype, which corresponds to genome-wide significance of P<10−4. Net merit had seven chromosomes with nominal P<10−8 for APGD haplotype effect. For each of those putative QTL, at least one grandsire family had a within-family contrast with a t-value of >3. The bootstrap distribution generated by 100 samples was bimodal only for net merit, which was the trait with the widest 90% CI (eight haplotype segments). For all other chromosomes, the CI spanned less than a third of the chromosome. The narrowest 90% CI was for SCS, with the maximum effect found in the same haplotype segment. A CI of three haplotype segments will include ~1.5×10⁷ bp, 15 cM and 150 genes. If 50 grandsire families were analyzed and ⩾5 grandsires were segregating for a QTL, the probability of obtaining concordance by chance would be very low for even a single nucleotide. Thus, these results can be used as a first step to determine the actual polymorphisms responsible for observed quantitative variation in dairy cattle.
Acknowledgments
This research was supported by a grant from the Binational Agricultural Research and Development Fund Research Project IS-4394-11R. The authors thank S. M. Hubbard, Animal Improvement Programs Laboratory, Agricultural Research Service, US Department of Agriculture (Beltsville, MD, USA), for technical manuscript review.