I. Introduction
Fine wine is an agricultural product with characteristics that make it an especially interesting topic for economic analyses in the context of a changing climate. First, the quality and quantity of wine, and thus its prices and revenues, are extremely sensitive to the weather where the grapes were grown.Footnote 1 In fact, depending on weather conditions, the prices for wines produced by the same winemaker from fruit grown on the same plot of land can vary by a factor of 20 or more from year to year (e.g., Ashenfelter, Reference Ashenfelter2010).Footnote 2 Similarly, prices in the same year for wines from the same grape type can vary enormously depending on where the grapes were grown, with grapes grown in more conducive climates fetching a much higher price (e.g., Ashenfelter and Storchmann, Reference Ashenfelter and Storchmann2010b).
Second, grape-growing conditions determine the longevity of a wine. Unlike most other agricultural products, fine wine can be stored for a very long time and, in some cases, not only holds its nominal value, but also grows in real value with age. This storability has made fine wine an increasingly desirable alternative asset class, mostly for the sake of portfolio diversification (e.g., Fogarty, Reference Fogarty2010; Fogarty and Sadler, Reference Fogarty and Sadler2014; Masset and Henderson, Reference Masset and Henderson2010; Sanning, Shaffer, and Sharratt, Reference Sanning, Shaffer and Sharratt2008).
Third, because grape yields are very sensitive to the weather in a growing season, revenues (i.e., price multiplied by quantity) and grape quality also vary considerably.
This article provides an overview of the extensive economic literature on the impact of weather and climate on grapes and wine, with the goal of identifying how climate change is likely to affect their production. Climate is generally defined as average weather, and it is the changes in weather over time that are considered to be climate change.Footnote 3
Generally, a changing climate will affect the prices and quantities of wine produced, and thus the profit from existing plantings. However, the long-term nature of climate change means that there will be opportunities for adaptation. These adjustments to changing climates are likely to be slower for perennial crops like grapevines than for annual crops such as wheat, cotton, and corn. Vines are perennials with a productive lifetime of more than 25 years, but full production is not achieved until 5 or 6 years after planting (e.g., Cooper, Klonsky, and De Moura, Reference Cooper, Klonsky and De Moura2012). Many studies suggest that the productivity of a specific vineyard site or grape variety may change during a vine's natural lifetime, making short-term losses unavoidable (e.g., Gladstones, Reference Gladstones1992). Moreover, in many cases, vineyards are planted on marginal land—that is, on land with poor and rocky soils and/or on steep slopes, which means there are few crop substitution options (e.g., Ashenfelter and Storchmann, Reference Ashenfelter and Storchmann2010b). This is likely to further limit mitigation options and increase grape and wine producers’ short-term adaptation costs.
Although there is general agreement that climate change will result in rising temperatures, the impact on precipitation is far less certain. Precipitation may increase in higher latitudes and decrease in lower latitudes (European Commission, 2009; Intergovernmental Panel on Climate Change [IPCC], 2013). Because of these uncertainties, most analyses of climate change's impact on viticulture (i.e., grape growing) focus on changes in temperatures and do not consider changes in rainfall.
We show that the assessment of how severely climate change may affect grape growing is dependent on the research methodology and to what extent adaptations are considered. Analyses that do not consider any adaptation tend to be more pessimistic than those that do. For instance, static climate suitability analyses for California (Roehrdanz and Hannah, Reference Roehrdanz and Hannah2016), the United States (White et al., Reference White, Diffenbaugh, Jones, Pal and Giorgi2006), and the entire world (Hannah et al., Reference Hannah, Roehrdanz, Ikegami, Shepard, Shaw, Tabor, Zhi, Marquet and Hijmans2013) project a major decline in suitability for many traditional high-quality producing regions such as Bordeaux, the French Rhone valley, Tuscany, and Napa Valley. On the other hand, areas at higher latitudes that are currently not suitable for commercial viticulture may become suitable. The extent to which these projections come true will depend on, among other factors, the respective regions’ adaptation capacities.
Compared with the New World, in most European countries the adaptability to climatic changes is limited. First, European wines are more closely tied to their geographic origin than are New World wines. Marketing with geographic indication (e.g., the appellation d'origine contrôlée [AOC]) and the focus on terroir Footnote 4 are more common in Europe than elsewhere. Second, the regime of planting rights in Europe imposes severe limits on regional substitutions.
In this article, we provide an overview of the extensive literature on the impact of weather and climate on grapes and wine. We start by discussing the physical impact of weather on vine phenology, berry composition, and yields (Section II). We then survey the economic literature measuring the effects of temperature on quality, prices, costs, and profits (Section III). Section IV describes possible adaptation strategies for grape growers, and Section V summarizes our findings, discusses the limitations of the current literature, and identifies areas for future research.
II. Physical Impact of Climate and Weather on Wines
A. Temperature
(1) Mean Temperature
Grapevines (Vitis vinifera) are characterized by a distinct annual growth cycle beginning with bud break (in the Northern Hemisphere, this is March/April); continuing with bloom (May/June), berry growth and coloring (July/August), maturation (September/October); and culminating in leaf fall in autumn followed by winter dormancy (e.g., Amerine and Winkler, Reference Amerine and Winkler1944; Gladstones, Reference Gladstones1992; Jones, Reid, and Vilks, Reference Jones, Reid, Vilks and Dougherty2012; Winkler et al., Reference Winkler, Cook, Kliewer and Lider1974). Because these phenological growth stages are determined by growing season temperatures, their association with certain calendar dates is only loose and can vary over time.
At temperatures below 10 °C (50 °F) vines go dormant in order to resist adverse winter conditions. In the dormant stage, grapevines can withstand minimum winter temperatures between −5 °C and −20 °C, depending on variety and cultivar.Footnote 5 Although the role of the dormant phase of the growing season for grapevines is not fully understood, we know that winter dormancy affects the vine's vegetative and berry development. A dormancy period helps to synchronize the growth stages for vines. It avoids irregular and patchy bud burst or maturation for separate plants. In addition, the existence of a dormant period substantially increases the productive lifetime of the vine (e.g., Gladstones, Reference Gladstones1992; Lavee and May, Reference Lavee and May1997). In the tropics, the absence of a dormancy period permits grape growers to harvest two or more crops per year. However, aside from the unsuitability of grapes grown in the tropics for quality wine production,Footnote 6 irregular bud burst, flowering and grape clusters, low bud fruitfulness, poor wood maturation (lignification), and very short life spans make tropical wine production unprofitable (Possingham, Reference Possingham2004; Possingham, Clingeleffer, and Kerridge, Reference Possingham, Clingeleffer and Kerridge1990).
Temperatures during bloom appear to play a crucial role in fruit set, ovule fertility, and berry size. Kliewer (Reference Kliewer1977a) examines various cultivars (e.g., Pinot Noir, Cabernet Sauvignon) and compares their behavior at different temperatures, such as 25/20 °C, 30/25 °C, 35/30 °C, and 40/35 °C. He finds that all varieties exhibit lower fruit set, ovule fertility, and berry size as temperatures exceeded the 25/20 °C benchmark. This suggests that warming above a cultivar-specific optimum reduces crop yields.
During véraison (i.e., the onset of ripening and change in berry color) and maturation, temperature affects sugar content, acidity, color, and flavor profile of the berries (Amerine and Winkler, Reference Amerine and Winkler1944; Gladstones, Reference Gladstones1992; Jones, Reid, and Vilks, Reference Jones, Reid, Vilks and Dougherty2012; Winkler et al., Reference Winkler, Cook, Kliewer and Lider1974). In general, high temperatures increase grape sugar accumulation (and thus potential alcohol) and reduce grape acidity. This determines the style, balance, and potential alcohol of the wine. Sadras, Bubner, and Moran (Reference Sadras, Bubner and Moran2012) confirm the influence of temperature on acidity in a field experiment. Because temperature effects are often confounded with other climatic factors, Sadras, Bubner, and Moran (Reference Sadras, Bubner and Moran2012) isolate the temperature effects by comparing the fruit of heated vines with that of an unheated control group. They find that elevated temperatures accelerate development, increase phenotypic plasticity of stomatal (leaf pore related) conductance, and reduce titratable acidity in mature Australian Shiraz berries.
In addition, during a process called “flavor ripening,” various enzymes initiate the physical softening of the berries and, most importantly, contribute to the accumulation of flavors, aromas, and pigments. Enzyme activity follows an inverse U-shaped pattern and is low at low average temperatures, is high at moderate temperatures, and falls again at high temperatures. Very high temperatures can inactivate or even irreversibly destroy any enzyme activity (e.g., Kliewer, Reference Kliewer1977b).
However, flavor ripening and the other ripening processes are not necessarily optimized at the same temperature. Generally, the optimal flavor temperature lies above the temperature that balances the must's acidity. That is, full flavor is often not reached before the pH values are too high (i.e., acidity is too low) to obtain a balanced wine. Nevertheless, optimum average temperature for flavor and aroma formation in grapes has not been defined and is likely dependent on numerous factors such as variety, plant water status, and light, among others.
(2) Temperature Variability
Temperature variability among seasons and years is a well-recognized determinant of the quality of the wine from a vintage, especially in cool viticultural climates. Although a cool growing season at the cold limit of viticulture results in a below-average vintage attributable to unripe and inferior fruit (e.g., for Bordeaux and Mosel wines, see Ashenfelter [2010] and Ashenfelter and Storchmann [2010b], respectively), the opposite is true for the hot limit of viticulture (for U.S. Pinot Noir wines, see Haeger and Storchmann [2006], and for Australian Shiraz, see Byron and Ashenfelter [1995]). Accordingly, increased warming may thus increase the number of good vintages in cold-climate wine-growing areas and simultaneously decrease the number of good vintages in hot-climate growing areas.
However, aside from vintage variations, viticulture is also affected by short-term fluctuations such as diurnal variations (the range between day maxima and night minima) and day-to-day fluctuations in extreme temperatures within a given season (Cohen et al., Reference Cohen, Tarara, Gambetta, Matthews and Kennedy2012).
It is generally thought that a low diurnal temperature variance is favorable for the ripening and coloring process (Gladstones, Reference Gladstones1992; Kliewer and Torres, Reference Kliewer and Torres1972). However, in hot wine-growing regions, a greater diurnal range may help grapevines acclimate and thus tolerate periodic extreme temperatures (Robinson, Reference Robinson2006).
Spring frosts that injure developing shoots, and frosts after bud burst that reduce the current season's crop yield, are among the most common detrimental effects of minimum temperature extremes. Winter freezes of below −12 °C, which may severely damage or kill fully dormant vines, occur mostly near the northern/southern limit of viticulture (e.g., Washington State, British Columbia).Footnote 7
Similarly, extreme maximum temperatures in summer can cause substantial heat damage by inhibiting photosynthesis, growth, and ripening, while promoting sunburn. Exposed grape bunches are particularly vulnerable to heat damage during véraison. As red wines more than whites depend on skin-derived components such as pigments and tannins, reds are more affected than whites because the skin is the part of the berry that is most sensitive to heat damage (Gladstones, Reference Gladstones1992). A detailed report of the impact of the January/February 2009 heat wave in southern Australia is provided by Webb et al. (Reference Webb, Watt, Hill, Whiting, Wigg, Dunn, Needs and Barlow2009).
(3) Temperature Accumulation Indices and Grape Suitability
In order to classify the climatic suitability of a vineyard area, various temperature accumulation indices have been developed. The most commonly used index is the Winkler index as developed by Amerine and Winkler (Reference Amerine and Winkler1944). This index draws on data from a truly remarkable series of field experiments in California's grape-growing regions.Footnote 8 Each year between 1935 and 1941, Amerine and Winkler produced several wines from each of more than 150 different grape varieties, each grown in various climatic environments. Overall, they produced and analyzed more than 3,000 wines. Amerine and Winkler then defined five degree-day regionsFootnote 9 (known as Winkler regions) and assessed each variety's suitability for each region. These regions are based on the following degree-day thresholds: region I, 2,500 degree days or less; region II, 2,501–3,000 degree days; region III, 3,001–3,500 degree days; region IV, 3,501–4,000 degree days; and region V, greater than 4,000 degree days.
Although the Winkler index is still widely used in the United States, numerous modifications have been suggested. For instance, Gladstones (Reference Gladstones1992) calculates a similar degree-day index with the imposition of an upper limit of 19 °C on average temperatures and corrects for latitude (solar radiation) and monthly temperature variation.
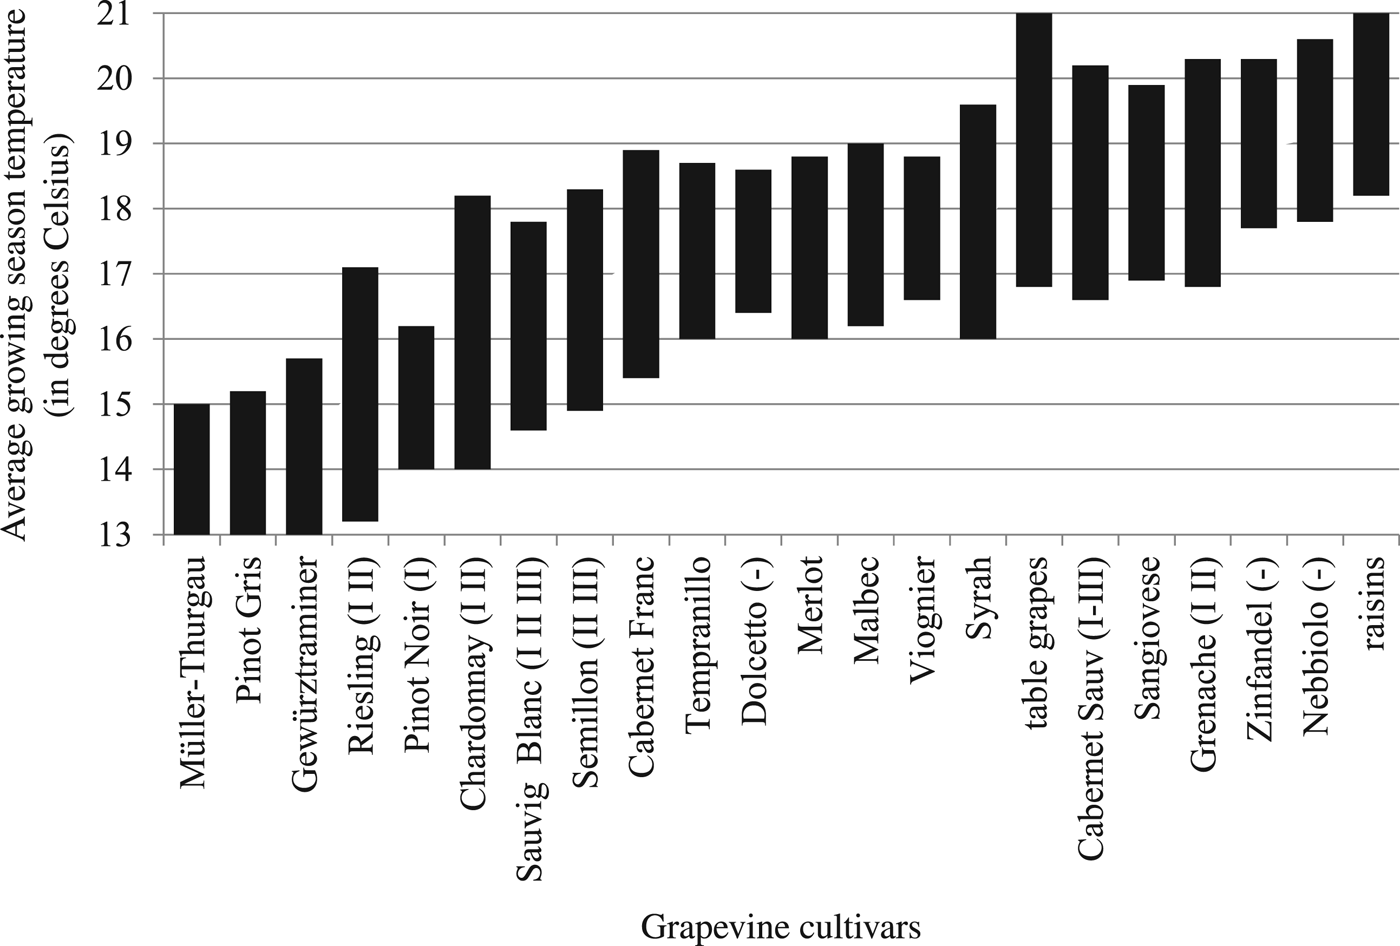
Based on these indices, Figure 1 reports the suitability of various grape cultivars for different average growing season temperature ranges (Jones et al., Reference Jones, White, Cooper and Storchmann2005). For varieties that were fully tested by Amerine and Winkler (Reference Amerine and Winkler1944), we also indicate the recommended Winkler regions. Based on current average temperatures, the figure suggests substantial potential for substitution across varieties. For example, a grape grower in Germany who is currently growing Riesling (which requires relatively low temperatures), but who faces increasingly warm temperatures, could plant different cultivars that require higher temperatures to ripen (e.g., Merlot). In contrast, the options for a Grenache grower in the south of France are much more limited because few varieties require temperatures that are higher than those required for Grenache.
Optimal Growing Season Temperatures for Selected Grapevine Cultivars

However, as reported by van Leeuwen et al. (Reference van Leeuwen, Schultz, Garcia de Cortazar-Atauri, Duchêne, Ollat, Pieri and Bois2013), the temperature range for most varietals may be wider than suggested by Figure 1. In particular, they argue that “it is very difficult to establish precise upper limits by variety for growing high-quality wines and that those given [in Figure 1] are underestimated” (van Leeuwen et al., Reference van Leeuwen, Schultz, Garcia de Cortazar-Atauri, Duchêne, Ollat, Pieri and Bois2013, p. E3051). As a result, van Leeuwen et al. (Reference van Leeuwen, Schultz, Garcia de Cortazar-Atauri, Duchêne, Ollat, Pieri and Bois2013) do not expect a dramatic decrease in the viticultural suitability in the world's main wine-producing areas within the next 30 years.
B. CO2
The longest continuously measured carbon dioxide (CO2) series originates from Mauna Loa, Hawaii, and reaches back to 1958. Since the first measurement of 315 parts per million (ppm) in 1958, the atmospheric CO2 concentration has steadily grown to 403 ppm (February 2016; National Oceanic and Atmospheric Administration, 2016). Studies with a variety of plants have shown that CO2 stimulates photosynthesis and plant growth. This could also be confirmed for grapevines. Bindi, Fibbi, and Miglietta (Reference Bindi, Fibbi and Miglietta2001) fumigated vines with CO2 and found substantial increases in yields, dry biomass, sugar, and acidity levels in response to elevated CO2 concentrations. However, the marginal effect of additional CO2 declines and equals zero at a high enough level (500 μmol mol−1). Similar results are reported by numerous other authors (e.g., Kriedemann, Sward, and Downton, Reference Kriedemann, Sward and Downton1976; Moutinho-Pereira et al., Reference Moutinho-Pereira, Gonçalves, Bacelar, Cunha, Coutinho and Correira2009; Schultz, Reference Schultz2000).
However, when examining the impact of elevated CO2 levels combined with higher temperatures and moderate drought conditions, Bindi et al. (Reference Bindi, Fibbi, Gozzini, Orlandini and Miglietta1996) found a significantly higher yield variability. In addition, some researchers found reduced CO2 assimilation and declining crops for orange trees (Kimball et al., Reference Kimball, Idso, Johnson and Rillig2007) and soybeans (Ainsworth et al., Reference Ainsworth, Davey, Bernacchi, Dermody, Heaton, Moore and Morgan2002) if plants are water stressed. Bindi et al. (Reference Bindi, Raschi, Lanini, Miglietta and Tognetti2005) found no increased grapevine CO2 assimilation under dryer growing conditions. In short, it is unclear what the effect of increased CO2 levels alone might be on grape quality and quantity.
C. Pests
Warming temperatures are likely to increase disease and pest pressure on grapevines. Pierce's disease, a bacterium that inhibits a vine's water circulation and ultimately kills the plant, is predicted to move toward the North and South Poles as winter temperatures become more hospitable for its main vector, the glassy-winged sharpshooter. In the United States, Pierce's disease is expected to move from California northward into Oregon and Washington (e.g., Daughtery, Bosco, and Almeida, Reference Daugherty, Bosco and Almeida2009; Hoddle, Reference Hoddle2004). Other insect pests, such as the light-brown apple moth in Australia (Webb, Reference Webb2006), may expand their habitats into new regions as well.
Likewise, warmer weather may promote fungal diseases such as black rot, downy mildew, powdery mildew, phomopsis, and botrytis. All of these diseases are driven by climatic factors and particularly benefit from warmer night temperatures (Magarey, Wachtel, and Emmett, Reference Magarey, Wachtel, Emmett, Nicholas, Magarey and Wachtel1994; Maixner and Holz, Reference Maixner and Holz2003; Salinari et al., Reference Salinari, Giosue, Tubiello, Rettori, Rossi, Spanna, Rosenzweig and Gullino2006). However, dryer growing conditions may partially or fully curb the detrimental effects of increasing temperatures.
D. Water
The water balance of the vine is mainly determined by the supply-side factors (1) local precipitation (rain, snow), (2) ambient atmospheric humidity and temperature, and (3) soil water-holding capacity (Gambetta, Reference Gambetta2016; Gladstones, Reference Gladstones1992; Jones, Reid, and Vilks, Reference Jones, Reid, Vilks and Dougherty2012; Schultz, Reference Schultz2016). On the demand side is evapotranspiration, the combined loss of water evaporating from the soil and transpiring (i.e., evaporating from leaves) from the plant (Gambetta, Reference Gambetta2016).
The overall quantity of annual rainfall and its distribution over the growing and nongrowing seasons is crucial when vines are not irrigated as is the case in almost all of Europe. When vines are irrigated, as in almost all U.S. West Coast wine regions, water supply can be optimized and adjusted to the plants’ needs—unless drought conditions limit the water supply. In general, although ample rainfall during the winter and the early vegetative stage is beneficial, rain during bloom and maturation is deemed detrimental.
However, even irrigated vines can experience transpirational restrictions under hot and dry atmospheric conditions, or low relative humidity. As leaf pores (stomata) close incrementally in order to conserve water, photosynthesis decreases. On the other hand, high humidity may increase the likelihood of fungal diseases.
The water-use efficiency (WUE) of grapevines, defined as the ratio between photosynthesis and stomatal conductance, is expected to increase with increasing CO2 levels through increases in photosynthesis. However, Schultz and Stoll (Reference Schultz and Stoll2010) find that increasing leaf temperatures may thwart the positive correlation between CO2 levels and WUE.
Although predictions of the total annual amount of precipitation and its annual and regional distribution are much more uncertain than temperature predictions, Bates et al. (Reference Bates, Kundzewicz, Wu and Palutikof2008) expect increasing water deficiencies in most grape-growing regions.
III. Economic Impact
A. Suitability
An analysis by Nemani et al. (Reference Nemani, White, Cayan, Jones, Running, Coughlan and Peterson2001) suggests that climate changes in coastal California between 1951 and 1997 may have benefited the premium wine industry there. They find that the observed temperature warming trends were asymmetric, with the greatest warming occurring at night and during the spring. This warming was associated with large increases in eastern Pacific sea surface temperatures and rising atmospheric water vapor. Although the average annual warming trend was modest (1.13 °C over the 47 years), they observed a 20-day reduction in frost occurrence and a 65-day increase in the length of the frost-free growing season. More specifically, warmer winter and spring temperatures advanced the start of the growing season in the Napa and Sonoma Valleys by 18 to 24 days per year.Footnote 10
However, gains from past warming may turn into losses if warming continues into the future. To illustrate, White et al. (Reference White, Diffenbaugh, Jones, Pal and Giorgi2006) analyze the impact of climate projections on the suitability distribution of premium wine grape–producing regions (using Winkler regions) in the United States. Based on the IPCC (2000) A2 scenarioFootnote 11 and using growing season average temperatures, they find that the total suitable vineyard area in the United States will decline from approximately 4.1 million km2 to 3.5 million km2 (−14%) by the end of the twenty-first century. However, when they focus on high-quality growing regions, White et al. (Reference White, Diffenbaugh, Jones, Pal and Giorgi2006) find suitable growing areas are reduced by up to 81%. In addition, because climate change shifts most of the premium wine production north (i.e., into the high-precipitation/humidity regions of the Pacific Northwest and the Northeast), substantial (and costly) pest management efforts will be required to address the higher risk of fungal diseases (White et al., Reference White, Diffenbaugh, Jones, Pal and Giorgi2006).Footnote 12
Although the analysis by White et al. (Reference White, Diffenbaugh, Jones, Pal and Giorgi2006) is static (i.e., adaptations are not considered) and thus very pessimistic, it also highlights the shortcomings of average temperature analyses. That is, average temperature analyses hide short-term peaks and troughs and thus may yield biased results (Schlenker and Roberts, Reference Schlenker and Roberts2009). This seems to be particularly relevant to any realistic assessment of the effects of climate change because not only average temperatures, but also their variability are assumed to increase (IPCC, 2013).
B. Crop Yields
Agronomic studies regularly evaluate the effects of climate change by assessing changes in crop yields. Adams, Wu, and Houston (Reference Adams, Wu and Houston2003) provide one of the first analyses of the effect of temperature on California grape (and other crop) yields. For the 1972–2000 period,Footnote 13 they regress crop yields on monthly daytime maximum temperatures and rainfall for the March to September growing seasons and report regionally disaggregated results for four areas and 23 crops.Footnote 14 Based on a warming simulation scenario of 3 °C (with CO2 fertilization), Adams, Wu, and Houston (Reference Adams, Wu and Houston2003) project that wine grape crop yields in the coastal regions of California, including the Napa and Sonoma Valleys, will increase 90% by 2100. Without CO2 fertilization, the crop yields are projected to increase 65%.
In another study, Lobell et al. (Reference Lobell, Field, Cahill and Bonfils2006) analyze six perennial crops in California: wine grapes, almonds, table grapes, oranges, walnuts, and avocados. Their forecast is based on panel models that draw on county data from 1980 to 2003 (as reported in Lobell, Cahill, and Field, Reference Lobell, Cahill and Field2007). For each crop equation, the months and climatic variables of greatest importance were used to examine the relationship between yield and climatic conditions. A crucial difference with the Adams, Wu, and Houston (Reference Adams, Wu and Houston2003) study is the inclusion of minimum night temperatures.
In contrast to Adams, Wu, and Houston (Reference Adams, Wu and Houston2003), Lobell et al. (Reference Lobell, Field, Cahill and Bonfils2006) find that climate change in California is very likely to put downward pressure on yields by 2050, especially for almonds, walnuts, avocados, and table grapes. However, the model projects relatively stable median crop yields for wine grapes (even without CO2 fertilization).
These differences between Adams, Wu, and Houston (Reference Adams, Wu and Houston2003) and Lobell et al. (Reference Lobell, Field, Cahill and Bonfils2006) suggest that temperature may have nonlinear effects on crop yields. To investigate this possibility, Schlenker and Roberts (Reference Schlenker and Roberts2009) use a model that can detect nonlinearities and breakpoints (e.g., detrimental extreme heat or frost exposures that last only a few hours) for corn, soy, and cotton. Based on fine-scaled weather data, they calculate the length of time each crop is exposed to each 1 °C temperature interval per day, summed up for all days of the growing season. For instance, they compute the number of hours a crop is exposed to temperatures above 40 °C, 39 °C, 38 °C, and so on. If the temperature-yield relationship is nonlinear, such averaging over time or space will conceal the true response to temperatures. In this way, Schlenker and Roberts (Reference Schlenker and Roberts2009) are able to identify the optimal temperature for each crop, with temperatures above these thresholds being increasingly harmful to crop yields. They find that “the slope of the decline above the optimum is significantly steeper than the incline below it” (Schlenker and Roberts, Reference Schlenker and Roberts2009, p. 15594). This highlights the importance of extreme temperature (and other weather) events that might not be apparent from an examination of monthly averages.
C. Wine Quality
Higher yields are often associated with lower wine quality. In fact, in order to boost quality, many European AOC laws stipulate maximum yields that must not be exceeded (e.g., Robinson, Reference Robinson2006). Although the negative relationship between yield and quality may hold in many cases in any given year (i.e., in the cross section), over time and in any given vineyard (time series) there appears to be a positive relationship between yields and quality. For example, most high-yield Bordeaux and Burgundy vintages have also produced high-quality wines and vice versa (Robinson, Reference Robinson2006; van Leeuwen and Darriet, Reference van Leeuwen and Darriet2016).
Jones et al. (Reference Jones, White, Cooper and Storchmann2005) analyze the effect of temperature on Sotheby's vintage ratings from 1950 to 1999 for all major wine regions worldwide. Using nonlinear time series models for each region, they show that global warming produces both winners and losers. In general, they find that with increasing temperatures, wine-growing regions in northern France and Germany will produce higher-quality wine, but that wine-growing regions in Spain (Rioja), California, and South Australia (Barossa Valley) may experience a decline in quality.
Using a different approach, Storchmann (Reference Storchmann2005) examines the weather determinants of wine quality of Schloss Johannisberg in the German Rheingau region from 1700 to 2003. He draws on documented vintage classifications (such as “top wine,” “sour,” and “lesser vintage”) in historical harvest books, groups them into five quality ranks, and then regresses these ranks on various weather data. Because (instrumental) weather data for the study period are available only from weather stations in England and, with some restrictions, the Netherlands, he also uses monthly index data based on paleoclimatic indicators such as tree rings. The results indicate that (1) English weather data are a good proxy for the actual weather conditions in the Johannisberg vineyardsFootnote 15 and (2) past warming has improved the quality of Rheingau wines.
One measure of wine quality may be its alcohol content, which, in most cases, is closely related to the sugar content of the grape juice—called must—from which it was made. In general, higher growing season temperatures yield sweeter musts and stronger wines and vice versa. However, at extremely high temperatures, the vine metabolism may be inhibited, which may adversely affect wine aroma and color (e.g., Mira de Orduña, Reference Mira de Orduña2010).
In many wine-growing regions, there has long been a general trend toward wines with a high alcohol content (e.g., Vierra, Reference Vierra2004; Webb, Reference Webb2006). However, it is not a priori clear whether this trend is the result of climate change or deliberate changes in production techniques driven by consumer-induced preferences for heavier wines. Alston et al. (Reference Alston, Fuller, Lapsley and Soleas2011) examine this issue empirically. They first analyze the sugar content in the grapes, which reflects the wine's “potential alcohol,” and find a substantial rise in the sugar content in California wine grapes (measured in Brix).Footnote 16 More specifically, from 1980 to 2005, Brix levels increased by an average of 0.23% per year, which is twice as high for red as for white grapes. In their econometric analysis, Alston et al. (Reference Alston, Fuller, Lapsley and Soleas2011) find that rising temperatures have to some extent contributed to the higher sugar levels, but that their explanatory power is relatively small. Brix levels at harvest were relatively high for red varieties and premium varieties, and for grapes from ultrapremium and premium regions, even though nonpremium regions experienced similar temperature changes. In fact, “the lowest price of wine grapes (under $500 per ton) had significantly lower average degrees Brix at crush compared with all other regions” (Alston et al., Reference Alston, Fuller, Lapsley and Soleas2011, p. 158). These results suggest that most of the Brix increase may have been caused by vineyard management practices. In particular, wineries can respond to changing market demand by lowering yields through pruningFootnote 17 or by permitting longer hang (ripening) times.
Second, Alston et al. (Reference Alston, Fuller, Lapsley and Soleas2011, Reference Alston, Fuller, Lapsley, Soleas and Tumber2015) find that wine alcohol levels have increased with Brix levels. However, the informational value of the alcohol level posted on U.S. wine labels is limited because U.S. law allows a margin of ±1.5% for wine with 14% or less alcohol by volume and ±1.0% for wine with more than 14% alcohol by volume. In contrast, the Liquor Control Board of Ontario (Canada) analyzes every wine sold and posts the “true” alcohol level on the back label. In a comparison of U.S. and Canadian labels, Alston et al. (Reference Alston, Fuller, Lapsley and Soleas2011, Reference Alston, Fuller, Lapsley, Soleas and Tumber2015) find that both New World and Old World wineries systematically understate the alcohol level of their wines. That is, although the “potential alcohol” of wine has increased worldwide, mainly attributable to management practices, because of underreporting, the stated alcohol level does not fully reflect this trend.
D. Wine Prices
The connection between wine quality and price has been known for centuries. For example, prices of vineyard sites have been assessed for taxation purposes in the Mosel Valley of Germany since the seventeenth century (Ashenfelter and Storchmann, Reference Ashenfelter and Storchmann2010b). Likewise, the vineyard classifications in Bordeaux and Burgundy are based on wine prices (e.g., Markham, Reference Markham1997). These evaluations are based mainly on the physical traits of the land and thus focus on the cross section of vineyards rather than on changes over time (e.g., weather fluctuations).
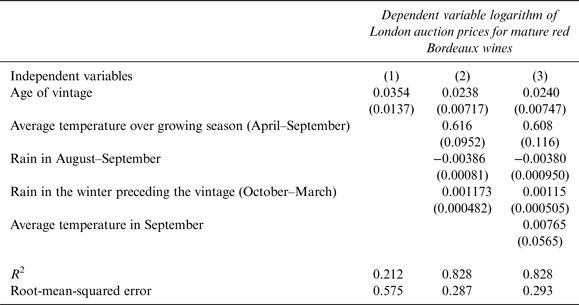
The first econometric evaluations of the effect of weather on fine wine prices (i.e., analyzing changes over time) were carried out by Ashenfelter (e.g., Ashenfelter, Reference Ashenfelter1986, Reference Ashenfelter1987a, Reference Ashenfelter1987b, Reference Ashenfelter1990; see also Storchmann, Reference Storchmann2012). Although he analyzes wines from various regions, Ashenfelter focuses on grand cru (high quality) wines from the Bordeaux region. In one of the earliest studies of the economics of wine (based on work done in the 1980s), Ashenfelter, Ashmore, and Lalonde (Reference Ashenfelter, Ashmore and Lalonde1995) regress cross-sectional auction price data for a basket of Bordeaux grand cru wines on various weather variables and the age of the vintage. They find that increasing the growing season temperature by 1 °C results in a price increase of 61.6% (see Table 1). Given that since 1945 average growing season temperatures in Bordeaux have ranged from 14.98 °C (1972) to 19.83 °C (2003), it is not surprising that there have been large variations in Bordeaux prices.
Bordeaux Wine Prices and the Weather
Notes: All regressions are of the (logarithm of) the price of different vintages of a portfolio of Bordeaux château wines on climate variables, using as data the vintages of 1952–1980, excluding the 1954 and 1956 vintages, which are now rarely sold; all regressions contain an intercept, which is not reported. Standard errors are in parentheses.
Source: Ashenfelter (Reference Ashenfelter2010).
This range in past temperature variations allows economists to make inferences for the future. In fact, predicted temperature increases for the European wine-growing regions for this century are between 1.5 °C and 5 °C (e.g., European Commission, 2009; IPCC, 2007a)—a variation that is within the already experienced range of regular annual weather fluctuations. However, the results for the Bordeaux region also suggest that excess rainfall at the end of the growing season may be harmful to wine prices.
The projected precipitation changes associated with climate change are less reliable than those for temperature and generally indicate that precipitation will increase in Scandinavia and decrease in southern Europe; the direction of any precipitation changes in the middle of Europe, including France, is currently uncertain (European Commission, 2009). If we assume future temperature increases but no changes in precipitation, then the Ashenfelter, Ashmore, and Lalonde (Reference Ashenfelter, Ashmore and Lalonde1995) model for Bordeaux predicts substantial price increases for Bordeaux grands crus. In fact, there have been notable temperature increases in the Bordeaux region since the 1980s, and Bordeaux wine prices are currently at all-time highs.Footnote 18
Jones and Storchmann (Reference Jones and Storchmann2001) confirm the positive effect of higher temperatures on the Bordeaux wine region. They model the effect of weather by estimating cross-sectional equations for each of 21 selected premiers crus châteaux. Given that each château's wine is a unique blend that is dominated by either Cabernet Sauvignon, Merlot, or a blend of the two,Footnote 19 the authors first calculate the weather's impact on the sugar and acid levels of each grape variety and then estimate a price equation. They find that Merlot is more weather responsive than Cabernet Sauvignon. That is, under a global warming scenario, Merlot-dominated wines (such as Château Petrus) would benefit disproportionally (i.e., they would experience higher prices than Cabernet Sauvignon–dominated wines).
Oczkowski (Reference Oczkowski2016) employs a similar two-stage model on wine quality and price for various Australian regions and finds that there are winners and losers from further warming.
In another study of the Bordeaux region, Chevet, Lecocq, and Visser (Reference Chevet, Lecocq and Visser2011) study prices and yields of a premier cru château from 1800 to 2009. They show that temperature has a positive impact on both yields and prices. However, they find that although the temperature responsiveness of crop yields has fallen dramatically over time, prices have become substantially more sensitive to growing season temperature changes.Footnote 20 These results suggest that technological improvements have helped winegrowers to reduce the impact of weather on crop yields. However, the findings also suggest that changes in prices have not resulted solely from changes in quantities. That is, increased wine quality and growing market demand appear to have more than offset any effect that yield increases (due to warmer growing seasons) have had on prices.
The studies of Bordeaux just discussed all use linear temperature specifications. That is, the marginal effect of temperature on wine prices is implicitly assumed to be constant over the entire observed temperature spectrum. This assumption may be appropriate for regions in cooler climates, such as Bordeaux and Germany, or when drawing on data from colder time periods such as the “Little Ice Age” of the early and mid-nineteenth century. However, for warmer regions, especially those that are not in Europe, nonlinear specifications may be more appropriate. For example, Byron and Ashenfelter (Reference Byron and Ashenfelter1995) use a quadratic regression specification to analyze the Australian wine known as the Grange and find that wine prices rise with increasing temperatures but at a decreasing rate. Wood and Anderson (Reference Wood and Anderson2006) also use a quadratic and cubic temperature specification for Australian icon (e.g., Penfold's Grange) wine prices and produce similar nonlinear results. Haeger and Storchmann (Reference Haeger and Storchmann2006) estimate a quadratic function for U.S. Pinot Noir wines that has a price-maximizing peak when the growing season temperature is 22.2 °C. Many U.S. growing regions already have temperatures that are higher than this (Salem, Oregon: 23.2 °C; Napa, California: 26.2 °C; Paso Robles, California: 30.3 °C). This suggests that further warming may have detrimental effects on Pinot Noir prices in America's western growing regions. In contrast, it appears that Burgundy (Dijon: 22.0 °C) and the German wine regions (Karlsruhe, Pfalz: 21.3 °C) may benefit from further warming.
E. Revenue and Profit
Many of the studies we have discussed use static models and thus do not consider the interdependences of quantity and prices. Moreover, there are almost no studies that analyze cost or profits as a function of climatic variables. Because, for example, decreasing quantities may be partially offset by increasing prices, many yield-focused models may overestimate weather-induced effects. These problems can be avoided by instead examining revenue (i.e., quantity times price) or profit.
(1) Wine Revenue
Webb (Reference Webb2006) analyzes grape gross returns for Australia. In a first step, she generates revenue data (in A$ per hectare) by grape variety by multiplying varietal prices and crop yields across all Australian wine regions for 2002. Then, in a cross-sectional analysis, she regresses these revenue measures on weather data and finds significant (quadratic) relationships between revenue and temperature for Cabernet Sauvignon, Merlot, Shiraz, Chardonnay, and Semillon. In a second step, the findings are applied at the regional level by weighting the varietal results according to the respective planted area within each wine-growing region. The national effect of temperature on wine revenue is calculated as the weighted average of the regional results. Depending on the climate change scenario, Webb (Reference Webb2006) finds losses in gross national returns of between 9.5% and 52% by 2050. However, because these results consider neither winemaker adaptations nor varietal substitutions within or across regions, the overall (i.e., national) results may be interpreted as a worst-case “dumb farmer” scenario.Footnote 21
(2) Value of Land
In order to examine a vineyard's rentability, Ashenfelter and Storchmann (Reference Ashenfelter and Storchmann2010b) analyze the value of land (i.e., discounted future land rents) for vineyards in the Mosel Valley of Germany. In the first of three models, they examine the Prussian vineyard classification system of 1868. This system was based on land profitsFootnote 22 for the 1837–1860 period, whereby the Prussian government assigned one of eight ranks to each vineyard, with rank-one vineyards commanding the highest wine prices (and thus being highly profitable), and rank-eight vineyards yielding the lowest (if any) profits. This vineyard classification was not implemented as a guide for wine aficionados, but rather as the basis for calculating fair and just taxes—with high-profit land taxed more than low-profit land. Ashenfelter and Storchmann (Reference Ashenfelter and Storchmann2010b) show that the Prussian ranking of vineyards (and thus the willingness to pay for wine) is based on the most important physical characteristics of a vineyard: soil type and the land's potential to capture incoming solar radiation (i.e., energy). The darker the soil (mainly dark slate that stores heat) and the higher the potential solar energy of a vineyard, the higher is its rank. This energy potential depends on the vineyard's latitude, slope, and orientation. For the German Mosel region, which is located at the northern frontier of commercial viticulture, energy is a scarce resource; thus, the best vineyards are south facing and exhibit a 45-degree slope. Ashenfelter and Storchmann (Reference Ashenfelter and Storchmann2010b) use an equation to link solar radiation to temperature so that higher temperatures from climate change can be linked to price effects associated with better vineyards. This implies that higher temperatures will increase the likelihood of a certain vineyard being in a high-quality rank. In effect, further warming will shift the rank distribution of all Mosel vineyards from lower to higher quality, thus increasing land prices. They show that under a warming scenario of 3 °C, the value of vineyards in the Mosel may double.
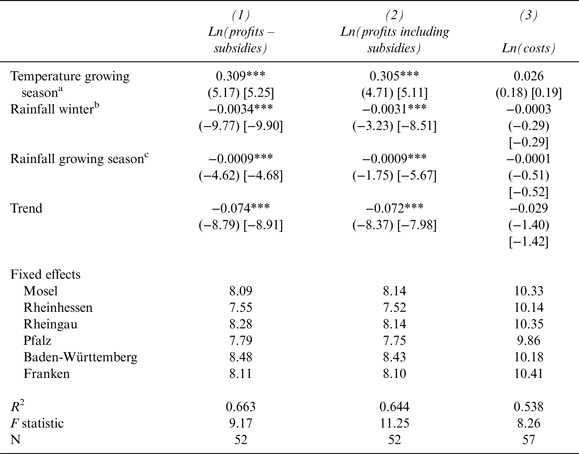
Ashenfelter and Storchmann (Reference Ashenfelter and Storchmann2010b) compare these results with two different time series models. In one model, they regress accounting data on profits for wineries from various West German wine-growing regions on weather variables. They find that the marginal effect of temperature on winery profits (excluding subsidies) is approximately 0.309 (Table 2). This means that an increase in the growing season temperature of 3 °C would raise profits by approximately 150%. Interestingly, they find that temperatures do not alter production costs, which means that profit and revenue increases are virtually identical.
Weather and Real per Hectare Profits, Subsidies, and Costs of German Wineries
Notes: a February to October, in degrees Celsius. b December to February prior to growing season in millimeters. c April to October in millimeters. We refer to weather data from the station in Trier (Mosel). Significance level of 1% (***), 2% (**), 5% (*), 6.6% (+). Newey-West robust t values in parentheses; t values based on year clustered standard errors in brackets.
Source: Ashenfelter and Storchmann (Reference Ashenfelter and Storchmann2010b).
In the second time series model, Ashenfelter and Storchmann (Reference Ashenfelter and Storchmann2010b) regress Mosel wine revenues on temperatures and find that both crop yields and prices respond positively to higher growing season temperatures. This model suggests that a warming of 3 °C may raise revenue by approximately 180%. Hence, all three models indicate a positive relationship between growing season temperatures and profits, revenues, or land values. Given the very different nature of these models, the results are remarkably consistent.
In a different study, Ashenfelter and Storchmann (Reference Ashenfelter and Storchmann2010a) show that depending on the wine sample considered, regressing price on temperature may produce biased results. More specifically, a comparison of auction, retail, and wholesale prices indicates strong positive temperature effects for wines sold at auction but much smaller effects for a sample of wholesale price data. Thus, there is a considerable range in the computed revenue effects due to temperature changes. Because only a tiny fraction of the wines produced are sold at auction (e.g., only those of higher quality), results based on auction prices may overstate the effect of climate warming.
(3) Net Value Added
In a study similar to that by Ashenfelter and Storchmann (Reference Ashenfelter and Storchmann2010b), Antoy, Ashenfelter, and Storchmann (Reference Antoy, Ashenfelter and Storchmann2010) use accounting data to analyze the climate's impact on various economic variables related to grape growers, including cost, revenue, and value added. In particular, they draw on the European Union's (EU) Farm Accounting Data Network database, which provides accounting data for a sample of test farms that represent approximately 3% of all European wineries. The grape-related data cover 85 European regions (administrative districts) for the 1989–2009 period.Footnote 23 Temperature and rainfall data were taken from one local weather station in each district. This means that for small districts, such as Luxemburg, the station data may reflect the weather in the vineyard fairly well. However, for larger districts, such as Austria, weather data from only one station may be problematic, especially concerning precipitation data.
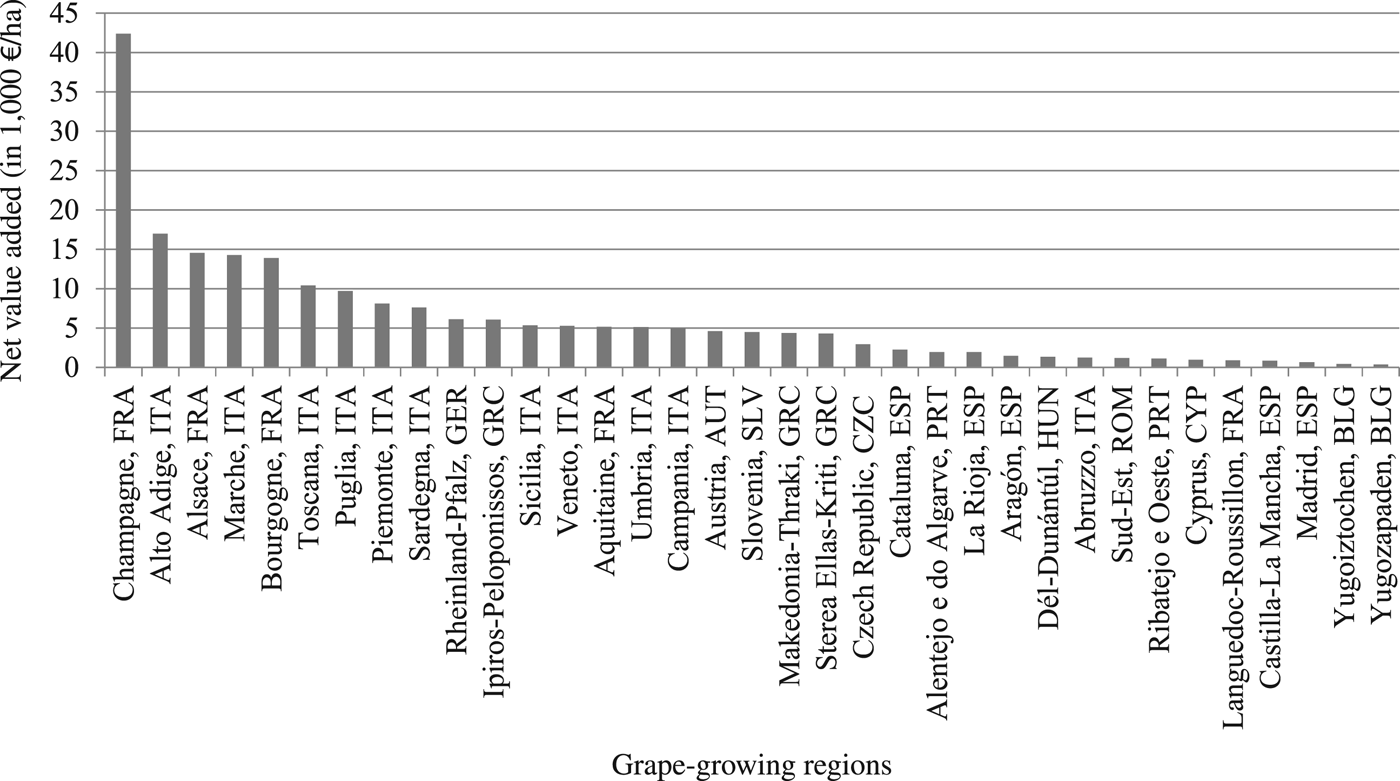
When examining 2009 net value added per hectare in selected grape-growing regions, Antoy, Ashenfelter, and Storchmann (Reference Antoy, Ashenfelter and Storchmann2010) find values ranging from €378 in Yugozapaden (Bulgaria) to €42,396 in the Champagne region of France (see Figure 2). The figure also indicates that all of the low-value regions are located in southern or eastern Europe, whereas the high-value regions are either near the northern frontier of commercial viticulture or in close proximity to the Alps. Antoy, Ashenfelter, and Storchmann (Reference Antoy, Ashenfelter and Storchmann2010) find an even stronger pattern for tax payments. Wineries in only eight regions are net tax payers, whereas most pay negative taxes (i.e., the subsidies they receive exceed the taxes they pay). Whereas grape growers in the Champagne region sample paid on average €761 in net taxes per hectare, grape growers in Ipiros-Peloponissos (Greece) received €2,022 in net subsidies per hectare (see Table 3).
Net Value Added in Selected European Grape-Growing Regions in 2009
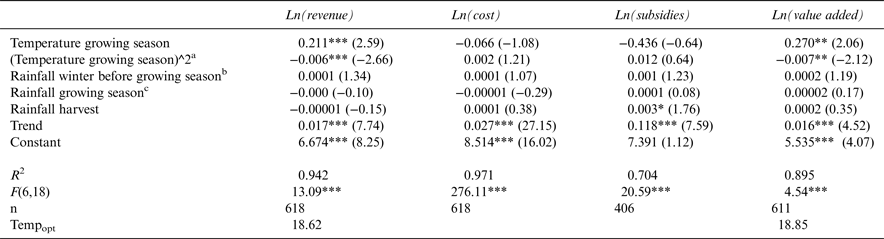
Weather, Revenue, Cost, Subsidies, and Value Added in Regions of the European Union (in nominal euros per hectare)
Notes: All equations with region-fixed effects. aMarch–October in degree Celsius. bDecember–February prior to growing season in millimeters. cMarch-August in millimeters. Robust t values based on year-clustered standard errors. Significance level 2% (***), 5% (**), 10% (*).
Source: Antoy et al. (Reference Antoy, Ashenfelter and Storchmann2010).
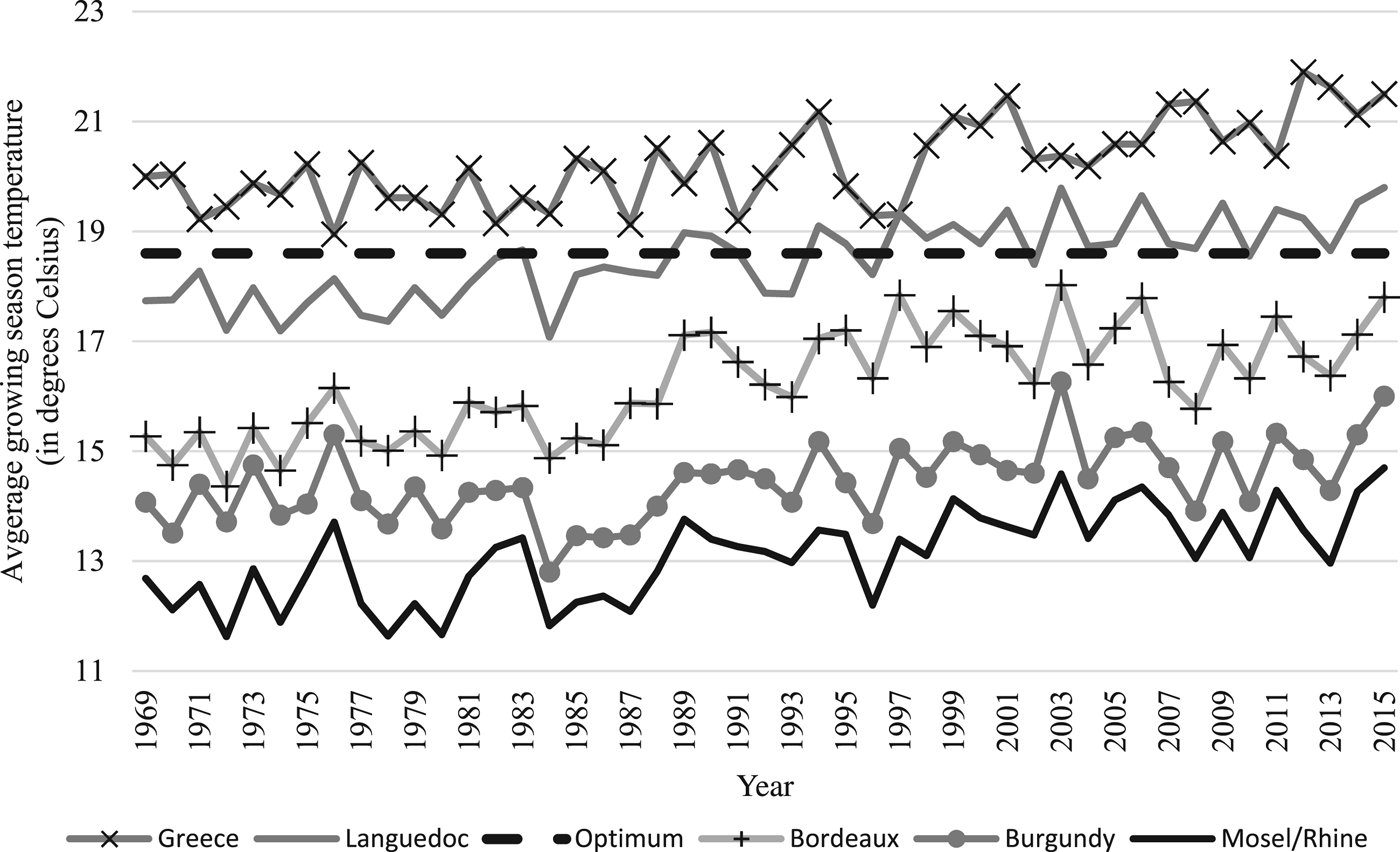
The results of their model also allow Antoy, Ashenfelter, and Storchmann (Reference Antoy, Ashenfelter and Storchmann2010) to calculate average growing season temperatures that maximize revenue (18.62 °C) and value added (18.85 °C), respectively. Figure 3, which shows developments in average growing season temperatures in selected grape-growing regions from 1969 to 2015 compared with the calculated value-added optimum, leads to some interesting conclusions.
Average Growing Season Temperatures in Selected Wine Regions, 1969–2015
First, all western European regions display identical temperature patterns over time, with lows in 1987 and 1996 and peaks in 2003; only the levels are different. We are interested only in temperature variations; thus, this suggests that temperature data from any weather station in western Europe may be a good proxy for the respective conditions in any vineyard. In fact, Lecocq and Visser (Reference Lecocq and Visser2006) and Haeger and Storchmann (Reference Haeger and Storchmann2006) have shown for Bordeaux and California, respectively, that using temperature data from many local stations does not yield better results than using data from only one station.
Second, the temperature differences across regions indicate that adaptation may be significantly more difficult in some regions than others. For example, further warming in the Rhine and Mosel Valleys of Germany will move this region closer to the temperature optimum,Footnote 24 whereas in Greece, where a large fraction of grape production is already used for raisins, further warming will leave few, if any, options for viticulture. We discuss the issue of adaptation in more detail in the next section.
IV. Adaptation Methods
Grapevines have been cultivated for thousands of years, and vintners have proved their adaptability to many environmental and economic changes through regional shifts in the areas planted, variation in harvest times, new production technologies, and the substitution of cultivars.
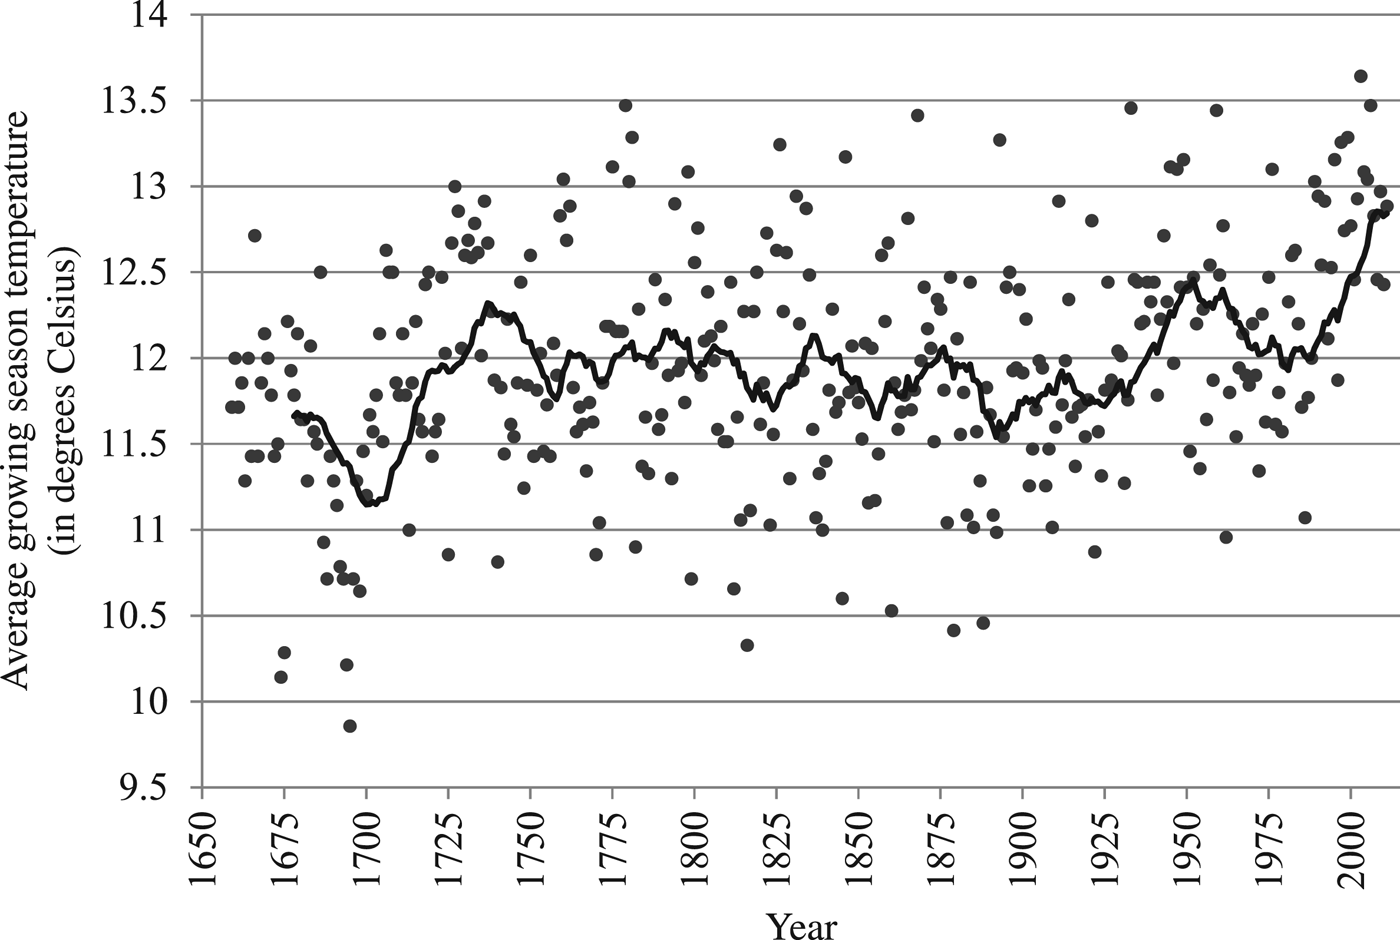
Figure 4 depicts growing season temperatures for the longest existing measured data series based on temperature instrumentation. This Manley series for central England, begins in 1659 and has been updated to the present (Met Office Hadley Centre, 2012). Storchmann's (Reference Storchmann2005) analysis of Rhine wine quality suggests that the Manley series serves as a good proxy variable for temperatures in all west European wine-growing regions. The 20-year moving average line exhibits an upward trend, which is especially pronounced after approximately 1970.Footnote 25
Growing Season Temperatures for 1659–2011, Manley Series for Central England
A. Harvest Dates
One of the oldest documented adaptation methods for grape production has been for farmers to adjust to the vines’ phenological stages and complete certain work, such as picking, independent of the calendar date. For example, Le Roy Ladurie and Baulant (Reference Le Roy Ladurie, Baulant, Rotberg and Rabb1981) examine harvest dates for Burgundy from 1659 to 1879. Figure 5 depicts a plot of harvest dates after August 31 and growing season temperatures in central England (Manley series). A simple linear regression line shows that warmer temperatures lead to earlier harvest dates and vice versa. Van Leeuwen and Darriet (Reference van Leeuwen and Darriet2016) report similar relationships for other French wine-growing regions.
Temperatures and Harvest Dates in Burgundy, 1659–1879
B. Northward Movement and Planting Regulations in the European Union
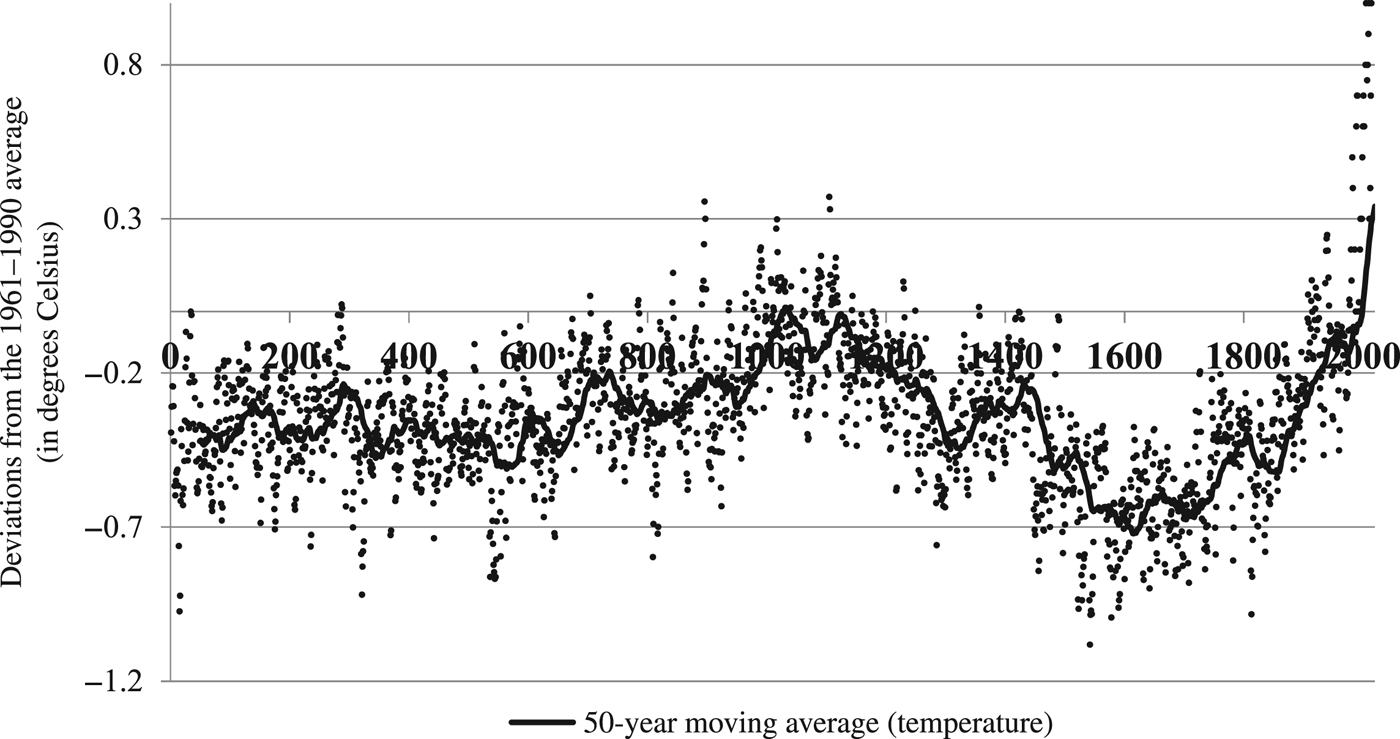
Climate shifts are not a new phenomenon to European viticulture. Temperature reconstructions based on proxy data such as tree rings suggest that Europe has experienced several long-term climate changes. Figure 6 displays annual temperature deviations from the 1961–1990 average for the time period from the year 1 to 2014 for the Northern Hemisphere (Moberg et al., Reference Moberg, Sonechkin, Holmgren, Datsenko and Karlén2005 [the data are downloadable from ftp://ftp.ncdc.noaa.gov/pub/data/paleo/contributions_by_author/moberg2005/nhtemp-moberg2005.txt]). Like many other analyses (e.g., Jones and Mann, Reference Jones and Mann2004; Mann, Bradley, and Hughes, Reference Mann, Bradley and Hughes1999; Pfister, Reference Pfister, Wanner and Siegenthaler1988), the Moberg data suggest the occurrence of a Medieval Warm Period (950 to 1200) followed by a Little Ice Age (1600 to 1850). There is evidence that the northern frontier of commercial viticulture reached as far north as northern Germany and the Baltics during the Medieval Warm Period. Waldau (Reference Waldau1977) and especially Weber (Reference Weber1980) provide a detailed account of—possibly partly climate induced—shifts that occurred over the past 900 years.
2,000-Year Northern Hemisphere Temperature Reconstruction Based on Proxy Data from Year 1 to 2014
Similarly, increasing temperatures may induce grape growers to move toward the North and South Poles or into higher elevations.Footnote 26 In addition to being costly for the wine industry itself, this geographic shift may also lead to conservation conflicts in land use and freshwater ecosystems. Hannah et al. (Reference Hannah, Roehrdanz, Ikegami, Shepard, Shaw, Tabor, Zhi, Marquet and Hijmans2013) and Roehrdanz and Hannah (Reference Roehrdanz and Hannah2016) predict considerable conflicts between vineyards and resident wildlife worldwide. Within the United States, their studies point to areas in the Rocky Mountains and the border area between Washington State and British Columbia that are becoming increasingly desirable for viticulture, which, in turn, may displace animals and native plants.
The extent to which vineyards will be permitted to shift geographically remains unclear. Although most countries do not restrict new vineyard plantings, the EU, the world's largest grape producer,Footnote 27 requires the possession of planting rights to do so. This regime of planting rights was introduced in 1976, initially as a temporary measure aimed at capping the area under vines and controlling wine production in southern European regions, where inexpensive bulk wine has been produced (European Commission, 2012). Because planting rights are distributed by country, and the quotas reflect the status quo, monopoly power is granted to the incumbent producers.
Because it is currently illegal to plant vineyards without planting rights and planting rights are not allowed to be traded among countries (Deconinck and Swinnen, Reference Deconinck and Swinnen2014), it may not be possible for further vineyard planting to follow suitable climatic conditions further north. Thus, the EU's current planting rights regime inhibits the adaptation process within the EU: existing grape-growing regions in the south may become too warm, but suitable land in the north may not be planted. This may increase incentives for new plantings in non-EU regions.
In 2007, in order to enhance the competitiveness of the wine-producing sector, the EU agreed to abolish the planting rights scheme by 2016. However, and perhaps not surprisingly, considerable opposition has been mobilized against the planned liberalization,Footnote 28 making it unclear whether the planned deregulation will actually occur. The compromise solution that is currently being discussed retains the existing planting policy for all the current wine-growing countries but exempts Belgium, Denmark, Estonia, Finland, Ireland, Latvia, Lithuania, the Netherlands, Poland, the United Kingdom, and Sweden. However, additional plantings within many countries with marginal climates (i.e., those that would potentially benefit from climate change), such as Germany, Austria, and the Czech Republic, would not be exempt from the existing policy.
C. New Cultivars and Rootstocks
As already mentioned earlier, global warming will require the substitution of grape cultivars, moving from the left to the right through the cultivar spectrum in Figure 1. It is apparent that the substitution potential is smaller the more that a wine region is already relying on cultivars on the right end of the figure, and vice versa.
Substantial changes in varietal composition have already occurred in England and Germany. In 2004, 80% of the 662 ha vineyard area in England and Wales was planted with hardy German crossings (mostly Reichensteiner) and hybrid grapes (Seyval Blanc). Both of these varietals are located to the left of Müller-Thurgau in Figure 1. However, in 2013, the vineyard area had grown to 1,424 ha, with Chardonnay and Pinot Noir accounting for the largest shares of the planted area, 23% and 22%, respectively (Wine Stats, 2014). Germany has also experienced a marked shift toward red varieties—from a white-to-red ratio of the planted acreage of 80:20 in 1996 to 64:36 in 2014. Cabernet Sauvignon and Merlot combined now account for more than 10% of all new red plantings (Statistisches Bundesamt, 1997, 2015).
In addition to substitution among existing cultivars, scientists have experimented with new drought-resistant rootstock (e.g., Walker and Clingeleffer, Reference Walker and Clingeleffer2009) and new, genetically modified grape cultivars (e.g., Camargo et al., Reference Camargo, Maia, Ritschel and Revers2008; Duchêne et al., Reference Duchêne, Huard, Dumas, Schneider and Merdinoglu2010; Webb, Clingeleffer, and Tyerman, Reference Webb, Clingeleffer, Tyerman, Yadav, Redden, Hatfield, Lotze-Campen and Hall2011).
One important barrier to substitution is that many European wine-growing regions and their system of geographic indication (appellations) permit the planting of only certain grape varieties for their specific terroirs. For example, Institut National d'Origine et de la Qualité (INAO), which regulates the AOC system in France, defines which grape varieties and wine-making practices are approved for classification in each of France's several hundred geographically defined appellations. It allows, for example, only four grape varieties for the Burgundy appellation (Pinot Noir, Gamay, Chardonnay, and Aligoté) and three for Champagne (Pinot Noir, Pinot Meunier, and Chardonnay). Increasing temperatures mean that these regulations and the close link between specific grape varieties and locations (terroirs) may have to be abolished.
D. Production Technologies
In addition to changing the variety planted or even moving the vineyard to a more conducive location, grape growers can adjust the production technologies for an existing vineyard. For example, Webb et al. (Reference Webb, Watt, Hill, Whiting, Wigg, Dunn, Needs and Barlow2009) examine winemakers’ responses to the Australian heat wave in 2009 and find that growers were able to take measures to mitigate the heat damage. Two issues were found to be critical. First, full-capacity watering before and during the extreme heat helped to minimize damage. The water needs of high-yield vines were especially high, whereas vines grafted on drought-resistant rootstocks required less water.
Although irrigation is common practice in most vineyards in the New World, in most of Europe, natural precipitation is considered to be the only acceptable source of water for vines. No doubt this results, at least in part, from the fact that sufficient rainfall is common in European vineyard areas. Nevertheless, historically, the wine laws of the EU have prohibited vineyard irrigation. Thus, adaptation along these lines will take some institutional changes. In fact, in recent years, the irrigation ban has been relaxed in Spain, and the INAO has been reviewing the issue in France.
Second, good canopy (the leaf coverage of the grapevine) growth and canopy manipulation (see also Smart and Robinson, Reference Smart and Robinson1991) helped to protect berries from direct exposure to radiant heat during the Australian heat wave. This effect can also be achieved by changing the row orientation of grapevines from north–south to west–east. In addition, growing a cover crop on the interrow space can mitigate the additional heat reflected from the soil (e.g., Winkler et al., Reference Winkler, Cook, Kliewer and Lider1974).
E. Enological Adaptations
Higher temperatures result in riper grapes with elevated sugar concentrations in the must, higher potential alcohol levels, and lower acidity (van Leeuwen and Darriet, Reference van Leeuwen and Darriet2016). Although such developments may be desirable in cool-climate grape-growing regions such as eastern Canada, Germany, or northern France, they may become detrimental to quality and “typicity” (i.e., the wine style that is associated with a certain region) in many established wine regions. In addition, rising temperatures will change the composition of aroma compounds in the grape. With increasing ripeness, the predominant flavor profile of many red wines will move from “green aromas” (unripe) to aromas of figs and coconut (or petrol in Riesling) that can be found in wines produced from overripe fruit (van Leeuwen and Darriet, Reference van Leeuwen and Darriet2016).
In the winery, excessive alcohol levels can be reduced through technologies such as reverse osmosis or the spinning cone. In some cases, adding water to the wine is another option. Although illegal in the EU, this technology is not uncommon in some New World countries (Gibb, Reference Gibb2014).
More recently, scientists have been developing yeast strains that do not metabolize all sugar into ethanol and turn sugar into other products such as glycerol. This means the yield of alcohol per gram of sugar will be less (Contreras et al., Reference Contreras, Hidalgo, Henschke, Chambers, Curtin and Varela2014). However, new yeasts are not without problems as they also affect the wine's flavor profile.
Wines can lack freshness when acidity is too low. In addition, high pH levels may foster the wild yeast Brettanomyces bruxellensis, which can spoil the wine. However, low total acidity levels are routinely remedied by adding blends of tartaric, malic, and citric acid, and Brettanomyces yeasts can be contained through the addition of sulfur dioxide (e.g., Robinson, Reference Robinson2006).
V. Summary and Conclusions
This article has provided an overview of the growing economic literature on viticulture and climate change. Numerous studies examine the relationship between weather and economic outcomes—such as wine prices and quality, prices for vineyard land, and winery revenue and profits for various wine-growing regions and cultivars. Based on current conditions, the evidence indicates that rising growing season temperatures can be either beneficial or detrimental to viticulture. This means there will be both winners and losers from climate change. In general, the evidence suggests that wine-growing regions located near the northern frontier of commercial viticulture (e.g., Germany)—or the southern frontier in the Southern Hemisphere (e.g., Patagonia or Tasmania)—will benefit from further warming, but that regions that are located closer to the equator (e.g., Spain) will be adversely affected.
Despite the progress that has been made in assessing the economic impacts of climate change on wine and viticulture, these analyses suffer from several limitations. First, many unresolved issues remain concerning current weather impacts and future weather and climate patterns. Most analyses rely solely on measures of average temperatures, which may fail to fully account for the effect of extreme temperatures. In addition, there is still great uncertainty about future rainfall levels. Some viticultural regions may face droughts and increased water stress, whereas others will likely become wetter. Similar uncertainty remains concerning wind and hail.
Second, many studies consider only partial equilibria and ignore the interdependent relationships between crop yield, quality, and price. Given the negative relationship between crop yield and price, such partial analyses tend to overestimate the economic impact of global warming.
Third, many analyses do not consider the possibility of farmer adaptations and instead assume a “dumb farmer” scenario. However, grape growers and winemakers have shown their adaptability to changing climatic and economic environments for thousands of years. Earlier harvest dates, the rapidly increasing vineyard area in Canada and England, and the increasing plantings of red warm-climate varietals such as Merlot or Cabernet Sauvignon may be just three examples of current adaptations to a warming climate. Thus, ignoring farmer adjustments, even if they are only partial, will overestimate the long-term costs of climate change.
Finally, climate change is likely to disproportionately affect grape growers and winemakers in European countries, such as France, that emphasize their location in their marketing rather than the grape varieties they grow, which inhibits various adaptations. Neither varietal nor regional substitutions can be easily achieved in these countries and, in some cases, are prohibited. This suggests that the notion of terroir wines, where a grape variety is expressed in terms of certain land and weather characteristics, may be too inflexible to allow for adaptations to a changing climate. Thus, unless the appellation rules in Europe are loosened and planting rights are abolished, this region is likely to be one of the losers from climate change.