INTRODUCTION
Current models of phonological acquisition rely on the core assumption that the mechanisms and processes used in learning first (L1) and second (L2) language phonetic systems remain intact over the course of a lifetime (Best & Tyler, Reference Best, Tyler, Bohn and Munro2007; Flege, Reference Flege and Strange1995). These models claim that L2 sounds that do not occur or are phonetically different from those of a learner’s L1 are filtered through preexisting phonological knowledge, resulting in accentedness. At the same time, the phonology of an L2 can influence that of an L1, especially after long-term contact (e.g., Chang, Reference Chang2012; Flege, Reference Flege1987; Sancier & Fowler, Reference Sancier and Fowler1997). To date, the available evidence on patterns of cross-language phonetic influence (i.e., L1-to-L2 and/or L2-to-L1) has mostly been obtained either with real-word items or nonce-word items analogous to real words (e.g., Antoniou et al., Reference Antoniou, Best, Tyler and Kroos2011; Flege, Reference Flege1987; Mennen, Reference Mennen2004; Sancier & Fowler, Reference Sancier and Fowler1997); few studies have investigated whether such patterns hold for other types of productions that occur in spontaneous speech.
In this article, we ask whether patterns of cross-language phonetic influence hold in the bilingual production of pauses. As a category of discourse in the speech chain, pauses are largely thought to reflect interruptions in the speech-production system. Specifically, we focus on filled pauses (FPs), which are hesitations consisting of a vowel alone (e.g., eh, uh), a nasal consonant alone (e.g., mm), or a vowel followed by a nasal consonant (e.g., em, um).Footnote 1
FPs are an apparent universal feature of human language—they are the phonetic outcome of the cognitive processes underlying speech production (e.g., Goldman-Eisler, Reference Goldman-Eisler1961, Reference Goldman-Eisler1968; Levelt, Reference Levelt1983; Maclay & Osgood, Reference Maclay and Osgood1959; see also Adell et al., Reference Adell, Escudero and Bonafonte2012, p. 461). Some scholars adopt a broad definition of what constitutes an FP, arguing for a reduction in the distinctions between FPs, discourse markers, and even lexical items (see Clark & Fox Tree, Reference Clark and Fox Tree2002; Graham, Reference Graham2013; Swerts et al., Reference Swerts, Wichmann and Beun1996). This difference in conceptualization notwithstanding, one incontrovertible point is that increased hesitations, such as FPs, are a key feature of foreign accentedness (e.g., Derwing et al., Reference Derwing, Rossiter, Munro and Thomson2004)—an investigation into learners’ disfluency patterns thus offers the opportunity to empirically study the effects of long-term L2 learning. In L2 research, most studies classify hesitations categorically (i.e., presence or absence of FP), thereby rendering the phonetic detail of FPs a largely unexplored area. To uncover the precise acoustic correlates of FPs in bilingual speech, we conducted an instrumental analysis of FP usage for a community of Afrikaans-Spanish bilinguals living in Patagonia, Argentina. Our broad objective was to understand whether bilingual FPs display cross-language influences that are similar to those documented in traditionally understood lexical items (e.g., Antoniou et al., Reference Antoniou, Best, Tyler and Kroos2011; Flege, Reference Flege1987; Sancier & Fowler, Reference Sancier and Fowler1997).
The Patagonian Afrikaans-Spanish bilingual community represents a case of language contact between Afrikaans and Spanish that, to our knowledge, is not replicated in any other region in the world. The community members are descendants of Afrikaans settlers who arrived from Africa to Argentina in the early 1900s (Coetzee et al., Reference Coetzee, García-Amaya, Kim, Wissing, Henriksen, Calhoun, Escudero, Tabain and Warren2019; du Toit, Reference du Toit1995; Henriksen et al., Reference Henriksen, Coetzee, García-Amaya, Alberto, Langland, Szpiech and Shapero2018, Reference Henriksen, García-Amaya, Coetzee, Wissing, Colina and Martínez-Gil2019; Szpiech et al., in press). Currently, the oldest bilinguals are third-generation speakers over the age of 60 who acquired Afrikaans as an L1 from birth and Spanish as an L2 when they began school (usually age seven or eight to late teenage years). As the present study demonstrates, these conditions result in an intricate array of data patterns that offer evidence into the nature of cross-language phonetic influence in the production of FPs.
BACKGROUND AND MOTIVATION
PAUSING IN L1 AND L2 SPEECH
Two of the most widely studied speech disfluencies are silent pauses (SPs, also called unfilled pauses) and FPs. SPs are typically defined as silences with a minimum threshold of duration between 100 (Riazantseva, Reference Riazantseva2001) and 400 ms (Derwing et al., Reference Derwing, Rossiter, Munro and Thomson2004). FPs, however, are productions consisting typically of a vowel alone (e.g., eh, uh), a nasal consonant alone (e.g., mm), or a vowel followed by a nasal consonant (e.g., uh, um) in languages such as Spanish and Afrikaans (cf. Rose, Reference Rose2017).Footnote 2
Both pause types have been associated with syntactic planning (e.g., Mirdamadi & de Jong, Reference Mirdamadi and de Jong2015; Shriberg, Reference Shriberg1994) and lexical access (e.g., Goldman-Eisler, Reference Goldman-Eisler1961, Reference Goldman-Eisler1968; Maclay & Osgood, Reference Maclay and Osgood1959). Hesitations such as SPs and FPs are prevalent in L2 speech, which requires extra time and effort in the speech-production process (Bosker et al., Reference Bosker, Quené, Sanders and de Jong2014; de Jong, Reference de Jong2016; de Jong et al., Reference de Jong, Groenhout, Schoonen and Hulstijn2015; García-Amaya, Reference García-Amaya, Collentine, García, Lafford and Marcos-Marín2009; Segalowitz & Freed, Reference Segalowitz and Freed2004). Theoretically, the analysis of FPs falls within the domain of utterance fluency, often measured through the use of empirical metrics based on the count and duration of words, syllables, and hesitation phenomena (see Tavakoli & Skehan, Reference Tavakoli, Skehan and Ellis2005). One recurring theme from this body of work is that many characteristics of a speaker’s L2 are modulated by their L1 fluency patterns (e.g., de Jong & Mora, Reference de Jong and Mora2019). In our study, we include speech data from the bilinguals’ L1 and L2, as well as from comparison speakers of each target language.
Critically, the vast majority of research on L2 fluency classifies FPs as categorical elements in the speech chain, namely whether FPs are present or absent in speech (e.g., Bosker et al., Reference Bosker, Quené, Sanders and de Jong2014; de Jong, Reference de Jong2016; de Jong et al., Reference de Jong, Groenhout, Schoonen and Hulstijn2015; García-Amaya, Reference García-Amaya, Collentine, García, Lafford and Marcos-Marín2009; Segalowitz & Freed, Reference Segalowitz and Freed2004). Yet, we also know that the production of FPs requires the realization of individual vocalic and/or nasal phonemes (e.g., eh, uh, em, um, mm). Research on monolingual speakers shows that the phonetic details of FPs are susceptible to patterned sociophonetic variation (Tian et al., Reference Tian, Maruyama and Ginzburg2017; Wieling et al., Reference Wieling, Grieve, Bouma, Fruehwald, Coleman and Liberman2016). For example, in American English, the variable use of a nasal consonant (e.g., uh vs. um) is motivated by social factors such as age and gender (Acton, Reference Acton2011; Fruehwald, Reference Fruehwald2016).
Additionally, although pauses and hesitations have been studied for individual languages (e.g., De Johnson et al., Reference De Johnson, O’Connell and Sabin1979), there is limited research on cross-language phonetic influence in bilingual FP production. Currently, data gathered from previous research that explores the acoustic properties of FPs in bilingual communities are difficult to generalize due to small sample sizes or lack of control-group comparisons (e.g., Machuca Ayuso, Reference Machuca Ayuso2018; Piccaluga et al., Reference Piccaluga, Poch-Olivé, Harmegnies, Sock, Fuchs and Laprie2008). Bedore et al. (Reference Bedore, Fiestas, Peña and Nagy2006) explore proportions of FP usage in Spanish-English bilingual children, but do not include gradient metrics (i.e., acoustic analysis was not performed). Meanwhile, Erker and Bruso (Reference Erker and Bruso2017) performed an acoustic analysis of Spanish-English bilingual speakers of various ages from the Boston Spanish Corpus. Their findings reveal that contact-induced change in bilinguals’ Spanish FPs derives from a complex array of factors, such as length of residency in the United States and the relative frequency of English use. In a comparable study, Lo (Reference Lo2019) explores distributional and acoustic data from 15 French-German simultaneous bilinguals, demonstrating that relative language dominance accounts for shifts in FP usage between individual bilingual speakers’ weak and dominant languages.
Altogether, the aforementioned body of work opens space for continued instrumental analyses of FP usage in bilingual speech, which is the aim of the current study. The following section offers a more thorough conceptualization of the nature of cross-language influences in L2 phonological acquisition.
CROSS-LANGUAGE INFLUENCES IN L2 PHONOLOGICAL ACQUISITION
In this study, we explore the extent to which there may be cross-language effects in FPs produced by Afrikaans-Spanish bilinguals. Although there are limited studies on cross-language influence in FP production, there exists a large body of research documenting cross-language effects in L2 phonological learning, broadly speaking (e.g., Chang, Reference Chang2012; Flege, Reference Flege1987; Mennen, Reference Mennen2004; Sancier & Fowler, Reference Sancier and Fowler1997). The degree and directionality of influence between an L1 and an L2 generally differ depending on speakers’ amount of L2 exposure and proficiency, as well as the usage-dominance relation between their two languages (e.g., Erker & Otheguy, Reference Erker and Otheguy2016; Fowler et al., Reference Fowler, Sramko, Ostry, Rowland and Hallé2008). For instance, in a classic study, Flege (Reference Flege1987) showed that L1-English speakers who were highly proficient in L2 French produced L1-English /t/ with voice onset time (VOT) values that differed from those of monolingual English speakers in a manner similar to monolingual French speakers, suggesting L2-to-L1 influence. At the same time, L1-English speakers with little previous exposure to L2 French produced French /t/ with values that were on par with those of English monolinguals, suggesting L1-to-L2 influence. Models of L2 learning predict that such cross-language influence occurs as a result of the coexistence of L1 and L2 sounds within a shared phonetic space (e.g., Flege, Reference Flege and Strange1995).
The present analysis investigates the phonetic aspects of FPs, namely: (a) the relative use of different FP types; (b) the spectral properties of the vocalic segments contained by FPs (i.e., first and second formant values); and (c) the durations of vocalic and consonantal segments contained by FPs. At this stage, going beyond an impressionistic description of FP usage is important to gain a more complete view of the facts for understanding L2 phonological learning.
It is also worth noting that, to date, most research investigating the L2 production of FPs focuses on the speech of university-level students (e.g., García-Amaya, Reference García-Amaya, Collentine, García, Lafford and Marcos-Marín2009; Mirdamadi & de Jong, Reference Mirdamadi and de Jong2015; Segalowitz & Freed, Reference Segalowitz and Freed2004). Clearly, college-aged L2 populations comprise a valuable subject pool, in part because of their accessibility. However, traditional undergraduate learners are not as experienced in their two languages as are the L1-Afrikaans/L2-Spanish bilinguals of the present study, who represent a case of late subtractive bilingualism. At this stage, there is a dire need to diversify the observed populations in L2 speech research by investigating uncommon language pairs, a variety of generations, and other types of bilingualism (Graham, Reference Graham2013; see also Henrich et al., Reference Henrich, Heine and Norenzayan2010). The analysis of the Afrikaans-Spanish community thus affords an opportunity to offer theoretical insights into L2 phonological acquisition through the analysis of an underexplored language pairing and speech community.
THE BILINGUAL COMMUNITY
Our study focuses on a unique Afrikaans-Spanish bilingual community in the Chubut province of Patagonia, Argentina. The community on which we report are the descendants of approximately 600 Afrikaans speakers who left what is now South Africa to escape British rule at the end of the Anglo-Boer war (1902–1906). The settlers maintained Afrikaans cultural and religious practices in a region of Patagonia that was virtually uninhabited at the time. These factors resulted in the community being functionally Afrikaans monolingual for the first several decades of its existence. It was only during the second half of the twentieth century that larger numbers of Spanish speakers moved into the region, beginning the gradual shift from Afrikaans to Spanish (van Schalkwyk, Reference van Schalkwyk1989).
The descendants of the original Afrikaans-speaking settlers are still concentrated in two localities in Patagonia, and have maintained a strong cultural Afrikaans identity. Linguistically, however, the community has largely transitioned to Spanish; currently, most speakers who use both languages are over 60 years of age. These are third-generation speakers who acquired Afrikaans as an L1 from birth and Spanish as an L2 when they began school (usually age seven or eight to late teenage years). Based on our fieldwork experience in Patagonia, we estimate the number of remaining fluent Afrikaans speakers to be no more than 40.
Given the possibilities of cross-language influence reviewed in the previous section (i.e., L1-to-L2 and/or L2-to-L1), we can hypothesize that similar patterns obtain between the L1 and L2 of the Afrikaans-Spanish bilingual community. Although the L1 of the bilinguals is Afrikaans, their L2 Spanish has been the dominant language, in terms of language use, for the majority of their adult lives.
THE CURRENT STUDY
To investigate possible cross-language influence in FP usage, we will compare the L1 and L2 of the Afrikaans-Spanish bilinguals to L1-comparison speakers of each language. We hypothesize that L1-Spanish-comparison speakers will produce FPs with a mid, front vowel, rendering eh or em ([e] or [em]) (e.g., Machuca Ayuso, Reference Machuca Ayuso2018; Villa et al., Reference Villa, Gil, Lahoz-Bengoechea, Ruiz-Miralles, Silva and Alvarado2017).Footnote 3 Regarding Afrikaans, little work has been done on FPs in this language, although as a West-Germanic language, its FPs should be similar to those produced in English (see Wieling et al., Reference Wieling, Grieve, Bouma, Fruehwald, Coleman and Liberman2016). We therefore assume that L1-Afrikaans-comparison speakers will produce FPs with a low, back vowel—uh or um (approximating [ə] or [əm]).
To explore whether there is L1-to-L2 and/or L2-to-L1 influence in the bilinguals’ FP productions, it will be necessary to document that differences exist in the speech of the two comparison groups. Having established such cross-language differences, we can subsequently examine the bilinguals in their L1 and their L2 to determine how their patterns compare relative to each comparison group, in terms of the following three outcomes: (a) the rate at which FPs are used (which can vary language-specifically); (b) the vowel quality of each FP (i.e., vowel height and backness); and (c) the duration of the individual vocalic and consonantal components, when produced, of each FP. Our study was thus guided by the following research questions (RQs):
-
1. What is the relative use of FP types produced by each group: Afrikaans comparisons, Afrikaans-Spanish bilinguals in each of their languages, and Spanish comparisons?
-
2. What are the vowel-quality properties of FPs produced by each group: Afrikaans comparisons, Afrikaans-Spanish bilinguals in each of their languages, and Spanish comparisons?
-
3. What are the duration properties of FPs produced by each group: Afrikaans comparisons, Afrikaans-Spanish bilinguals in each of their languages, and Spanish comparisons?
METHODS
PARTICIPANTS
The research team, including one native speaker of Afrikaans, one native speaker of Spanish, and one L1-English advanced L2-learner of Spanish, conducted 49 sociolinguistic interviews with 35 speakers: 14 Afrikaans-Spanish bilinguals from Patagonia, Argentina (9 female, 5 male); 10 Spanish speakers from Patagonia, Argentina (5 female, 5 male); and 11 Afrikaans speakers from Potchefstroom, South Africa (4 female, 7 male). The Afrikaans-Spanish bilinguals were interviewed twice, once in Afrikaans and once in Spanish, and all comparison speakers were recorded once in their respective native language, resulting in a total of four interview groups. The Patagonian participants (i.e., Afrikaans-Spanish bilinguals and Spanish-comparison speakers) were recruited through social networks established prior to the team’s arrival in Patagonia. The South African participants were recruited through social networks in Potchefstroom, South Africa.
The mean age of the resulting bilingual group was 71.4 (range = 55–82, SD = 7.7), the Spanish-comparison group was 51.8 (range = 38–64, SD = 8.4), and the Afrikaans-comparison group was 71.5 (range = 65–81, SD = 7.1). Although there is no evidence of which we are aware to suggest generational differences in the production of Patagonian-Spanish FPs, previous research demonstrates that cognitive changes in aging may affect speech production (e.g., Bortfeld et al., Reference Bortfeld, Leon, Bloom, Schober and Brennan2001; Horton et al., Reference Horton, Spieler and Shriberg2010). We therefore included speaker age as a control variable in the first iteration of the model fitting in the statistical analysis (see "Statistical Analysis").
The Afrikaans-comparison speakers were in fact bilinguals with English as an L2 (as is true of almost all Afrikaans speakers in South Africa). Given that Afrikaans and English have similar FP vocalic patterns (i.e., low-central vowel), we do not anticipate interference from English onto the Afrikaans of these speakers (although this is an empirical question warranting study through future research). Additionally, although these speakers are Afrikaans-English bilinguals, they are Afrikaans-dominant and live in an area of South Africa where English has very limited social reach.
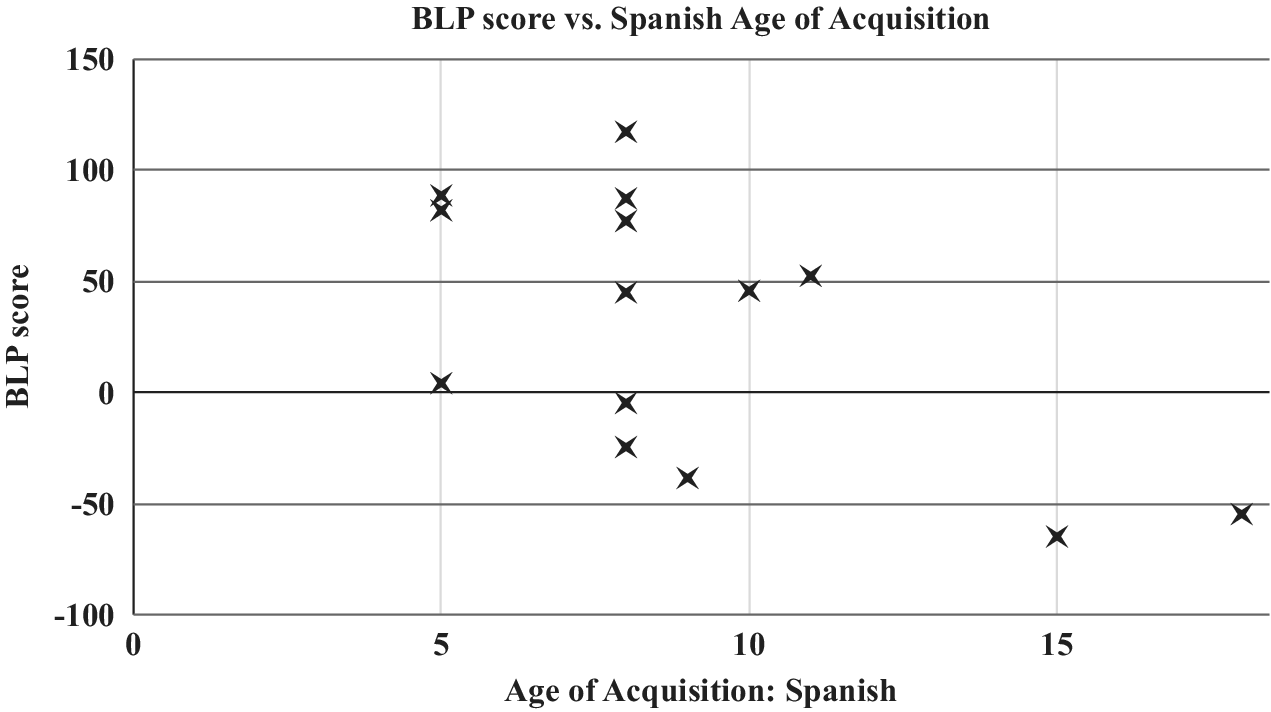
All Afrikaans-Spanish bilinguals completed the Bilingual Language Profile (BLP; Birdsong et al., Reference Birdsong, Gertken and Amengual2012), a questionnaire in which bilingual speakers rate themselves in areas related to language use, identity, proficiency, and attitudes. Scores for our BLP range from −180 (Afrikaans-dominant) to +180 (Spanish-dominant). All bilinguals, except for one, received scores between −90 and +90, which can be interpreted as representing roughly balanced bilingualism. As Figure 1 shows, speakers who displayed the lowest BLP scores generally had a higher Spanish age of acquisition. For the purposes of our analyses, each of the 35 speakers was assigned a SPEAKER_CODE, which indicates their gender (M = male, F = female) followed by a unique digit.
Demographic information for the 14 Afrikaans-Spanish bilinguals. “M” and “F” in speaker codes indicate speaker gender. Individual scores on the BLP can range from −180 (Afrikaans-dominant) to +180 (Spanish-dominant).

Given our prior knowledge of the Patagonian bilingual community (which we estimated to be between 30 and 40 speakers), we aimed to gather speech data from as many bilinguals as possible. Due to limitations in accessibility during our fieldwork experience, we were able to conduct interviews with 14 bilinguals. Regarding the target-language comparisons, the time limits of our fieldwork trips to Argentina and South Africa allowed us to meet with 10 and 11 speakers, respectively. Given these logistics, we did not perform a power analysis.Footnote 4
DATA COLLECTION
The spontaneous interviews with the Patagonia-based speakers were conducted in their homes in Comodoro Rivadavia or Sarmiento, Argentina. All speakers were recorded under similar conditions, and they were not aware of the purpose of the recording in terms of analyzing FPs. Interview questions targeted the topics of language, history, and culture in the Patagonian community. Interviews with the Afrikaans comparison group were conducted in Potchefstroom, South Africa by a native speaker of Afrikaans. All audio from interviews was transcribed by native speakers of each language. The initial transcribers provided orthographic transcription of continuous speech and discourse, but not of FPs.
Most interviews lasted between 30 and 45 minutes; the average duration was 42.81 minutes. For the analysis presented in this article, we selected 30 minutes as the upper threshold to include a balanced amount of data from each speaker.
DATA ANALYSIS
Filled-Pause Labeling
Once the initial orthographic transcriptions were completed, two coders identified all FPs through reading the transcriptions while inspecting the corresponding spectrograms (each coder labeled half of the Spanish data and half of the Afrikaans data). Regarding inclusion criteria, an FP had to present itself as an audible interruption to fluent discourse. Regarding exclusion criteria, we avoided false positives by disregarding instances of failed production of grammatical speech and instances when slurred speech resulted in a relaxation of vowel sounds mid-utterance. Additionally, the coders labeled each FP based on its segmental composition. FPs present as monosyllabic, and can consist of a vowel alone (V-only), a nasal consonant alone (N-only), or a vowel followed by a nasal consonant (V + N).
Because two coders worked to classify the FPs, it was necessary to measure and ensure cross-rater reliability. To determine the degree of agreement, the two coders first labeled a random selection of approximately 10% of the full interview corpus (150 minutes of the 1,463 minutes total). The interrater agreement was 82.1% based on this initial coding. There were 12 FPs on which the two raters did not initially agree—the raters worked together to establish a mutually agreed-upon set of labeling criteria for the remaining corpus. Following this, each coder proceeded with the labeling of their assigned interviews.Footnote 5 In total, we submitted 3,143 FPs for acoustic and statistical analysis.
Acoustic Analysis
All FPs were submitted to acoustic analysis in Praat (Boersma & Weenink, Reference Boersma and Weenink2018). As mentioned in the previous section, the coders labeled each FP as V-only, N-only, or V + N. The acoustic separation between the vocalic and consonantal elements of the FPs, and of the surrounding discourse, relied on simultaneous inspection of waveforms and wide-band spectrograms following standard segmentation criteria (see Peterson & Lehiste, Reference Peterson and Lehiste1960).
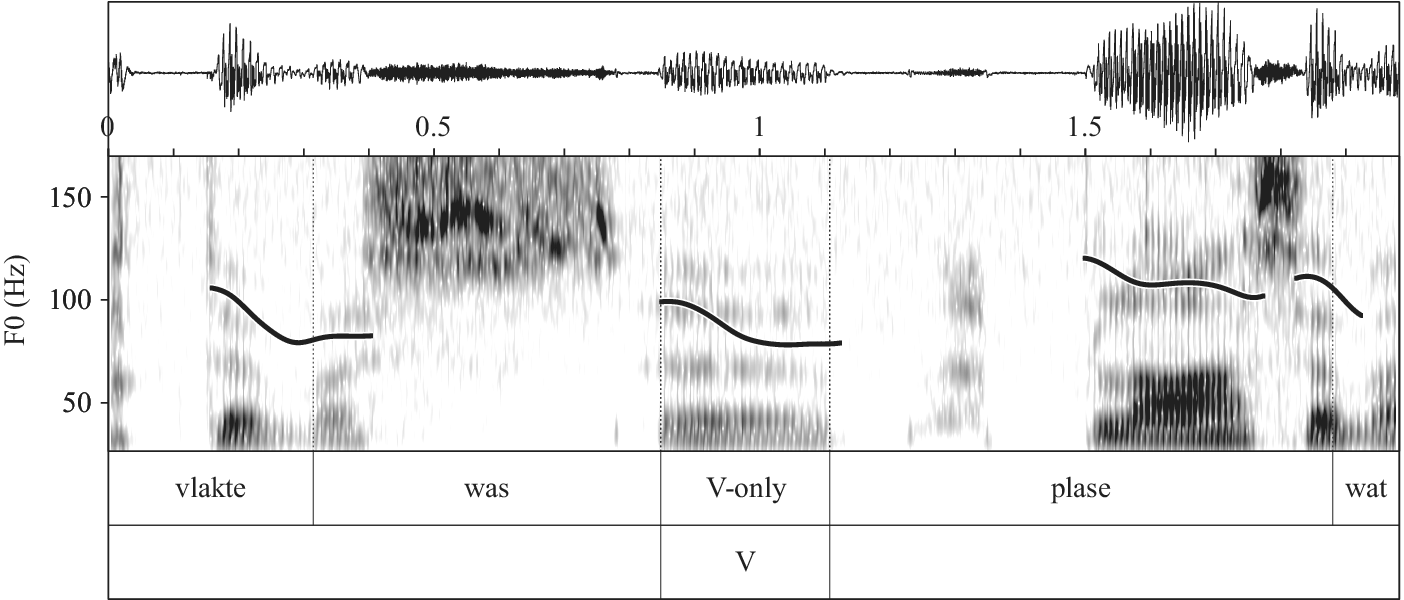
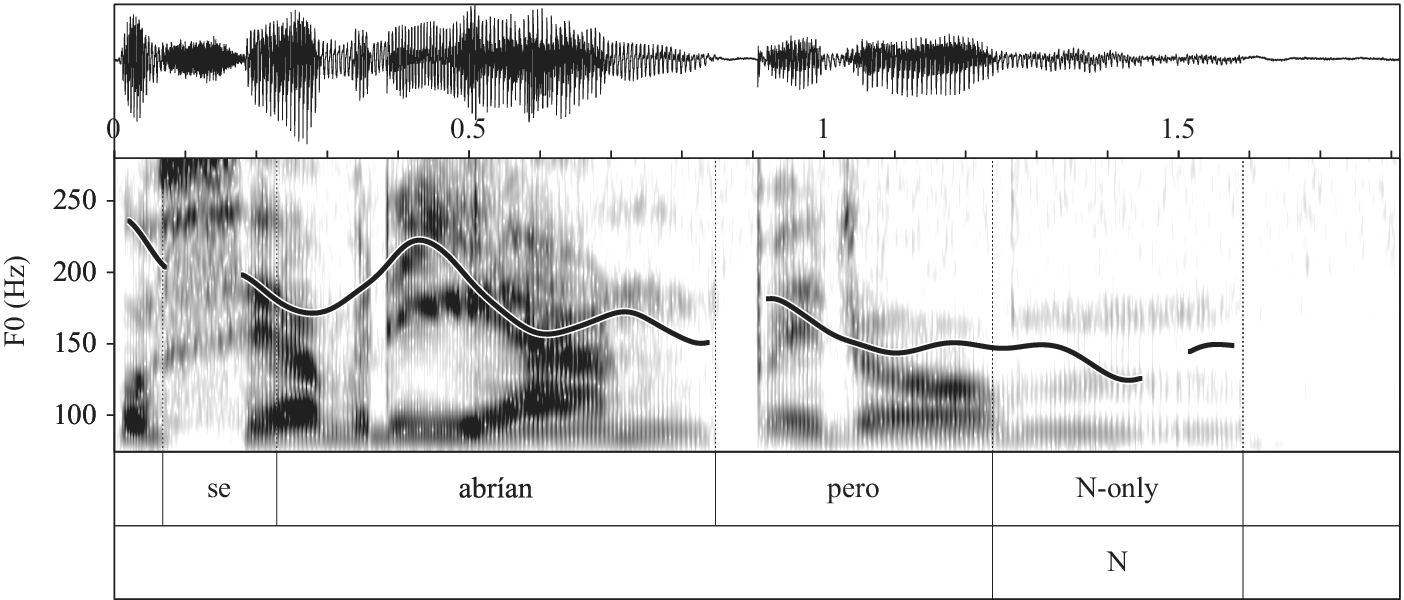
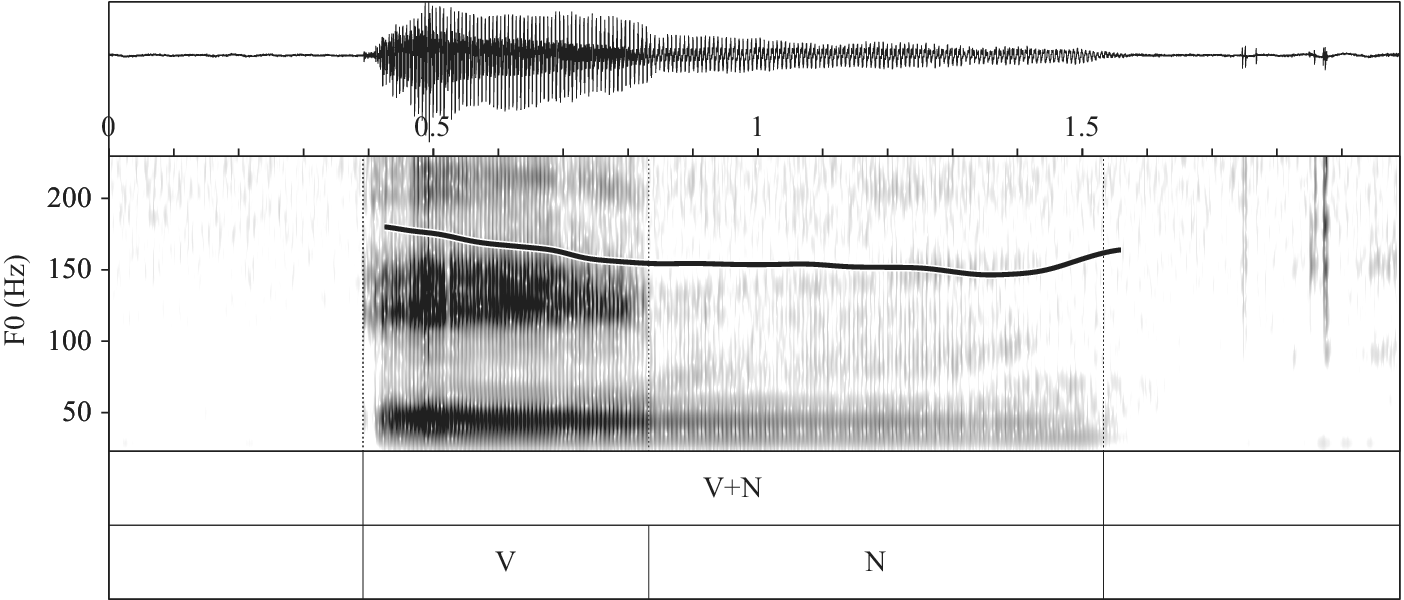
Figures 2, 3, and 4 illustrate the labeling protocol. Figure 2 shows a V-only FP produced by an Afrikaans-comparison speaker. Figure 3 shows an N-only FP produced by a Spanish-bilingual speaker. Figure 4 shows a V + N FP produced by a Spanish-comparison speaker.
Waveform, spectrogram, and illustration of segmentation criteria for a V-only FP in the phrase ‘n Groot deel van daai vlakte was [FP] plase wat hy aangeskaf het “A large part of that plain was [FP] farms that he had purchased,” produced by a male Afrikaans-comparison speaker.

Waveform, spectrogram, and illustration of segmentation criteria for an N-only FP in the phrase Se abrían pero [FP] “They would open up, but [FP],” produced by a female Spanish-bilingual speaker.

Waveform, spectrogram, and illustration of segmentation criteria for a V + N FP at the end of the carrier phrase Fuimos creciendo, salimos [FP] del campo “We were growing up, we left [FP] the countryside,” produced by a female Spanish-comparison speaker.

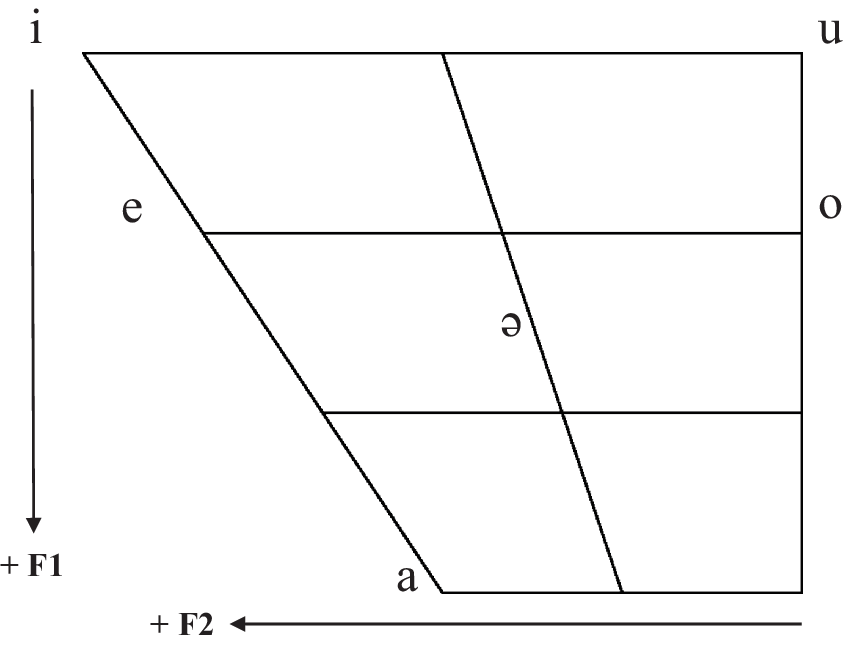
For each FP containing a vocalic segment (i.e., V-only and V + N), we extracted first (F1) and second (F2) formant values through a Praat script, at the 25%, 50%, and 75% points. Higher F1 values imply lower vowels, and higher F2 values imply more front vowels (see Figure 5). We subsequently averaged the three F1 and three F2 values, respectively, and the new mean values were submitted to normalization and statistical analysis. A research assistant examined all of the sound files and corresponding TextGrids to verify that the formant values did not represent spurious extractions. We excluded the formant values for three FPs for which Praat was unable to extract reliable data. We used a second script to extract the durations of vocalic segments (V_DUR) and of nasal-consonantal segments (N_DUR) of all FPs.
Vowel chart indicating relative F1 and F2 values. Higher F1 values indicate lower vowels; higher F2 values indicate more front vowels.

Vowel Normalization
To control for potential formant-frequency differences between languages and genders, we conducted a by-subject normalization procedure for all F1 and F2 values. We used the Lobanov method (Lobanov, Reference Lobanov1971; see also Adank et al., Reference Adank, Smits and Van Hout2004), a speaker-intrinsic normalization procedure that adjusts F1 and F2 by taking into account an individual speaker’s vowel space, as determined by the formants of their point vowels (/i a u/). The Lobanov method uses the following formula:
 $$ \mathrm{F}\left[\operatorname{norm}\right]=\left(\mathrm{F}\left[\mathrm{Hz}\right]\ \hbox{--}\ \mathrm{M}\left[\mathrm{Hz}\right]\right)/\mathrm{SD}\left[\mathrm{Hz}\right] $$
wherein F[norm] is the normalized formant value, F[Hz] is the unadjusted formant value (in Hertz), M[Hz] is the formant-specific mean of all vowels for the speaker, and SD[Hz] is the formant-specific standard deviation of all vowels for that same speaker. We normalized the F1 (F1_NORM) and F2 (F2_NORM) of each FP. Formants were extracted for 10 tokens of each point vowel of each speaker.
STATISTICAL ANALYSIS
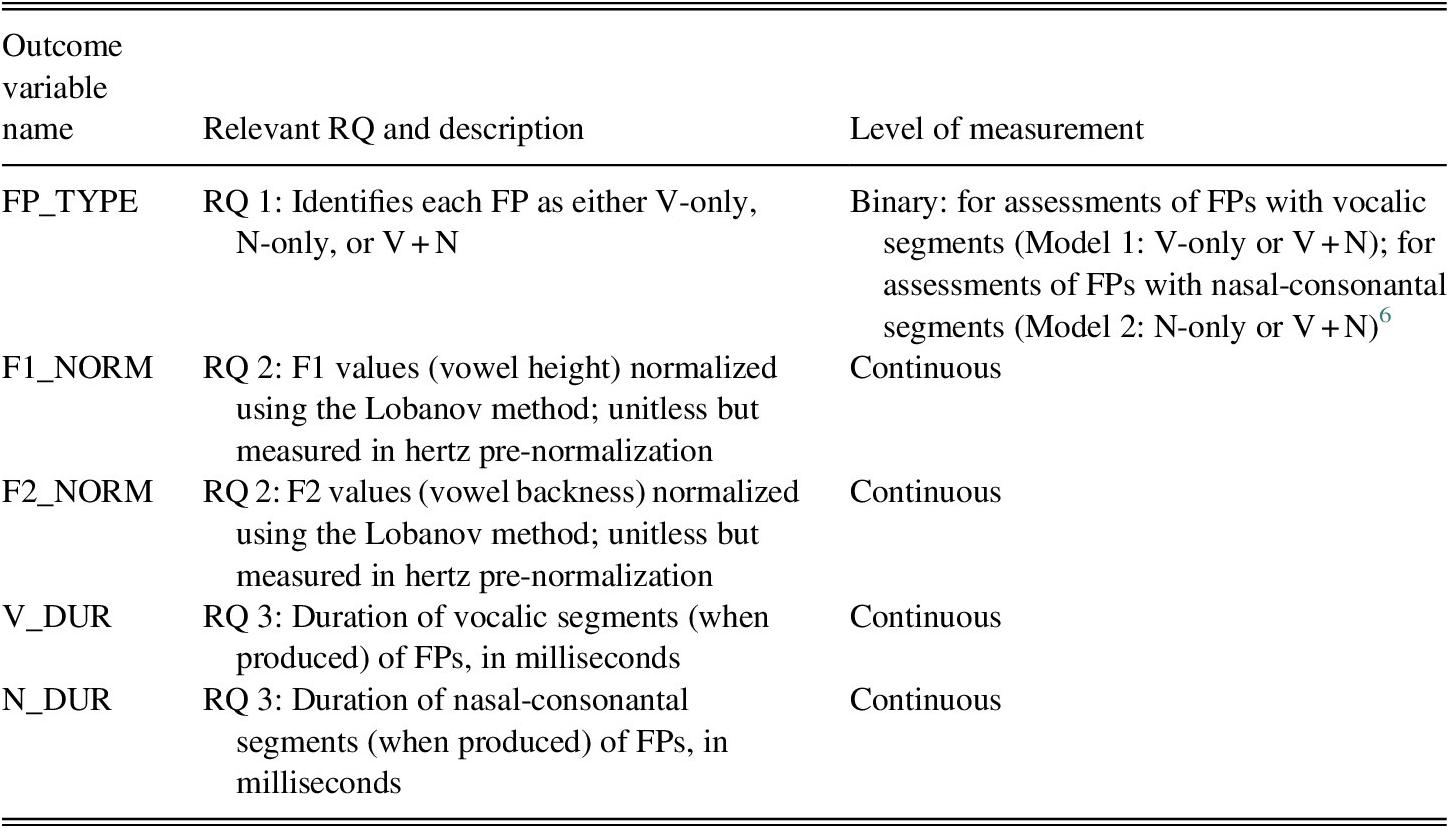
Table 1 offers a brief summary of each outcome variable and the corresponding Research Question (RQ).
Short description of each outcome variable

For the categorical outcome FP_TYPE, we performed two mixed-effects logistic-regression analyses. The first was of vowel-containing FPs (i.e., V-only and V + N), while the second was of nasal-containing FPs (i.e., N-only and V + N), using the glmer() function in the lme4 package (Bates et al., Reference Bates, Maechler, Bolker and Walker2015) for R (R Core Team, 2015). In both models, we included GROUP as the single fixed effect, and SPEAKER_CODE as the random intercept. Regarding the predictor GROUP, there were four levels given the four interview groups: Afrikaans comparison; Afrikaans bilingual; Spanish bilingual; and Spanish comparison. For all statistical tests, we set the significance level to 0.05 (α = 0.05). We calculated standard effect sizes (Cohen’s d) independently from the mixed-effects models, using pooled standard deviations, following Olson (Reference Olson2019).
For the four continuous outcomes (F1_NORM, F2_NORM, V_DUR, and N_DUR), we used the same software and packages as mentioned previously, as well as the lmerTest package (Kuznetsova et al., Reference Kuznetsova, Brockhoff and Christensen2014) to perform linear mixed-effects model analyses (LMEMs). The main effects of GROUP and FP_TYPE, as well as their interaction, were included as fixed effects, with SPEAKER_CODE as a random intercept. Regarding the predictor FP_TYPE, it was set as a binary variable with two levels (V-only or V + N) for the outcomes F1_NORM, F2_NORM, and V_DUR. For the outcome N_DUR, the two levels of FP_TYPE were N-only and V + N.
Our models were fitted using a “top-down” strategy: whenever the interaction between GROUP and an FP_TYPE was not found to be significant based on the Type III F tests, this term was removed and the model was refitted with single fixed factors only. Model diagnostics were based on plots of distributions of residuals, Q-Q plots, plots of residuals versus fitted values, and checks for outlier values with high leverage. The duration variables V_DUR and N_DUR were log-transformed to fit the linear regression model assumptions.
When analyzing comparisons involving GROUP, we performed three levels of planned comparisons. First, we compared the Afrikaans-comparison group to the bilinguals in Afrikaans to assess whether the bilinguals’ FP productions show more features of Afrikaans in their L1; analogously, we compared the Spanish-comparison group to the bilinguals in Spanish to determine whether the bilinguals show Spanish characteristics in their L2. The third comparison involved the bilinguals in Afrikaans and in Spanish, to assess whether these speakers produce FPs as separate categories in their L1 and their L2 (e.g., uh in Afrikaans, but eh in Spanish), or as a single, merged category in both languages.
We also considered two continuous control variables in the statistical models. First, we included age of all speakers (henceforth, AGE). We found a significant effect for AGE in the two logistic-regression models, but not in the models for continuous outcomes. We thus included AGE as a control in the former, but not the latter, set of models reported here. Second, to account for possible effects of slower or faster talkers on the vowel- and nasal-duration values, we included speech rate as a control variable in the models fitted for V_DUR and N_DUR. We generated a speech-rate value for each interview using the script provided in de Jong and Wempe (Reference de Jong and Wempe2009), which detects syllable nuclei to measure speech rate without the need for a transcription. For the bilinguals, we generated two speech-rate scores, one for each language.
RESULTS
In section "Usage of Filled Pauses" we report on findings regarding the categorical outcome FP_TYPE; in sections "Vowel Quality" and "Duration" we report the results for the four continuous outcomes (F1_NORM, F2_NORM, V_DUR, and N_DUR). For each dependent variable, we include statistical outcomes based on planned between-group comparisons: Afrikaans-comparison group versus Afrikaans bilinguals; Afrikaans bilinguals versus Spanish bilinguals; and Spanish bilinguals versus Spanish-comparison group.
The Afrikaans-speaking groups produced two FP types: V-only and V + N. The Spanish-speaking groups produced three FP types: V-only, V + N, and N-only. The results for all outcome variables are reported with this consideration in mind.
USAGE OF FILLED PAUSES
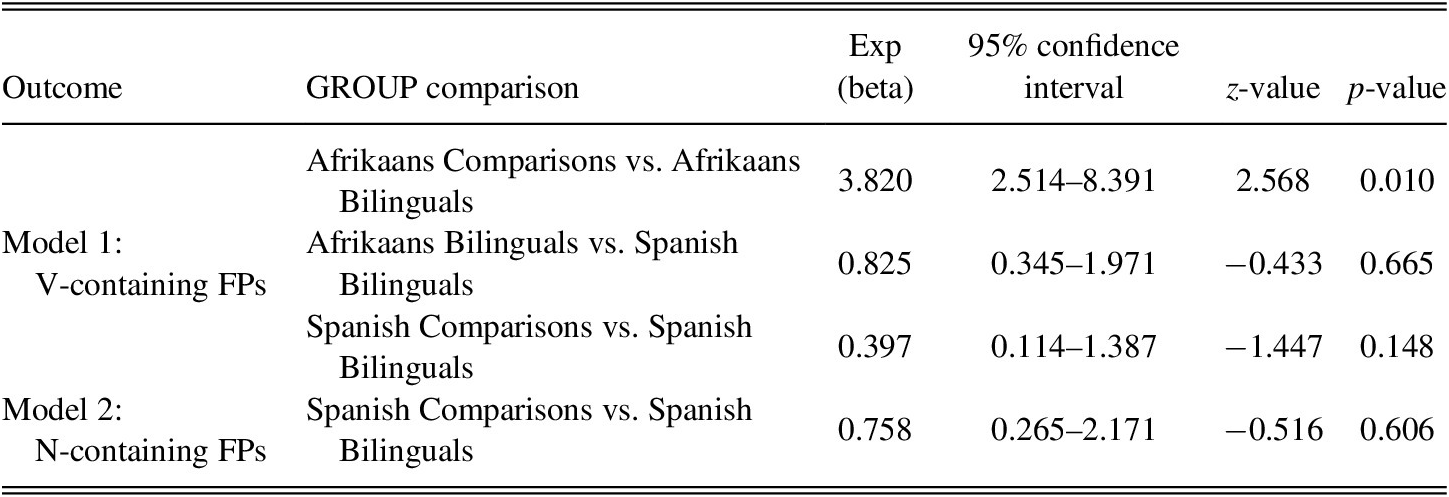
To analyze the frequency of FP usage, we fit two binary logistic-regression models to the categorical outcomes, shown in Table 2. Model 1 was fit on V-containing FPs (i.e., V-only and V + N) and Model 2 on N-containing FPs (i.e., N-only and V + N). In Table 2, the first column specifies the used model, followed by the targeted GROUP comparisons, the exponentially transformed beta coefficients, 95% confidence intervals, z-values, and p-values.
Statistical outcomes from binary-logistic regression analyses on FP usage

In Model 1, the z-tests returned a significant difference between the Afrikaans comparisons and the Afrikaans bilinguals, but not between the Afrikaans bilinguals and the Spanish bilinguals, or between the Spanish bilinguals and the Spanish comparisons. This suggests that the bilingual speakers use V-containing FPs in both their L1 (Afrikaans) and L2 (Spanish) in a manner close to that of the Spanish comparisons. In Model 2, the z-test did not return a significant difference between the two Spanish-speaking groups, suggesting that the bilinguals use N-containing FPs in a manner similar to the Spanish comparisons.
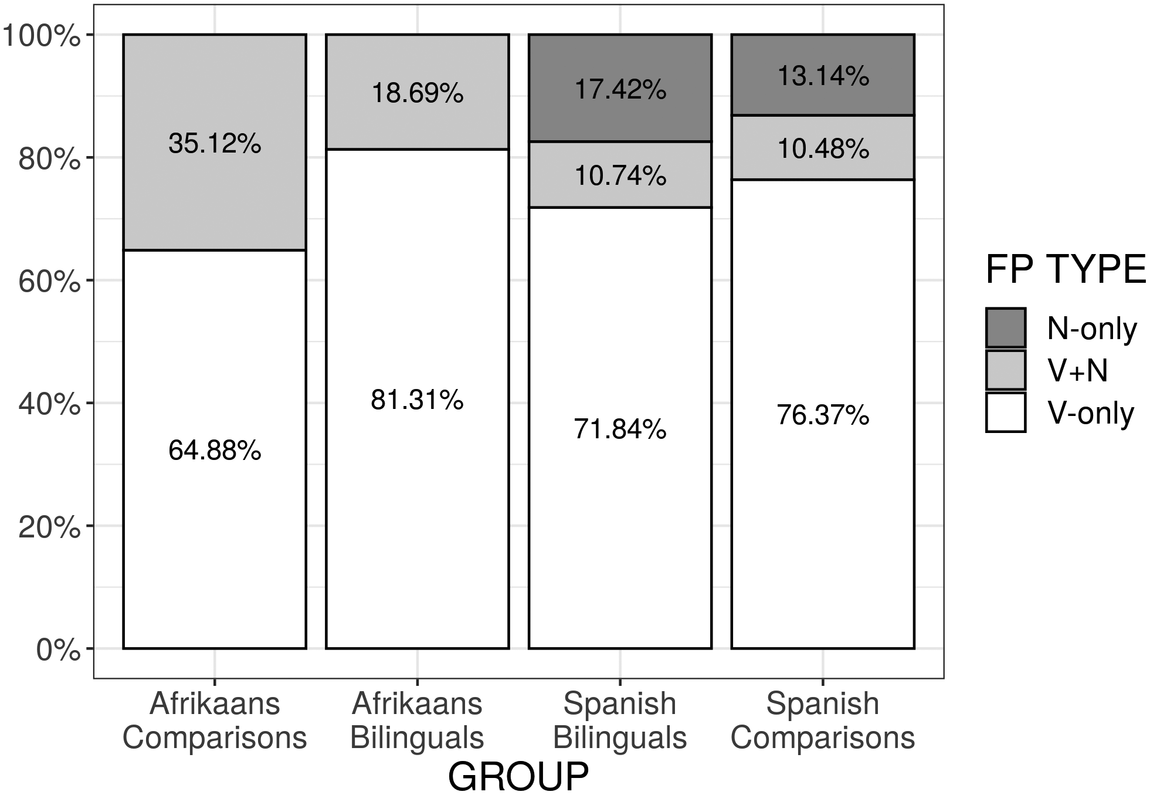
Figure 6 illustrates the relative use of each FP type for the four interview groups. The bilinguals’ FP inventories resemble those of their respective comparison groups in each language: the bilinguals produce two FP types in Afrikaans, but three FP types in Spanish. However, differences emerge regarding the bilinguals’ relative use of the different FP categories, with the bilinguals producing more V-only FPs in Afrikaans than the respective comparisons, but fewer V-only FPs in Spanish (see Appendix A for full descriptive data).
Proportions of FP_TYPEs produced by each GROUP. The three categories of FP_TYPE are: N-only (nasal-consonant only); V + N (vowel followed by a nasal consonant); and V-only (vowel-only).

To summarize the results from the categorical coding, the bilinguals were analogous to each comparison group regarding the FP inventories in each of their languages: they produced only two FP types in Afrikaans (V-only and V + N FP), but all three types in Spanish (V-only, V + N, and N-only). Regarding the relative frequency of FP usage, the bilinguals approximate more closely the Spanish-comparison group than the Afrikaans-comparison group in that: (a) there were no significant differences between the bilinguals in Afrikaans, the bilinguals in Spanish, and the Spanish comparisons in terms of V-containing FPs; and (b) there was no significant difference between the bilinguals in Spanish and the Spanish comparisons in terms of N-containing FPs.
VOWEL QUALITY
In addition to examining the counts and relative frequencies of the FP_TYPEs between GROUPs, we assessed the normalized formant structures using F1_NORM and F2_NORM.
Vowel Height (F1)
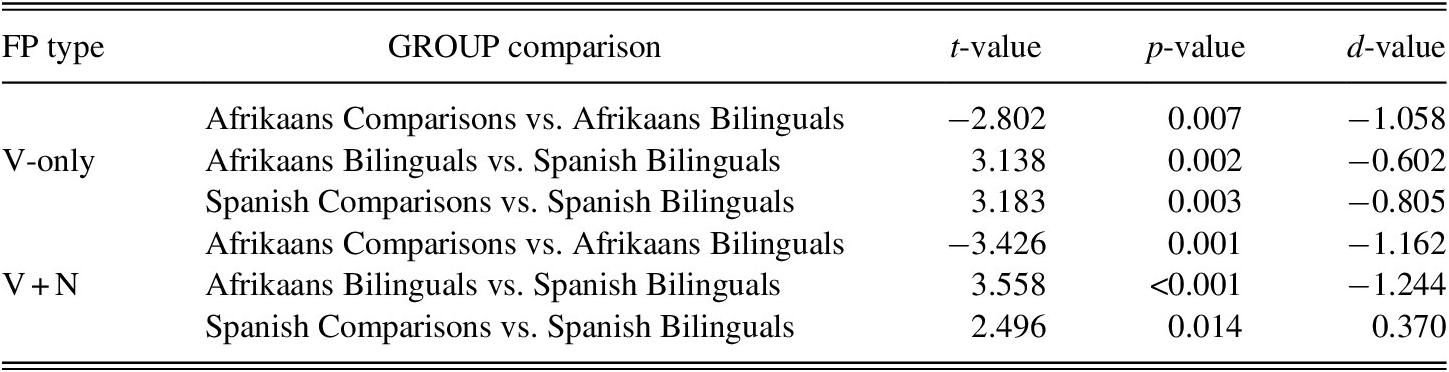
For F1_NORM, the Type III F-test did not return a significant effect of the interaction between GROUP and FP_TYPE. We thus excluded this interaction and refit the model with the main-effect predictors only. The updated model returned significant effects of GROUP (F(3, 45.21) = 4.620, p = 0.032) and FP_TYPE (F(1, 2,965.96) = 33.351, p < 0.001). Table 3 shows the pairwise-comparison results derived from the updated model. The t-tests in the model returned significant differences of the normalized F1 values for all targeted comparisons: between Afrikaans comparisons and Afrikaans bilinguals; between Afrikaans bilinguals and Spanish bilinguals; and between Spanish bilinguals and Spanish comparisons.
Statistical outcomes from pairwise comparisons for model fit for F1_NORM

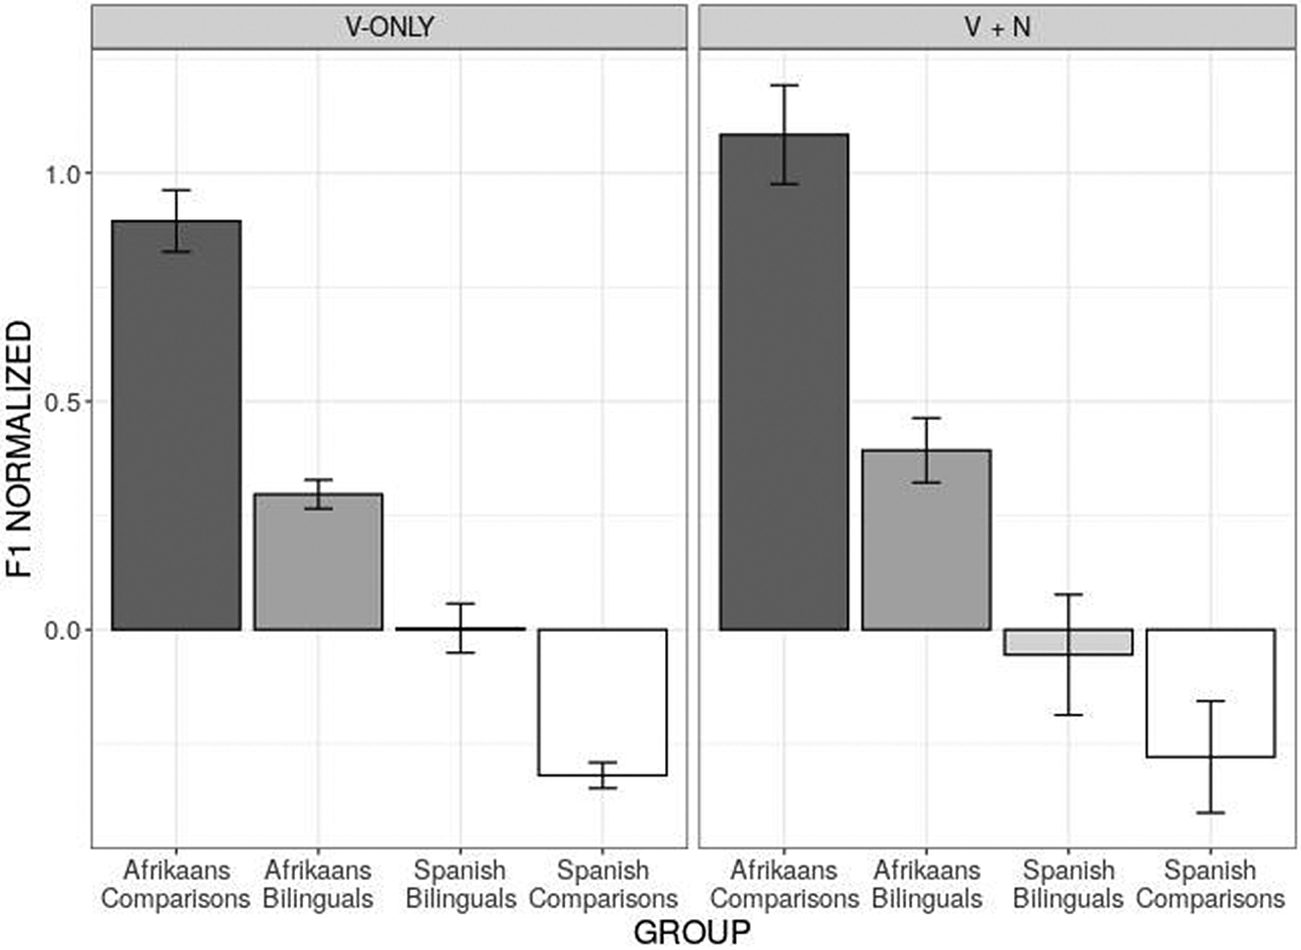
The F1_NORM data are plotted in Figure 7, separated according to FP_TYPE and GROUP (see Appendices B and C for further descriptive data). The left-hand panel plots V-only FPs (e.g., eh, uh), and the right-hand panel plots V + N FPs (e.g., em, um).
Bar charts of mean F1_NORM by GROUP and FP_TYPE. Left panel shows mean F1_NORM for V-only FPs; right panel shows mean F1_NORM for V + N FPs. Higher F1 values indicate vocalic segments produced with lower articulations. Error bars indicate 95% confidence intervals.

The outcomes for F1 indicate that, as expected, the Afrikaans-comparison group produces FPs with a higher mean F1 (i.e., lower articulation), and that the Spanish-comparison group does so with a lower mean F1 (i.e., higher articulation). Regarding the bilinguals, these speakers display intermediate, but separate, values in each of their L1 and their L2: they exhibit lower F1 values in Afrikaans than the Afrikaans comparisons, higher F1 values in Spanish than the Spanish comparisons, and separate distributions in each of their two languages.
Vowel Backness (F2)
For F2_NORM, the Type III F-test returned a significant effect of the interaction between GROUP and FP_TYPE, F(3, 2,956.8) = 4.451, p = 0.003. As such, we report between-group differences within each FP_TYPE. The t-tests from the model (Table 4) returned significant differences for the targeted comparisons within each FP type.
Statistical outcomes from pairwise comparisons for model fit for F2_NORM

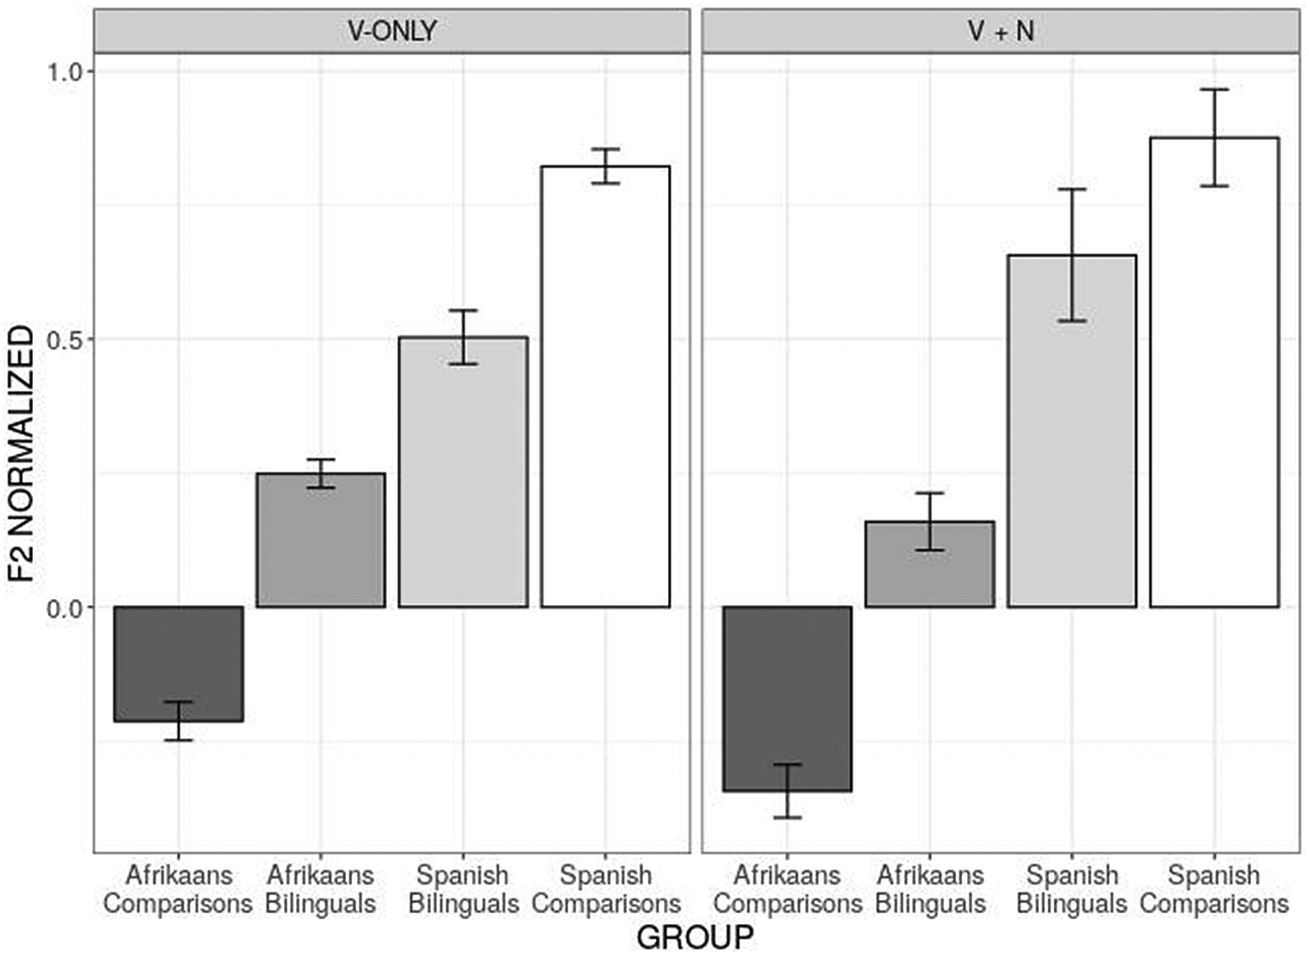
The F2_NORM data are plotted in Figure 8, separated according to FP_TYPE and GROUP (for descriptive data, see Appendices D and E).
Bar charts of mean F2_NORM by GROUP and FP_TYPE. Left panel shows mean F2_NORM for V-only FPs; right panel shows mean F2_NORM for V + N FPs. Higher F2 values indicate vocalic segments produced with more front articulations. Error bars indicate 95% confidence intervals.

The comparison groups display expected patterns (lower F2 values for Afrikaans and higher F2 values for Spanish). Regarding the bilinguals, these speakers display intermediate, but separate, values in each of their L1 and their L2: they exhibit higher F2 values in Afrikaans than the Afrikaans-comparison group, lower F1 values in Spanish than the Spanish-comparison group, and separate distributions in each of their two languages.
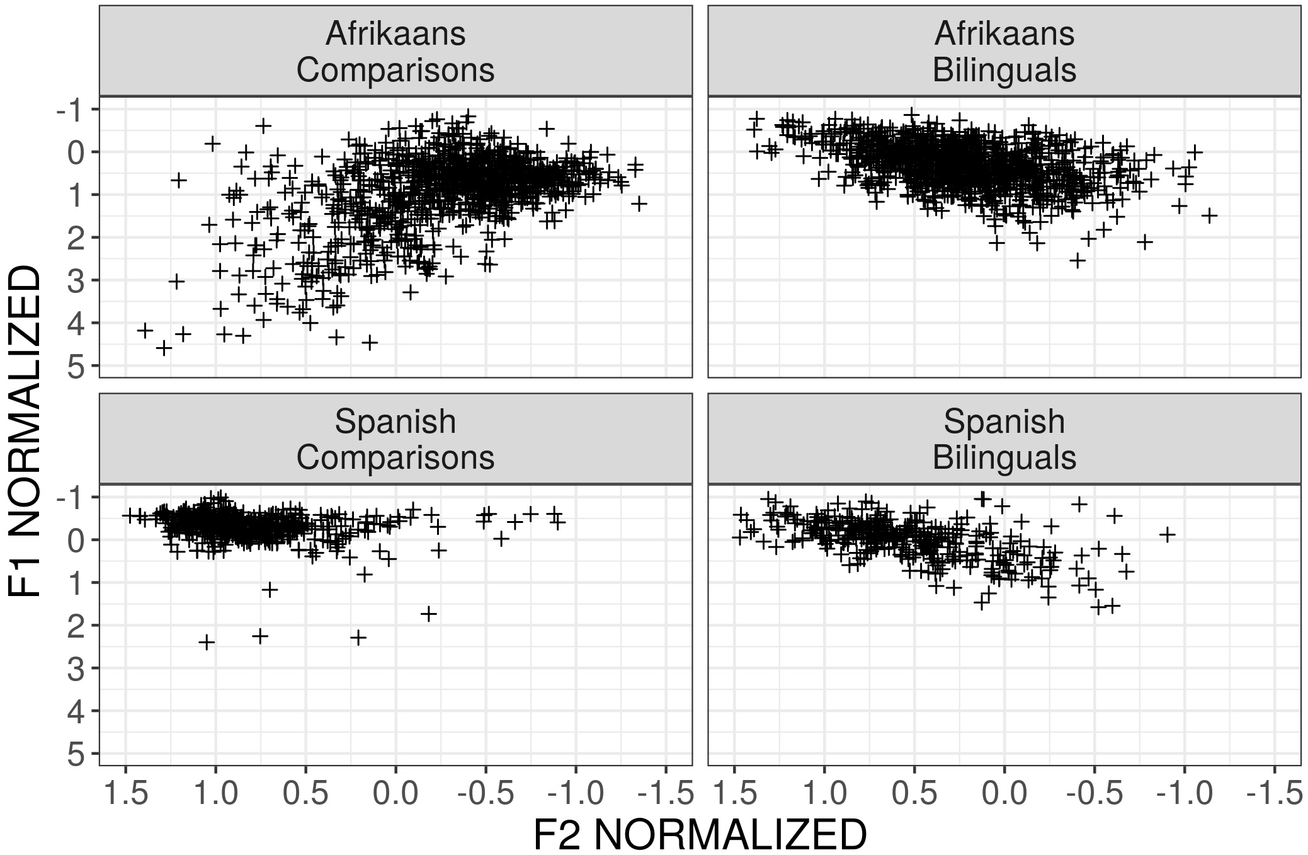
By way of summary for the vowel-quality data, Figure 9 illustrates the trends for F1 and F2 at the token and group levels. The individual points in Figure 9 represent each vowel-containing FP analyzed in the data corpus.
F1_NORM and F2_NORM by GROUP for all vowel-containing tokens.

DURATION
We also extracted data for the durations of the vocalic elements of V-containing FPs (“Vowel Duration”) and the consonantal elements of N-containing FPs (“Nasal-Consonant Duration”).
Vowel Duration
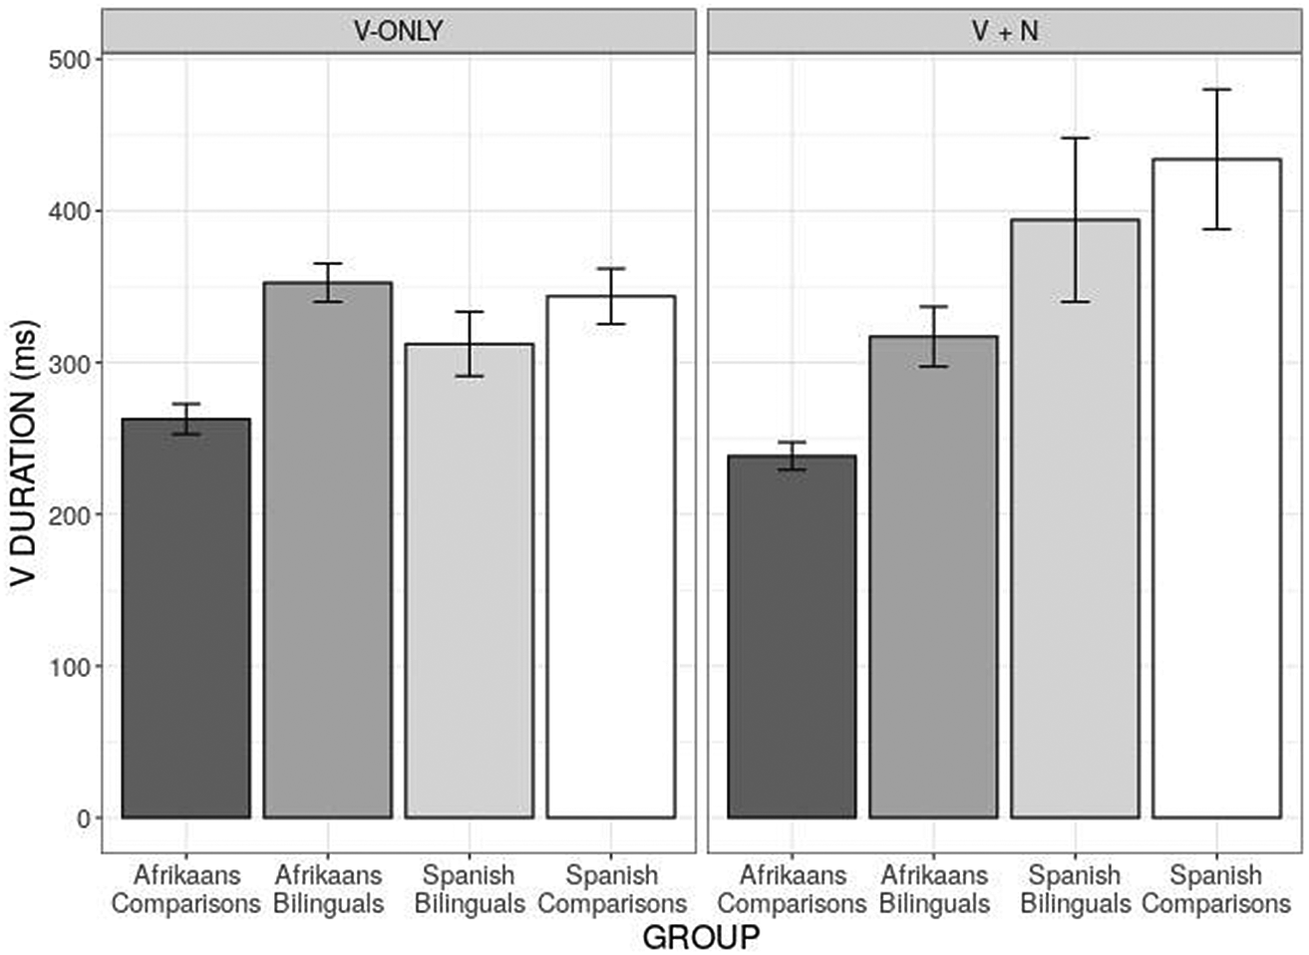
For vowel duration, the Type III F-test returned a significant effect of the interaction between GROUP and FP_TYPE (F(3, 2,919.03) = 6.72, p < 0.001). The t-tests of the model (Table 5) returned a significant difference between the mean durations of V-only FPs when comparing the Afrikaans comparisons to the Afrikaans bilinguals, but not the Afrikaans bilinguals to the Spanish bilinguals, or the Spanish bilinguals to the Spanish comparisons. The t-tests did not return a significant difference for any between-group comparisons involving the V + N FPs, thus they are not reported in Table 5.Footnote 7
Statistical outcomes from pairwise comparisons for model fit for V_DUR for V-only FPs

The vowel-duration data are plotted in Figure 10, separated according to FP_TYPE and GROUP (for descriptive data, see Appendices F and G). Regarding the Afrikaans- and Spanish-comparison groups, vowels produced in Afrikaans FPs are generally shorter than vowels produced in Spanish FPs. Regarding the bilinguals, the vowels from their Afrikaans FPs are longer overall than those of the Afrikaans comparisons, and the vowels from their Spanish FPs are shorter overall than those of the Spanish comparisons. Importantly, we did not uncover statistical evidence for distinct distributions between the bilinguals’ L1 and L2.
Bar charts of mean V_DUR by GROUP and FP_TYPE. Left panel shows mean V_DUR for V-only FPs; right panel shows mean V_DUR for V + N FPs. Error bars indicate 95% confidence intervals.

Nasal-Consonant Duration
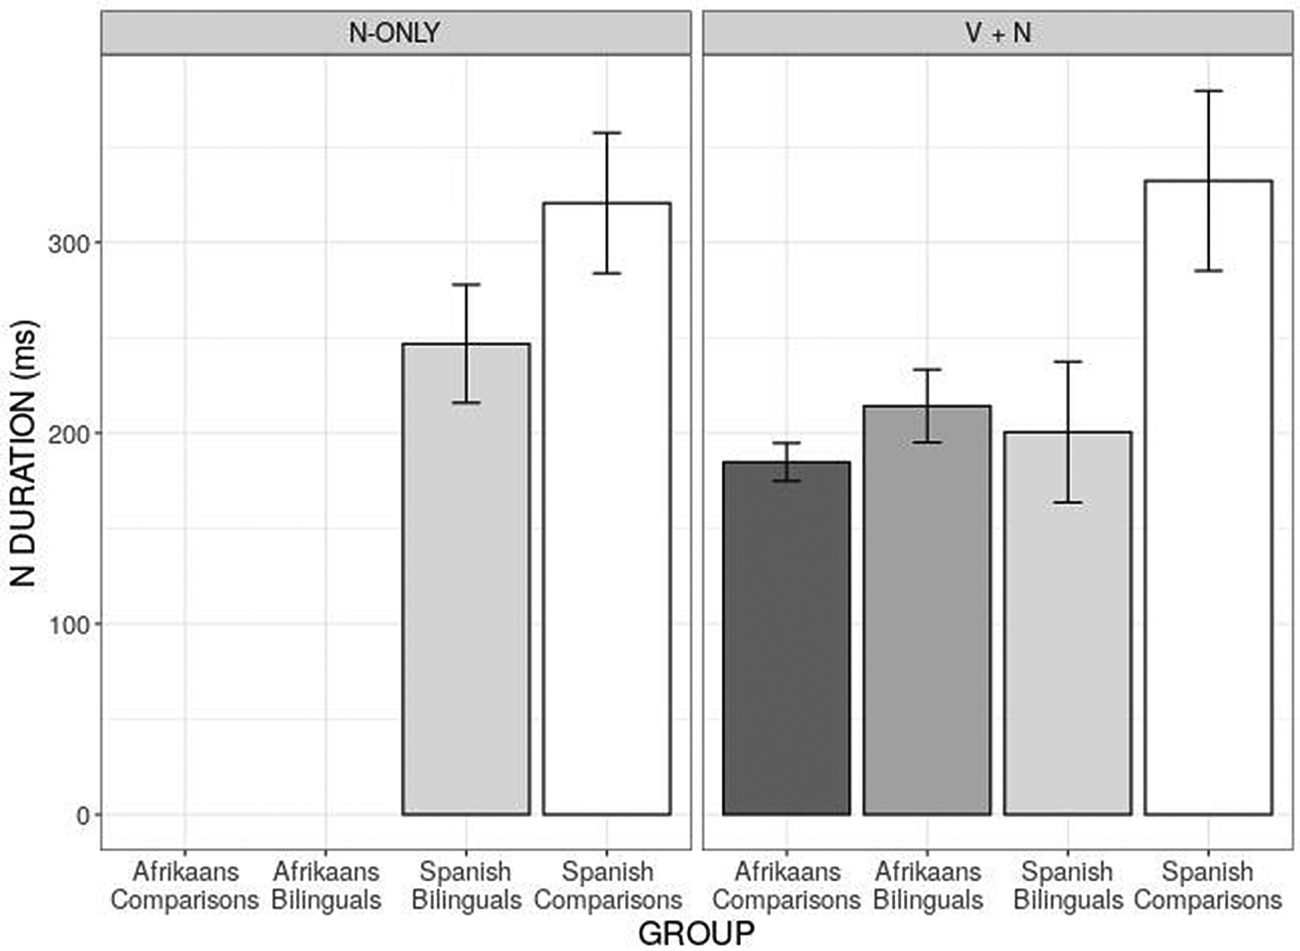
For nasal-consonant duration, the Type III F-test did not return a significant effect of the interaction between GROUP and FP_TYPE; we thus excluded this interaction and refit the model with the main-effect predictors only. The updated model returned a significant effect of GROUP (F(3, 36.60) = 5.420, p = 0.003), but not of FP_TYPE (F(1, 781.51) = 3.573, p = 0.059). The t-tests of the model returned a significant difference when comparing the Spanish bilinguals to the Spanish comparisons (t = 3.343, p = 0.002, d = −0.665); none of the other planned between-group comparisons returned significant differences.
The nasal-consonant duration data are plotted in Figure 11 (for full descriptive data, see Appendices H and I). The speech of the Afrikaans-speaking groups included in this study did not contain N-only FPs; thus, there are no values for the two Afrikaans-speaking groups on the left-hand panel of the figure. The bilinguals show similar values to the Afrikaans comparisons in V + N FPs, but lower overall durations in Spanish when compared to the Spanish-comparison group. Altogether, these findings suggest that the Spanish-comparison group produces the longest nasal consonants, with the bilinguals producing shorter nasal consonants, closer to the Afrikaans comparisons, in both their L1 and L2.
Bar charts of mean N_DUR by GROUP and FP_TYPE. Left panel shows mean N_DUR for N-only FPs; right panel shows mean N_DUR for V + N FPs. Error bars indicate 95% confidence intervals.

SUMMARY
To summarize the results, we have shown that: the bilinguals display the same FP inventories as the Afrikaans- and Spanish-comparison speakers in each respective language, although there are differences regarding the frequency of use of each FP type (“Usage of Filled Pauses”); for measures of vowel quality, the bilinguals display intermediate but separate values in their L1 and L2 (“Vowel Quality”); and for measures of FP duration, the Afrikaans comparisons produce the shortest FPs, the Spanish comparisons produce the longest FPs, with the bilinguals generally displaying vowel durations similar to the Spanish comparisons and consonant durations similar to the Afrikaans comparisons (“Duration”).
DISCUSSION
ANSWERING THE RESEARCH QUESTIONS
The first research question asked whether the relative use of FP types differed among the four interview groups: Afrikaans comparisons, bilinguals in Afrikaans, bilinguals in Spanish, and Spanish comparisons. We found that, first, the bilingual FP inventories resembled those of the respective comparison groups: two FP types in Afrikaans (V-only and V + N), and three types in Spanish (V-only, V + N, N-only). Second, regarding the relative use of the FP types, the Afrikaans-comparison group produced V-only FPs with a significantly lower frequency than the three other interview groups, indicating that the bilinguals’ FP usage is closer to the Spanish comparisons on this dimension. Third, regarding N-only FPs (exclusive to Spanish), there was not a significant difference between the two Spanish-speaking groups, indicating that the bilinguals, once again, display patterns like those of the Spanish comparisons. The findings based on RQ 1 support previous research showing that dimensions such as relative FP usage can vary across languages and dialects (e.g., Lo, Reference Lo2019; Tian et al., Reference Tian, Maruyama and Ginzburg2017; Wieling et al., Reference Wieling, Grieve, Bouma, Fruehwald, Coleman and Liberman2016)—here, we show that the same principles apply when comparing bilingual and representative comparison speakers.
The second research question asked how vowel-quality properties (i.e., F1 and F2) differ among the four interview groups. For F1, the Afrikaans comparisons displayed the highest mean (low vowels), and the Spanish comparisons had the lowest mean (high vowels). For F2, the Afrikaans comparisons displayed the lowest mean (back vowels), and the Spanish comparisons had the highest mean (front vowels). These were expected outcomes. Critically, for both acoustic dimensions, the bilinguals’ values occupied an intermediate, unmerged space. In other words, the bilinguals were not entirely similar to either comparison group (with values contrasting in the direction of the nontarget language), maintaining separate distributions in each of their L1 and L2.
The third research question asked how duration properties of FPs differ among the four interview groups. We found that FPs in the Afrikaans-comparison group are generally shorter than FPs in the Spanish-comparison group (summing both vocalic and consonantal durations). Regarding vowel duration, the bilinguals patterned differently based on FP type, with values generally trending in a Spanish-like fashion. Regarding nasal duration, the bilinguals’ values were in the direction of the Afrikaans-comparison group, and were consistently shorter than those of the Spanish comparisons.
To summarize, we have shown that: the bilinguals display the same FP inventories as their comparison groups, although there are differences in the frequency of use of FP types (RQ 1); the bilinguals display separate, but intermediate, values in their L1 and L2 for measures of vowel quality (RQ 2); the Afrikaans-comparison FPs are consistently shorter than the Spanish-comparison FPs, with the bilinguals showing different trends whether the vowel or consonant is analyzed (RQ 3).
PATTERNS OF CROSS-LANGUAGE INFLUENCE
Various authors have noted the difficulty of attempting to infer features of bilingual production as a definite byproduct of cross-language influence. For instance, Poplack and Levey (Reference Poplack, Levey, Auer and Schmidt2010, p. 391) caution against theoretical accounts that base their claims on contact-induced phenomena exclusively, arguing that such research does not always disentangle contact-inducted change from internal (i.e., strictly linguistic) change (see also Torres Cacoullos & Travis, Reference Torres Cacoullos and Travis2018, p. 788). More specifically, Torres Cacoullos and Travis propose a methodology, known as the comparative variationist approach, which offers an empirically rigorous method of pinpointing the nature of cross-linguistic influence; at the core of this approach is the modeling of variability of a linguistic feature alongside a group-wise comparison of the factors shaping structured variation. In the current analysis, we have not implemented a comparative-variationist methodology that would definitively elucidate the language-contact influences underlying our data. At the same time, we have documented four outcomes that are very commonly reported in the research on bilingual phonetic production: unidirectional L1-to-L2 influence; unidirectional L2-to-L1 influence; bidirectional L1-to-L2 and L2-to-L1 influence; and no cross-language influence.
Unidirectional L1-to-L2 influence: Regarding unidirectional L1-to-L2 influence, we found that, for V + N FPs, the mean nasal durations produced by the bilinguals in both their L1 Afrikaans and L2 Spanish were similar to the mean nasal durations produced by the Afrikaans-comparison group. The Spanish comparisons, however, had significantly longer nasal durations than all other groups. The similarity of the bilinguals’ Afrikaans and Spanish nasal durations to those of the Afrikaans comparisons suggests unidirectional influence of L1 Afrikaans on L2 Spanish.
Unidirectional L2-to-L1 influence: Regarding unidirectional L2-to-L1 influence, we found that, when examining the relative use of V-only FPs, the Afrikaans-comparison speakers produced V-only FPs with the lowest frequency among all interview groups. The bilinguals were not shown to differ significantly within their two languages, nor when compared to the Spanish comparisons, such that the lower frequency of V-only FPs was unique to the Afrikaans-comparison speakers. This suggests that the bilinguals’ L2 Spanish has dominant influence over the types of V-containing FPs produced in both their L1 and L2 (i.e., unidirectional L2-to-L1 influence).
Bidirectional influence: Regarding bidirectional influence (i.e., L1-to-L2 and L2-to-L1), we found that the mean F1 of the bilinguals in Spanish was significantly higher than that of the Spanish comparisons, in the direction of the Afrikaans comparisons. Additionally, the mean F1 of the bilinguals in Afrikaans was significantly lower than that of the Afrikaans-comparison group, in the direction of the Spanish comparisons. Furthermore, the fact that the bilinguals displayed distinct distributions in each of their languages (i.e., statistically significant differences between their L1 and L2) suggests that there are separate, unmerged categories on this dimension (see also Lo, Reference Lo2019).
No cross-language influence: Regarding lack of cross-language influence, we observed that the bilinguals were typologically closer to each comparison group in terms of their FP inventories in Spanish and Afrikaans. The bilinguals produced all three FP types in Spanish, but only V-only and V + N FPs in Afrikaans, mirroring the respective comparison-group inventories. This suggests a lack of influence between the two languages of the bilingual speakers.
Putting the data together, our results are reminiscent of the patterns of cross-language interactions reviewed in "Background and Motivation." Recall that the primary difference between the studies reviewed earlier and the present study is that the vast majority of phonetic outcomes from the former group were based on real words or nonce words, paralleling lexically contentful speech. The results of our study, therefore, suggest that FPs are controlled by the same phonetic principles that govern lexically contentful speech. The issue of how FPs are incorporated into a bilingual’s grammar on a more abstract level is an open question in linguistic research (Erker & Bruso, Reference Erker and Bruso2017; Fruehwald, Reference Fruehwald2016; Tian et al., Reference Tian, Maruyama and Ginzburg2017)—in fact, Clark and Fox Tree (Reference Clark and Fox Tree2002) go as far to suggest that FPs are words, signaling different lengths of delay. As mentioned in the introduction, others propose a conflation between FPs, discourse markers, and lexical items (e.g., Graham, Reference Graham2013; Swerts et al., Reference Swerts, Wichmann and Beun1996).
Our results demonstrate further that FPs have multiple phonetic facets, which are capable of patterning independently. To offer one illustrative example, the patterns of cross-language influence for vowel-quality metrics (i.e., F1 and F2) were not completely analogous to those for duration metrics (i.e., V_DUR and N_DUR), even when controlling for factors such as speaker age and individual speech rate. Such a finding has likewise been reported in lexically contentful speech. For example, Henriksen et al. (Reference Henriksen, Coetzee, García-Amaya, Wissing and Bouavichith2017) show, through an acoustic analysis of stop phonemes, that phonetic properties such as VOT and closure voicing do not pattern analogously in each of the bilinguals’ languages.
INDIVIDUAL SPEAKERS
The discussion thus far supports the idea that, for acoustic measures of vowel quality (i.e., F1 and F2), the bilinguals display intermediate values in each of their two languages. However, at the individual level, we were able to identify two bilingual speakers who emerged as having the most Afrikaans- or Spanish-like productions, respectively, based on the by-speaker plots provided in the Appendix (see Appendices C and E). Specifically, speaker F7 displayed values closest to the Afrikaans-comparison group in both languages for the F1 and F2 measures.Footnote 8 Similarly divergent was speaker M10, the bilingual to display F1 and F2 values closest to the Spanish-comparison group in both languages. In an effort to understand these quantitative differences, we subsequently examined the linguistic histories of all 14 bilingual speakers, based on the information offered in their interviews.
A more detailed analysis of speaker F7’s linguistic history reveals that Afrikaans played a major role in familial and communal life, namely, in the farmland community where F7 has lived for the majority of her life. Speaker F7 reported that her Spanish age of acquisition (AoA) was 18 years old, the latest among the 14 bilinguals. Additionally, F7 never received formal education in Spanish and expressed mistreatment by peers due to her known accentedness when speaking her L2 (speaker F12 was the other speaker to report lack of education in Spanish). However, speaker M10’s linguistic history reveals that, after age 8 (his Spanish AoA), this speaker did not use Afrikaans often because of embarrassment at school related to language use. Nowadays, when speaker M10 encounters members of the community, his interactions are generally in Spanish. Finally, and very differently from F7, speaker M10 expressed a stronger connection to Argentina than to South Africa.
The apparent patterning of vowel-quality values in these two bilingual speakers brings to light the importance of taking into account a speaker’s AoA (e.g., Flege et al., Reference Flege, Yeni-Komshian and Liu1999), as well as one’s education in the L2 (e.g., Rothman, Reference Rothman2007). Altogether, a closer inspection of individual data is in line with Ortega (Reference Ortega, Cook and Wei2016), who calls for studies that include analyses of all languages by individual multilingual speakers, as well as by representative comparison-group samples (see also de Jong & Mora, Reference de Jong and Mora2019). To this point, we acknowledge that, in addition to documenting the degree of individual variation among the bilinguals, we uncovered considerable individual differences within the two comparison groups (see Appendices C, E, G, and I).
LIMITATIONS AND FUTURE DIRECTIONS
There are several limitations of this study. First, it was not possible to determine the effect of language mode, i.e., whether prior activation of the L1 or L2 affects production patterns in the other language (Antoniou et al., Reference Antoniou, Best, Tyler and Kroos2011). To ask this question more effectively, it would be necessary to develop a more controlled set of research questions and data-collection protocols in which speakers participate in L1 or L2 tasks on separate experimental days. Given the nature of our fieldwork in Patagonia, which typically involved visiting one community member’s house per day, it was not possible to coordinate repeated visits to the houses of bilingual speakers.
A second limitation is that we have not elucidated on the relationship between FPs and the syntactic complexity of utterances, that is, through examination of subordination, length, coordination, and phrasal complexity, as shown in previous research (e.g., Mirdamadi & de Jong, Reference Mirdamadi and de Jong2015; Norris & Ortega, Reference Norris and Ortega2009). In future work, it might be worthwhile to develop a more structured experimental design, through a series of predetermined target utterances of varying complexity, to determine the role of syntactic complexity on FP usage.
CONCLUSION
In this article, we have presented an in-depth exploration into the effects of long-term bilingualism on L1 Afrikaans and L2 Spanish in Patagonia, Argentina. The situation of sustained, cross-generational contact between Afrikaans and Spanish is not, to our knowledge, replicated in any other region in the world. In our analysis, we have gone beyond the impressionistic description of FP usage in bilingual speech—our research represents an important step in obtaining an objective, acoustic analysis of bilingual data produced in a spontaneous setting (see also Erker & Bruso, Reference Erker and Bruso2017; Lo, Reference Lo2019). Specifically, we focused on the relative use of three different types of FPs (categorical analysis), as well as on vowel quality and segmental durations (continuous analysis). The findings are in line with four possible patterns of cross-language influence: L1-to-L2 influence, L2-to-L1 influence, bidirectional influence, and no cross-language influence. Altogether, the array of findings documented here suggest that: (a) FPs have multiple facets, which have the potential to pattern independently; and (b) bilingual FPs are susceptible to the same patterns of cross-language phonetic inference as those observed in traditionally understood lexical items. Moving forward, models of L2 phonological learning would do well to be informed by this integration of lexical and hesitation items in bilingual grammar.
Appendix A
Distribution of FP-type usage, based on GROUP. Categories of FP type are: nasal-consonant-only (N-only); vowel + nasal consonant (V + N); and vowel-only (V-only)

Appendix B
F1_NORM descriptive data for V-only and V + N FPs

Appendix C
Boxplots of F1_NORM by SPEAKER_CODE. Higher F1 values indicate vocalic segments produced with lower articulations

Appendix D
F2_NORM descriptive data for V-only and V + N FPs

Appendix E
Boxplots of F2_NORM by SPEAKER_CODE. Higher F2 values indicate vocalic segments produced with more front articulations

Appendix F
Vowel-duration (V_DUR) descriptive data for V-only and V + N FPs

Appendix G
Boxplots of vowel duration (V_DUR) by SPEAKER_CODE

Appendix H
Nasal-consonant-duration (N_DUR) descriptive data for N-only and V + N FPs

Appendix I
Boxplots of nasal-consonant duration (N_DUR) by SPEAKER_CODE