


Introduction
Dyckia ibiramensis Reitz is a bromeliad endemic to southern Brazil (Reitz, Reference Reitz and Reitz1983), with a distribution restricted to approximately two kilometers along the Itajaí do Norte River. Like other species of the genus, it is highly adapted to extreme environmental variations, overcoming periods of floods and droughts (Pinangé et al, Reference Pinangé, Krapp, Zizka, Silvestro, Leme, Weising and Benko-Iseppon2017; Krapp and Eggli, Reference Krapp, Eggli, Eggli and Nyffeler2020). This endemism, combined with habitat fragmentation and population reduction, places the species at high risk of extinction. According to the National Center for Flora Conservation in 2013 and the Ministry of the Environment in 2022, D. ibiramensis is classified as Endangered (EN), while the Santa Catarina State Environmental Council in 2014 classified it as Critically Endangered (CR).
In addition to its restricted distribution and rupicolous habit, D. ibiramensis exhibits a mixed reproductive system. Experimental data suggest that the species is predominantly allogamous, with low fruit set under manual self-pollination and no germination of pollen grains in stigmas after 24 hours of self-pollination, indicating a probable self-incompatibility mechanism (Hmeljevski et al, Reference Hmeljevski, Reis, Reis, Rogalski, Daltrini-Neto and Lenzi2007). Nonetheless, the occurrence of vegetative propagation through clonal rosettes has been observed in natural populations, a strategy that can increase individual persistence but also promote geitonogamy and reduce genetic diversity (Hmeljevski et al, Reference Hmeljevski, Reis, Montagna and Dos Reis Ms2011). Palynological characterization indicates potential adaptation to hydrophilous pollination, possibly facilitated by the riparian environment of the Itajaí do Norte River (Mouga et al, Reference Mouga, Possamai, Dec and Silva2017). These reproductive features are central to understanding the genetic structure of D. ibiramensis populations and must be considered in the development of conservation strategies, particularly those based on molecular data.
Natural populations of D. ibiramensis are exposed to a series of edaphoclimatic and biological pressures, including anthropic factors. Plants of this species can represent an excellent study model for adaptation and tolerance to various stresses (Flood and Hancock, Reference Flood and Hancock2017). These adaptations, in turn, have a genetic basis, and genomics plays a fundamental role in understanding the complex characteristics of species, allowing a more in-depth and detailed exploration of the genome (Wambugu et al, Reference Wambugu, Ndjiondjop and Henry2018). Genomics makes the analysis of specific characteristics possible, allowing the investigation of intra- and inter-population genetic diversity and the understanding of evolutionary processes that mark the species' trajectory (Gossmann et al, Reference Gossmann, Song, Windsor, Mitchell-Olds, Dixon, Kapralov, Filatov and Eyre-Walker2010).
Microsatellite markers are short units of one to five bases repeated in tandem (Srivastava et al, Reference Srivastava, Avvaru, Sowpati and Mishra2019). They are locus-specific, co-dominant, and highly polymorphic, thus becoming a valuable tool for studies such as population genetics (Stefenon et al, Reference Stefenon, Gailing and Finkeldey2007), gene flow (Nagel et al, Reference Nagel, Ceconi, Poletto and Stefenon2015), conservation and improvement of non-model (Lemos et al, Reference Lemos, Matielo, Beise, Da Rosa, Sarzi, Roesch and Stefenon2018) or non-cultivated species (Petry et al, Reference Petry, Stefenon, Machado, Klabunde, Pedrosa and Nodari2019). SSR markers can be found in expressed and non-expressed regions of a species’ genome and are useful for the analysis of genes of interest, such as those related to stress resistance and adaptation (Lemos et al, Reference Lemos, Matielo, Beise, Da Rosa, Sarzi, Roesch and Stefenon2018). Due to their highly informative characteristics, microsatellite markers are widely used for the analysis of genetic diversity and structure of Bromeliaceae (Zanella et al, Reference Zanella, Janke, Palma-Silva, Kaltchuk-Santos, Pinheiro, Paggi, Soares, Goetze, Büttow and Bered2012).
Plastid genomes have been widely used for evolutionary and phylogenetic studies. These organellar genomes may provide valuable insights into the adaptive traits of species (Pacheco et al, Reference Pacheco, Lopes, Welter, Yotoko, Otoni, Vieira, Guerra, Nodari, Balsanelli, Pedrosa, Souza and Rogalski2020; Silva et al, Reference Silva, Lopes, Pacheco, Machado, Silva, Oliveira, Baura, Balsanelli, Souza, Pedrosa and Rogalski2021). Certain evolutionary traits of plastid genomes, including gene content, gene loss, RNA editing, gene transfer to the nucleus, and recombination events, are crucial for understanding plant evolution and their adaptation to environmental conditions (Vieira et al, Reference Vieira, Rogalski, Faoro, Fraga, Anjos, Picchi, Nodari, Pedrosa, Souza and Guerra2016; Pacheco et al, Reference Pacheco, Lopes, Welter, Yotoko, Otoni, Vieira, Guerra, Nodari, Balsanelli, Pedrosa, Souza and Rogalski2020). Such information can aid in planning the conservation of endangered plant genetic resources, particularly in the current context of ongoing climate change.
Considering the endangered status of D. ibiramensis and the current advances in genomic data generation and analysis, this study aimed to develop novel genomic resources for this threatened bromeliad species. The main hypothesis is that, despite having undergone a genetic bottleneck, the extant subpopulations of D. ibiramensis still retain moderate levels of genetic diversity and evolutionary features that contribute to their persistence. If confirmed, these attributes can serve as a foundation for designing targeted conservation strategies. To test this hypothesis, partial genome sequencing of D. ibiramensis was conducted to develop species-specific microsatellite markers and to assemble and annotate its plastid genome. These genomic resources were then applied to investigate genetic diversity, demographic history, and evolutionary features to inform the conservation planning of this endangered genetic resource.
Material and methods
Plant material, DNA isolation, and genome sequencing
Leaf samples from adult plants (Fig. 1a–b) were collected in the municipality of Ibirama, Santa Catarina (27°02’20’’S, 49°33’46’’W, ∼ 224 m) for total genome sequencing, development of microsatellite markers, and plastid genome assembly and annotation. The region has a humid subtropical climate, with hot summers, an average annual temperature between 18 and 20 °C, and an average relative humidity between 82% and 84%, with humidity tending to be lower in the winter months (Wrege et al, Reference Wrege, Steinmetz, Reisser Júnior and Almeida2012). An exsiccate of the species was deposited in the FLOR herbarium of the Federal University of Santa Catarina under the record FLOR 79881. The D. ibiramensis occurs in a few spatially clustered groups along a short stretch (∼2 km) of the Itajaí do Norte River, growing over exposed rocky outcrops. These clusters are relatively close to each other, and it remains uncertain whether they constitute distinct populations or substructuring within a single population. For this study, we sampled individuals from the three largest and most spatially separated clusters (10 individuals per cluster), ensuring adequate spacing among rosettes to avoid clonal sampling, given the species’ capacity for vegetative propagation. The use of the identifiers Pop4, Pop6, and Pop7 follows a historical coding system from prior fieldwork by our research group and does not reflect the total number or hierarchical structure of clusters in the area.
(a) Flowering rosettes of Dickia ibiramensis in its natural range of occurrence. (b) Flowers of D. ibiramensis. (c) Probability of identity (PI) analysis of the 10 microsatellite markers developed for D. ibiramensis. (d) Partitioning of the genetic variability based on the analysis of molecular variance (AMOVA). (e) Distribution of the diversity (D’) and the overlap (O’) among and within subpopulations, based on Shannon Index estimations. (f) Allele shift test for ancient population genetic bottleneck.

Total DNA was isolated from healthy leaves using the CTAB method (Doyle and Doyle, Reference Doyle and Doyle1987). The quality of the isolated DNA was verified using a NanoDrop 1000® spectrophotometer to assess concentration and absorbance ratios of 260/280 and 260/230. Quantification was performed using a Qubit® fluorometer. The integrity (absence of degradation) of the DNA samples was verified by electrophoresis in 0.8% agarose gel, stained with GelRed, and visualized under ultraviolet light. For total genome sequencing, genomic library preparation was performed using the Ligation Sequencing Kit SQK-LSK109 and SQK-LSK112. Low-coverage genome sequencing was conducted on an Oxford Nanopore Technologies Mk1B platform in flow cells R9.1 for the SQK-LSK109 kit and R10.1 for the SQK-LSK112 kit. Basecalling was performed using Guppy software. PORECHOP was used to clean the sequences, and contig assembly was performed using FLYE software. REDUNDANS software was employed to remove repeated contigs due to heterozygosity. Both raw data and contigs were deposited in BioProject PRJNA872198, BioSample SAMN30448151, in the GenBank/NCBI database.
Microsatellite markers
Microsatellite regions were analyzed using GMata v2.3 software (Wang and Wang, Reference Wang and Wang2016), configured to identify sequences with a minimum of 10 repeats for monomers, six for dimers, and five for trimers, tetramers, and pentamers. The primers for the identified SSR loci were designed to amplify alleles with sizes ranging from 200 to 400 bp.
The prospected microsatellite loci were validated in silico by performing virtual PCR and electrophoresis using the SIMGEL software, which is included in the SPCR package (Cao et al, Reference Cao, Wang, Xu, Kou, Zhang, Wei, He, Wang and Zhao2005). This validation step aims to select viable loci for use as molecular markers, excluding loci with multiple overlapping amplifications or products outside the expected size range. After selecting 250 potentially informative loci, their genomic origin (neutral nuclear, gene-linked nuclear, plastid, or mitochondrial) was characterized using the BLAST technique against the GenBank database.
Primers were synthesized for 20 markers and initially validated in five random samples for the selected markers to verify their functionality and efficiency. After these tests, the 10 markers that revealed reliable patterns were used to genotype the 30 samples collected from the natural population. PCR amplification was performed using approximately 30 ng of DNA, 1X PCR buffer, 0.2 µL of BSA (5 mg mL-1), 0.5 µM MgCl2, 1 U Taq DNA polymerase, 0.05 µM of dNTPs, 0.125 µM of each primer, and 0.125 µM of a fluorescently labeled M-13 primer (5’-TGTAAAACGACGGCCAGT-3’), in a final volume of 15 µL. In this methodology, the forward primers of all markers have the sequence M-13 (5’-TGTAAAACGACGGCCAGT-3’) in the 3’ position, to which the fluorescent M-13 primer binds (Schuelke, Reference Schuelke2000).
The PCR cycle consisted of an initial denaturation step at 94 °C for 5 minutes, followed by 30 cycles with a denaturation temperature at 94 °C for 30 seconds, annealing at 56 °C for 45 seconds, extension at 72 °C for 45 seconds, and eight cycles of denaturation at 94 °C for 30 seconds, annealing at 53 °C for 45 seconds, and extension at 72 °C for 45 seconds, with a final extension at 72 °C for 10 minutes. After amplification, the alleles were separated by 2.5% agarose gel electrophoresis, stained with GelRed, and visualized under UV light to verify the success of the amplification. Finally, the alleles were separated by capillary electrophoresis in an ABI 3500xL Genetic Analyzer (ThermoFisher®). The allele calling was performed automatically using the GeneMapper software (ThermoFisher®), and a visual check of the luminescence peaks in the electropherograms was conducted to correct any errors. Alleles were recorded according to the size (in bp) of the fragments.
The informative capacity of the loci for genetic diversity analyses was determined using different indices. GenePop on the Web (Rousset, Reference Rousset2008) was used to estimate linkage disequilibrium between loci. The presence of null alleles and genotyping errors of nuclear microsatellite loci was verified using Micro-Checker 2.2.4 (Van Oosterhout et al, Reference Van Oosterhout, Hutchinson, Wills and Shipley2004).
The informative capacity of the microsatellite markers was determined by estimating the Probability of Identity (PI), which calculates the probability that two individuals randomly collected within the sample would have the same genotype purely by chance. The loci are added one by one to the analysis, and the PI is estimated again after each new locus addition.
The genetic diversity indices total number of alleles (A), effective number of alleles ( ${A_e} = \frac{1}{{\mathop \sum \nolimits_{}^{} p_i^2}}$), observed heterozygosity (Ho), unbiased expected heterozygosity (
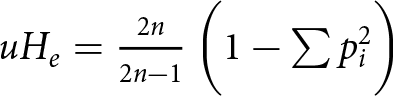 $u{H_e} = \frac{{2n}}{{2n - 1}}\left( {1 - \mathop \sum \limits_{}^{} p_i^2} \right)$, fixation index (
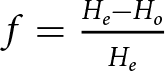 $f = \frac{{{H_e} - {H_o}}}{{{H_e}}}$) and deviation from Hardy-Weinberg equilibrium (HWE) were estimated for each subpopulation and overall. The genetic structure among the subpopulations was estimated through analysis of molecular variance (AMOVA; Excoffier et al, Reference Excoffier, Smouse and Quattro1992) and Shannon index. The estimates were performed using the GenAlEx program (Peakall and Smouse, Reference Peakall and Smouse2006, Reference Peakall and Smouse2012). Additionally, historical bottleneck events in the sampled subpopulations was verified. The Bottleneck software (Piry et al, Reference Piry, Luikart and Cornuet1999) was used for the analyses of heterozygotes excess (Cornuet and Luikart, Reference Cornuet and Luikart1996) for the infinite allele model (IAM) and the stepwise mutation model (SMM), and the shift of allele frequency distribution (Luikart et al, Reference Luikart, Allendorf, Cornuet and Sherwin1998), while the Arlequin software (Excoffier and Lischer, Reference Excoffier and Lischer2010) was used for the M-ratio analysis (Garza and Williamson, Reference Garza and Williamson2001).
Assembly and annotation of the plastid genome
The D. ibiramensis plastid genome was assembled using a reference-guided approach with the plastid genome of Ananas comosus cultivar MD2 (GenBank ID KR336549) as the reference, in the CLC Genomics Workbench software. Corrections were performed by cross-checking the D. ibiramensis plastid genome consensus sequence, the reference sequence, and FASTQ reads. The reference genome was used to avoid misassemblies of the error-prone NGS reads, while the cross-checking with the FASTQ reads allowed the validation of the newly sequenced plastid genome’s particularities. Plastid genome annotation was performed using GeSeq (Tillich et al, Reference Tillich, Lehwark, Pellizzer, Ulbricht-Jones, Fischer, Bock and Greiner2017) on the Chlorobox platform, starting from two reference chloroplast annotations (Ananas comosus and Puya ferruginea). The tRNAscan-SE (Chan and Lowe, Reference Chan and Lowe2019) and ARAGORN (Laslett and Canback, Reference Laslett and Canback2004) software were used to search for tRNAs, while the physical circular map of the plastid genome was constructed using the Organellar Genome DRAW software (Lohse et al, Reference Lohse, Drechsel, Kahlau and Bock2013).
For dot-plot analyses, plastid genomes of 23 reference species within the Bromeliaceae family were used (Online Supplementary Table S1). Zea mays (NC_001666.2) and Oryza sativa cv. Shuhui498 (CP018170.1) were used as outgroups. Sequence alignment of all plastid genomes was performed using MAFFT. DNAsp (Rozas et al, Reference Rozas, Ferrer-Mata, Sánchez-delbarrio, Guirao-Rico, Librado, Ramos-Onsins and Sánchez-Gracia2017) was used to analyze codon usage and to characterize the hotspots of genetic variation by applying the Sliding Window method. The sliding window analysis was performed only with species sharing the same structural arrangement of the plastid genome, based on the dot-plot analysis. The PREPACT v3 software was used to analyze RNA editing sites.
Results
Sequencing and assembly outputs
The two sequencing runs performed generated a total of 1.00 billion reads with a mean Q-score of 11.3. The partial genome assembly totaled 4,647,909 bases in 660 contigs, with an N50 of 3,998 base pairs (bp). The largest contig has 326,912 base pairs, and the GC content was 45.71%.
Prospection, characterization, and validation of microsatellite loci
A total of 33,112 microsatellite loci were identified throughout the partial genome assembly (Table 1). After characterization and in silico (250 markers) and wet-lab (20 markers) validation, 10 markers that presented reliable patterns (amplification product within the expected size, single-allele amplification, and absence of overlapping of unspecific amplification products) were selected to genotype 30 individuals from the natural population (Table 2). All 10 microsatellite markers selected are neutral and nuclear.
Characteristics of the microsatellite markers (SSRs) developed for Dyckia ibiramensis

Tm: Annealing temperature.
Estimates of linkage disequilibrium between marker pairs

The PI analysis (Fig. 1c) suggests a highly informative capacity of the markers, with a probability of 1.0 × 10⁻⁸ that two randomly sampled individuals will have the same genotype when all 10 markers are used, both among adults and among eventual progenies (siblings).
Analysis using the Micro-Checker software suggested the presence of null alleles at markers MK276 and MK302. Thirteen marker pairs demonstrated linkage disequilibrium at the subpopulation level (Table 2). However, none of the marker pairs had a p-value lower than 0.05 in all subpopulations, suggesting that there are no physically linked marker pairs.
All markers revealed moderate to high polymorphism, but marker mk276 was monomorphic in subpopulation 4 (Table 3). For the evaluated subpopulations, the mean number of alleles (A) ranged from 2 to 15 (mean of 7.7), the effective number of alleles (Ae) from 1.14 to 8.82 (mean of 4.07), observed heterozygosity (Ho) from 0 to 1.0 (mean of 0.651), expected heterozygosity (He) from 0.127 to 0.902 (mean of 0.685), and the fixation index (f) from -0.931 to 1.0 (mean of 0.079). When subpopulations were evaluated individually, the estimations of A, Ae, Ho, and He remained similar for each marker and on average, suggesting genetic homogeneity among them (Table 3). On the other hand, the mean fixation index contrasted among subpopulations, with negative estimations for subpopulations 6 and 4, but positive in subpopulation 7 (Table 3). However, these average values were not significantly different from zero, which may reflect, at least in part, the limited sample size. Thus, their interpretation requires caution. Approximately half of the markers showed statistically significant deviation from the Hardy-Weinberg equilibrium (HWE) in all three subpopulations.
Genetic characterization of ten microsatellite loci developed for Dyckia ibiramensis

N: number of genotyped individuals; A: Number of alleles; Ae: effective number of alleles; Ho: observed heterozygosity; uHe: unbiased expected heterozygosity; f: fixation index; HWS: Hardy-Weinberg equilibrium.
* ns: no significance; p < 0.05; ** p < 0.01; *** p < 0.001.
The analysis of molecular variance (Fig. 1d) demonstrated that 1% of the genetic variation was attributed to differences among subpopulations, 6% to differences among individuals within populations, and 93% to variation within individuals, reflecting the high rate of observed heterozygosity. In turn, the diversity (i.e., the amount of differentiation) and overlap (i.e., the amount of similarity) scaled based on the Shannon index, a measure of divergence/similarity (Fig. 1e) showed that the subpopulations diverge, on average, 23.5% (D’ = 0.235), while the differentiation among individuals within populations is, on average, 76.8% (D’ = 0.768).
The analysis of bottleneck events suggested the occurrence of such a reduction in population size only for the infinite alleles model (IAM) in subpopulation 7, as indicated by the excess of heterozygosity analysis (Table 4). No signatures of a genetic bottleneck were captured in the allele shift test for any subpopulation (Fig. 1f). On the other hand, the M-ratio estimations for all populations were lower than 0.68, suggesting a reduction in population size for the three subpopulations analyzed (Table 4).
Bottleneck indicators in Dyckia ibiramensis populations

Number of loci with an excess of heterozygotes (N(He > Heq)) is presented for each population, together with the p-values obtained in the Wilcoxon test, applied to the infinite allele mutation (IAM) and stepwise mutation (SMM) models. P-values < 0.05 were considered significant. In the M-ratio analysis, values below 0.68 were considered indicative of a genetic bottleneck.
Assembly and annotation of the plastid genome
The assembled plastid genome of D. ibiramensis (GenBank ID OR832762.1) is 159,176 bp long, having the typical quadripartite structure, with a large single copy region (LSC) of 70,947 bp, a small single copy region (SSC) of 18,608 bp, and two inverted repeat regions (IRs) of 26,170 bp each. A total of 125 genes were predicted in the plastid genome, including 38 tRNA and 8 rRNA coding genes.
The dot-plot analysis demonstrated that the plastid genome of D. ibiramensis structurally diverges from the plastid genomes of H. rosea and P. breedlovei (subfamily Pitcairnioideae) with respect to genomic organization (Fig. 2). On the other hand, A. comosus (subfamily Bromelioideae) and P. raimondii (subfamily Pitcairnioideae) share the genomic structure of the plastid genome with D. ibiramensis (Fig. 2), suggesting distinct evolutionary lineages for these subfamilies.
Dot plot analysis of the Dyckia ibiramensis plastome against five Bromeliaceae species. The positive red slope corresponds to the LSC and SSC regions, while the negative blue slope corresponds to the alignment of the IRa and IRb portions of the plastomes.

The relative synonymous codon usage (RSCU) analysis (Fig. 3a) showed that the AGA codon (arginine) had the highest representation (RSCU = 1.95), while CGC (also arginine) had the lowest (RSCU = 0.4). As expected, codons for methionine (AUG) and tryptophan (UGG) showed no usage bias (RSCU = 1.0).
(a) Codon usage profile in the plastome of Dyckia ibiramensis. RSCU values above 1.5 (↑) indicate a preference for the corresponding codon, while values below 0.5 (↓) suggest underutilization. An RSCU value of 1.0 denotes a lack of codon usage bias. (b) Sliding window analysis. The X-axis represents the nucleotide position along the plastome, and the Y-axis denotes nucleotide diversity (π). The dashed line indicates the high polymorphism threshold, defined as seven times the average π value. The analysis was conducted with a window size of 100 base pairs (bp) and a step size of 25 bp.

The sliding window analysis (Fig. 3b) revealed eight hotspots of nucleotide diversity (π), considering values at least five-fold higher than the nucleotide diversity measured across all plastid genomes (π = 0.00735). The coding region with the greatest variability was the ndhE gene (π > 0.1), followed by the pafII gene (π > 0.1) and the ccsA gene (π > 0.08).
RNA editing sites were predicted using Cocos nucifera, Arabidopsis thaliana, Nicotiana tabacum, Oryza sativa, and Zea mays as references. A total of 445 editing sites were identified across 39 genes. The ndhB gene had the greatest number of predicted editing sites (72), while psbZ had the fewest (2).
Discussion
The set of microsatellite markers is informative and suggests high resilience and adaptation of dyckia ibiramensis populations
In addition to the development and validation of SSR markers, the results of this study also provided preliminary insights into the genetic composition of the evaluated subpopulations. However, given the limited sample size – restricted to 30 individuals from three subpopulations – these interpretations should be viewed with caution. The markers’ performance and the patterns observed here should not be generalized to the entire species range without further validation through broader sampling.
The application of multiple molecular markers is especially relevant in species with small and fragmented populations, such as D. ibiramensis, where precision in genetic identification can guide conservation and management efforts (Yao et al, Reference Yao, Ye, Kang and Huang2007). The probability of identity analysis (Fig. 1c) indicates a high capacity of these microsatellite markers in discriminating individuals. Using only three markers allows a likelihood smaller than 5.9 × 10⁻⁴ of mistakenly identifying two individuals randomly sampled within one of the subpopulations. With 10 markers, this probability is smaller than 6.3 × 10⁻⁹. Although null alleles and linkage disequilibrium at the subpopulation level suggest possible limitations in the developed microsatellite markers, other parameters must also be considered. The relatively small size of the subpopulations, likely including some inbred individuals, can be a crucial factor in reducing heterozygosity, a fact that may be misinterpreted as the presence of null alleles and physical linkage between loci. These deviations can also be attributed to natural selection, which benefits certain genotypes, or genetic drift in small and isolated populations that may suggest a false linkage between loci (González-Astorga et al, Reference González-Astorga, Cruz-Angón, Flores-Palacios and Vovides2004; Sheu et al, Reference Sheu, Cunha-Machado, Abpl, Favoreto, Soares and Miranda2017; Soares et al, Reference Soares, Goetze, Zanella and Bered2018). In this study, no marker pair was estimated to be linked in all three subpopulations. Moreover, only loci located on different contigs and mapped against different chromosomes in the pineapple reference genome were selected for the marker’s development validation by genotyping three subpopulations of D. ibiramensis. Thus, the probability that physically linked loci have been selected is extremely low.
The microsatellite data suggest the presence of substantial genetic variability in the samples analyzed, which may contribute to the species’ capacity to respond adaptively to environmental pressures (Fischer et al, Reference Fischer, Rellstab, Leuzinger, Roumet, Gugerli, Shimizu, Holderegger and Widmer2017). The estimated mean fixation index (f) was positive in subpopulation Pop7 and negative in Pop4 and Pop6 (Table 3). Although variation in the average fixation index (f) was observed among subpopulations – with positive values in some and negative in others – these differences were not statistically significant and may result from stochastic processes such as genetic drift or sampling variance, rather than indicating actual patterns of inbreeding or gene flow. Evaluating isoenzyme markers, Hmeljevski et al. (Reference Hmeljevski, Reis, Montagna and Dos Reis Ms2011) reported a low level of genetic diversity (He = 0.219) and a high level of fixation (f = 0.642) in D. ibiramensis populations. The genetic diversity observed with microsatellites in this study is considerably higher, which may be attributed to the greater sensitivity and precision of these markers in detecting genetic variability.
Concerning the distribution of the genetic diversity of D. ibiramensis, the analysis of molecular variance partitioned 93% of the total genetic variability within individuals, and the Shannon index revealed 23.5% of genetic divergence within populations. Jointly, these results highlight the importance of conserving both subpopulations and individuals, as the genetic diversity appears to be distributed at multiple levels. In P. raimondii, genetic analyses showed moderate genetic diversity, suggesting an adaptive pattern important for survival in extreme environments (Hornung-Leoni et al, Reference Hornung-Leoni, Sosa, Simpson and Gil2013).
The combined analyses of genetic bottlenecks suggest that D. ibiramensis populations may have undergone significant ancient reductions in population size. Previous studies on D. ibiramensis suggested that the species has experienced genetic bottleneck events, indicating possible population reductions and genetic drift (Hmeljevski et al, Reference Hmeljevski, Reis, Montagna and Dos Reis Ms2011). The methods used in this study cover different and complementary time intervals, measured as generations concerning the effective population size (Ne), capturing signatures of genetic bottlenecks in an interval of 0.2 × Ne to more than 4.0 × Ne generations. M-ratio values lower than 0.68, observed for all subpopulations analyzed, are signatures of bottleneck events that occurred more than 4.0 × Ne generations ago (Garza and Williamson, Reference Garza and Williamson2001). In contrast, the analyses of heterozygosity excess (Cornuet and Luikart, Reference Cornuet and Luikart1996) and the shift of the allele frequency distribution (Luikart et al, Reference Luikart, Allendorf, Cornuet and Sherwin1998) did not capture signatures of bottlenecks. Since these two analyses capture signatures of more recent bottlenecks (from 0.2 to 2.0 × Ne generations), we hypothesize that D. ibiramensis populations recovered their population size after the ancient genetic bottleneck captured by the M-ratio analysis.
The plastid genome reveals genetic variability potentially involved in adaptation to harsh environments
The assembly, annotation, and analysis of the plastid genome of D. ibiramensis provide valuable preliminary insights into the organelle's structural and functional dynamics concerning environmental adaptation and evolutionary patterns. The assembled plastid genome presents the traditional quadripartite structure, demonstrating its structural conservation. The similarity in plastid genome size and structural conservation among D. ibiramensis, Ananas comosus, and P. raimondii (Fig. 2) indicates the possibility of shared evolutionary events or selective pressures common to these species/subfamilies.
In comparison with plastid genomes of Bromeliaceae species, the sliding window analysis (Fig. 3b) showed that D. ibiramensis has the ndhE and pafII genes with the highest π estimations, with the former standing out the most. A high estimation of π in sliding window analyses demonstrates great variability within this region, which may indicate selective pressure, high mutation rate, or genetic recombination (Sheikh-Assadi et al, Reference Sheikh-Assadi, Naderi, Kafi, Fatahi, Salami and Shariati2022). These hotspots of genetic diversity, observed in the alignment across Bromeliaceae species, may reflect localized mutational pressure or potential lineage-specific adaptive evolution.
Morphological characteristics in the genus Dyckia have evolved several times throughout history, contributing to the hypothesis that this genus is of recent origin (Krapp et al, Reference Krapp, de Barros Pinangé Ds, Benko-Iseppon, Leme and Weising2014; Pinangé et al, Reference Pinangé, Krapp, Zizka, Silvestro, Leme, Weising and Benko-Iseppon2017). Furthermore, Dyckia species may be not only morphologically distinct but also genetically distinct (Krapp et al, Reference Krapp, de Barros Pinangé Ds, Benko-Iseppon, Leme and Weising2014). In the present study, we observed a preferential use of the AGA codon (Fig. 3a), which encodes arginine, which could suggest specific adaptations in the translation mechanism of D. ibiramensis. This preferential use may reflect an optimized translational efficiency, where the availability of corresponding tRNAs or the speed of recognition by the ribosome is maximized, facilitating rapid protein synthesis in response to specific environmental conditions. This pattern is supported by studies that associate variations in codon usage with adaptive responses to environmental stresses (Tyagi et al, Reference Tyagi, Kabade, Gnanapragasam, Singh, Gurjar, Rai, Sinha, Kumar and Singh2023).
We also highlight the presence of RNA editing sites in the ndhB gene of the plastid genome, evidencing a complex post-transcriptional regulation essential for the functionality of the NADH dehydrogenase complex (Ramadan, Reference Ramadan2020). Post-transcriptional modifications in RNA nucleotides are crucial to ensure the correct expression of ndhB proteins, adapting the photosynthetic activity of the plant to the extreme environmental variations typical of its rocky and exposed habitat. This finding corroborates evidence from studies in other species, such as A. thaliana, where RNA editing in ndhB plays a vital role in maintaining photosynthetic efficiency under stress conditions (Fu et al, Reference Fu, Lin, Zhou, Zhang, Liu, Feng, Wang, Wang and Jin2022). Therefore, the observed RNA editing sites may reflect the importance of this regulation for the environmental adaptation of D. ibiramensis and may contribute an additional complexity in gene regulation crucial for chloroplast function optimization and survival in challenging environments.
Conclusion
Microsatellite analyses provide a solid basis for monitoring genetic diversity over time, allowing the identification of genetically diverse individuals that may be priorities for breeding and reintroduction programs. Dyckia ibiramensis is endemic to a very restricted area in southern Brazil, making it particularly vulnerable to random events and environmental changes. The integration of nuclear and chloroplast genomic data opens new avenues for studies on the evolution, adaptation, and conservation of this and other endemic plant species in similar habitats.
Our study captured signatures of an ancient bottleneck but no signatures of more recent reductions in population size. This result, together with the moderate to high levels of genetic diversity assessed, suggests that D. ibiramensis has a high potential for recovering from such impacts. However, human influences tend to be more aggressive over a short period, and the species may lack sufficient time to recover its population size. Based on the results obtained, we suggest that the extant subpopulations of D. ibiramensis must be targeted for both in situ and ex situ conservation strategies. The genomic resources developed and employed in this study suggest that this species exhibits high resilience and the capacity to recover from genetic bottlenecks, in addition to evolutionary adaptations that enable it to thrive in the environmental conditions where D. ibiramensis grows. In situ conservation is necessary to secure the evolution of the species in its environment in the face of climate change. On the other hand, ex situ strategies will guarantee the survival of D. ibiramensis in the face of human and natural actions that are beyond the control of conservationists.
Supplementary material
The supplementary material for this article can be found at https://doi.org/10.1017/S1479262125100166.
Acknowledgements
This work was funded by the Foundation for Support to Research and Innovation in the State of Santa Catarina (FAPESC), number 27/2022. Additionally, this study was supported by the following Brazilian funding agencies: the National Council for Scientific and Technological Development (CNPq), which provided a master’s scholarship to the first author (JNOZ), and the Coordination for the Improvement of Higher Education Personnel (CAPES), Financing Code 001, which granted a master’s scholarship to the author LBBP.
Author contributions
JNOZ conceptualized and conducted the research, performed data curation and analysis, and drafted the initial version of the manuscript. LBBP participated in the execution of the research and data collection. YF and AKSS contributed to the experimental work and the revision of the manuscript. ARZ critically reviewed the manuscript and contributed to data analysis. TM secured funding for the research and revised the manuscript. VMS supervised and managed the research, contributed to experimental execution and manuscript preparation, and was the principal mentor for the project. All authors reviewed and approved the final manuscript.
Competing interests
The authors have no relevant financial or nonfinancial interests to disclose.



