1. INTRODUCTION
The shipping industry has witnessed fast growth in the last three decades due to the increasing demand for cargo delivery. Currently, more than 60% of international trade traffic volumes are shipped using maritime transportation modes. In general, shipping movements are operated in complex and high-risk environments, and many shipping accidents occur in open sea as well as in restricted waters (Akten, Reference Akten2004). As shown by many researchers (for example, Goossens and Glansdorp, Reference Goossens and Glansdorp1998; Akten, Reference Akten2004), collision is the major type of ship accident occurring in sea areas. Hereafter, a ship collision is defined as a situation where a ship struck or was struck by another ship on the water surface (International Maritime Organization (IMO), 2002). Considering the possible catastrophic consequences of a ship collision, it is incumbent upon policy-makers to implement efficient navigational safety strategies with the objectives of reducing the likelihood of serious collision accidents. Considering the limited available resources and budgets, policy-makers have to determine the prioritisation of safety strategies. This can be achieved with the help of a comprehensive understanding of the contributory factors affecting ship collision severity.
To date, many studies have been conducted to analyse fishing vessel accidents. The majority of these studies were focused on the investigation of contributory factors, and their effects on fishing accident probability and consequence (Jin et al., Reference Jin, Kite-Powell and Talley2001; Jin and Thunberg, Reference Jin and Thunberg2005; Perez-Labajos et al., Reference Perez-Labajos, Azofra, Blanco, Achutegui and Gonzalez2006; Reference Perez-Labajos, Blanco, Azofra, Achutegui and Eguia2009; Roberts et al., Reference Roberts, Jaremin and Marlow2010; Jin, Reference Jin2014). There has also been some research regarding the strategies for reducing fishing vessel accident probability and consequences (for example, Mata-Alvarez-Santullano and Souto-Iglesias, Reference Mata-Alvarez-Santullano and Souto-Iglesias2013). It should be pointed out that the results from fishing vessel accident-related studies were only applicable for fishing vessels. There is also some work focusing on crew injuries in container ship accidents (Zheng et al., Reference Zheng, Talley, Jin and Ng2016). Considering all ship types, some researchers have investigated the relationship between contributory factors and ship accident risk (Akten, Reference Akten2004; Ozsoysal and Ozsoysal, Reference Ozsoysal and Ozsoysal2006; Birpinar et al., Reference Birpinar, Talu and Gonencgil2009; Aydogdu et al., Reference Aydogdu, Yurtoren, Park and Park2012). Nevertheless, data sources used for analysis were for specific water areas. The results and findings may not be the same for other areas.
Situated in the southeast coastal region of China, Fujian Province is an important advanced manufacturing industry and ocean development base. It also plays a leading role in China's opening-up to the world, especially in economic and trade exchanges between the Chinese Mainland and Taiwan. Shipping safety in the Fujian sea area may affect the regional economy. On occasion, there may be extreme weather (for example, typhoon, heavy rain, fog) and navigational hazards in this sea area, which might result in serious navigational accidents. Therefore, there is a critical need to evaluate the effects of influencing factors on collision severity prior to developing efficient navigation safety enhancement strategies for this water area. The objective of this study is to explore the contributory factors influencing ship collision severity in Fujian sea areas using ordered probit techniques.
2. LITERATURE REVIEW
A number of methods and applications for maritime transportation risk analysis have been published (Hassel et al., Reference Hassel, Asbjørnslett and Hole2011; Mullai and Paulsson, Reference Mullai and Paulsson2011; Zhang et al., Reference Zhang, Yan, Yang, Wall and Wang2013; Goerlandt and Montewka, Reference Goerlandt and Montewka2015; Mazaheri et al., Reference Mazaheri, Montewka, Kotilainen, Sormunen and Kujala2015; Reference Mazaheri, Montewka and Kujala2016; Wróbel et al., Reference Wróbel, Montewka and Kujala2017). Many researchers (Jin et al., Reference Jin, Kite-Powell and Talley2001; Jin and Thunberg, Reference Jin and Thunberg2005; Perez-Labajos et al., Reference Perez-Labajos, Azofra, Blanco, Achutegui and Gonzalez2006; Roberts et al., Reference Roberts, Jaremin and Marlow2010) have focused their attentions on fishing vessel accidents. For example, Jin et al. (Reference Jin, Kite-Powell and Talley2001) examined the determinants of total losses and numbers of fatal and non-fatal crew injuries resulting from commercial fishing vessel accidents. It was found that the probability of a total loss of the vessel was the highest for a capsizing, followed by a sinking accident. In addition, fire/explosions and capsizings were expected to incur the greatest number of crew fatalities. Some researchers also examined ship accidents involving tankers (Eliopoulou and Papanikolaou, Reference Eliopoulou and Papanikolaou2007; Sormunen et al., Reference Sormunen, Ehlers and Kujala2013; Reference Sormunen, Goerlandt, Hakkinen, Posti, Hanninen, Montewka, Stahlberg and Kujala2014; Reference Sormunen, Castrén, Romanoff and Kujala2016), passenger ships (Talley et al., Reference Talley, Jin and Kite-Powell2006), ferries (Kim et al., Reference Kim, Nazir and Øvergård2016) and cellular type containerships (Eliopoulou et al., Reference Eliopoulou, Hamann, Papanikolaou and Golyshev2013).
It should be pointed out that these studies only focused on a specific ship type. In other words, they may not provide information regarding the effects of ship type on shipping accident risk. Many other studies have been conducted to investigate the relationship between the contributory factors and shipping accident risks considering all ship types (Hänninen and Kujala, Reference Hänninen and Kujala2012; Hänninen et al., Reference Hänninen, Mazaheri, Kujala, Montewka, Laaksonen, Salmiovirta and Klang2014a; Reference Hänninen, Banda and Kujala2014b). For example, some researchers (Akten, Reference Akten2004; Ozsoysal and Ozsoysal, Reference Ozsoysal and Ozsoysal2006; Birpinar et al., Reference Birpinar, Talu and Gonencgil2009; Aydogdu et al., Reference Aydogdu, Yurtoren, Park and Park2012) analysed shipping accidents and proposed navigation safety enhancement strategies for the Istanbul Strait. Debnath and Chin (Reference Debnath and Chin2010) explored the factors influencing shipping collision risks in Singapore Port waters. Weng et al. (Reference Weng, Meng and Qu2012) examined the effects of time and traffic direction on shipping accident frequency in the Singapore Strait. Hänninen et al. (Reference Hänninen, Mazaheri, Kujala, Montewka, Laaksonen, Salmiovirta and Klang2014a) presented an expert-knowledge-based method to examine how the deployment of an enhanced navigation support information navigation service would affect ship collisions and groundings in the Gulf of Finland.
Nevertheless, there are three limitations among these studies. Firstly, studies (Weng et al., Reference Weng, Meng and Qu2012, Hänninen et al., Reference Hänninen, Mazaheri, Kujala, Montewka, Laaksonen, Salmiovirta and Klang2014a) have not investigated the effects of influencing factors on shipping accident severity. Secondly, these studies were based on specific water areas (for example, the Singapore Strait). The results and findings from these studies may not be applicable for other sea areas. Although the Fujian sea area is an important channel for international trade, few efforts have been made to examine ship accident severity and their influencing factors. Thirdly, there is only a limited amount of work focusing on the effects of human factors on shipping accident risks (for example, Martins and Maturana, Reference Martins and Maturana2010; Montewka et al., Reference Montewka, Goerlandt, Innes-Jones, Owen, Hifi and Puisa2017).
In general, parametric and non-parametric methods can be applied to examine the relationship between shipping accident risk (probability/consequence) and influencing factors. However, non-parametric methods such as the Bayesian network model (Zhang et al., Reference Zhang, Yan, Yang, Wall and Wang2013; Hänninen et al., Reference Hänninen, Banda and Kujala2014b) have difficulty in conducting elasticity analysis, which is a useful tool for maritime authorities in establishing priorities for navigation safety enhancement strategies. Unlike non-parametric methods, multinomial logit and probit models are able to investigate the marginal effects of influencing factors on accident severity (Tay et al., Reference Tay, Choi, Kattan and Khan2011). In order to completely remove the limitations of an assumption of independence from irrelevant alternatives in multinomial logit models, some researchers also proposed mixed logit models for the analysis of accident risk and its influencing factors (Kim et al., Reference Kim, Ulfarsson, Kim and Shankar2012). In addition, the ordered probit technique has been considered as an effective method for the analysis of traffic safety considering the ordinality of accident injury levels (Quddus et al., Reference Quddus, Noland and Chin2002; Debnath and Chin, Reference Debnath and Chin2009; Lemp et al., Reference Lemp, Kockelman and Unnikrishnan2010; Jin, Reference Jin2014). It should be pointed out that the majority of the above-mentioned ordered probit models were mainly concerned with road traffic safety. However, ship collisions may have catastrophic consequences, especially where ships carrying dangerous goods (for example, oil tankers, chemical/Liquid Natural Gas (LNG)/Liquid Petroleum Gas (LPG) ships) are also involved in the accident. There are not many published articles related to ship collisions.
3. MODEL FORMULATION
Ordered response models recognise the indexed nature of various response variables. In this study, the levels of ship collision severity are the ordered response. Underlying the indexing in such models is a latent but continuous descriptor of the response. In an ordered probit model, the random error associated with this continuous descriptor is assumed to follow a normal distribution. In contrast to ordered response models, multinomial logit and probit models neglect the data's ordinality. These models are also associated with undesirable properties such as the independence of irrelevant alternatives or lack of a closed-form likelihood (Greene, Reference Greene2003).
The ordered probit model is formulated as a latent (unobserved) variable framework:
 $$y_i^\ast =x_i \beta +\varepsilon _i; i=1,\ldots,n$$
where  $y_{i}^{\ast}$ is a continuous latent variable measuring the ship collision severity i, x i is a vector of explanatory variables influencing the ship collision severity, β is a vector of coefficients to be estimated and
 $\varepsilon _{i}$ is a random error term, which is assumed to follow a standard normal distribution. Due to the fact that it is difficult to observe the accident severity exactly by using the variable
 $y_{i}^{\ast}$, it is necessary to create an observed and coded discrete variable y i based on the latent variable
 $y_{i}^{\ast} $, which is shown below:
 $$y_i =\left\{ \matrix{ 0 \, {\rm if}\quad -\infty \le y_i^\ast \le \mu_1 {\rm (Less \, serious)} \hfill\cr 1 \, {\rm if}\quad \mu_1 < y_i^\ast \le \mu_2 {\rm (Serious)} \hfill\cr 2 \, {\rm if}\quad \mu_2 < y_i^\ast \le +\infty {\rm (Very \, serious)}\hfill}\right.$$
where μ1 and μ2 are the thresholds (cut-points) to be estimated along with the coefficient vector β.
Therefore, the probability of ship collision i belonging to a specific accident severity can be determined by
 $${\rm Pr}(y_i =0)={\rm Pr}(y_i^\ast \le \mu _1)={\rm Pr}(x_i \beta +\varepsilon _i \le \mu _1)={\rm Pr}(\varepsilon _i \le \mu _1 -x_i \beta)=\Phi (\mu _1 -x_i \beta)$$
 $$\eqalign{ {\rm Pr(}y_i &=1{\rm )}={\rm Pr(}\mu _1 < y_i^\ast \le \mu _2 {\rm )}={\rm Pr(}\varepsilon _i \le \mu _2 -x_i \beta {\rm )}-{\rm Pr(}\varepsilon _i \le \mu _1 -x_i \beta {\rm )} \cr & =\Phi (\mu _2 -x_i \beta {\rm )}-\Phi (\mu _1 -x_i \beta )}$$
 $${\rm Pr(}y_i =2{\rm )}={\rm Pr(}\mu _2 < y_i^\ast {\rm )}=1-\Phi {\rm (}\mu _2 -x_i \beta {\rm )}$$
where Φ(·) stands for the standard normal cumulative distribution function.
It should be pointed out that the coefficient β can interpret the effects of influencing factors on ship collision severity. In general, positive signs indicate a higher collision severity as the value of the associated variables increases while negative signs suggest the converse. The parameter β and thresholds μ1, μ2 can be estimated using the maximum likelihood estimation technique. There are several commercial software packages (for example, STATA −a general purpose statistical software for data) available for estimating the maximum likelihood of the ordered probit model mentioned above.
4. DATA COLLECTION
Ship traffic accident data between 2004 and 2014 were collected from the historical accident database managed by the Fujian Maritime Safety Administration. This database has a detailed record for each collision accident that occurred in the Fujian sea area. Each recorded data element extracted from this database contains three types of information: (i) Accident characteristics; (ii) Environmental characteristics and (iii) Accident cause factors. Accident characteristics include the information regarding accident location (coastal_habour_port area, straits/sea area), the types of ships involved in the accident (cargo_cargo, bulk_bulk, exist_fishing_vessel, exist_oil_ship, involve_big_ship) and the navigational status (underway, moored/docked). Environmental characteristics contain the information regarding visibility (good, poor visibility), strong_wind/wave (yes or no) and time of day (daytime period, night time period), spring season (yes or no). Judgment_error, lookout_failure, opearation_error and machinery_failure are the four accident cause factors. In addition, the collision severity was categorised into three levels in the database: less serious, serious and very serious. According to Ministry of Transport of the People's Republic of China (2014), a collision causing more than one but less than 10 incapacitating injuries or a financial loss between 1 million and 10 million United States dollars is classified as a serious accident. A very serious collision is classified as an accident resulting in more than 10 incapacitating injuries or a financial loss larger than 10 million dollars. A collision accident causing no serious injuries or a financial loss less than 1 million dollars is considered as a less serious accident.
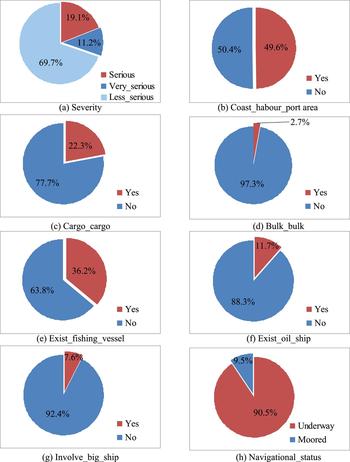
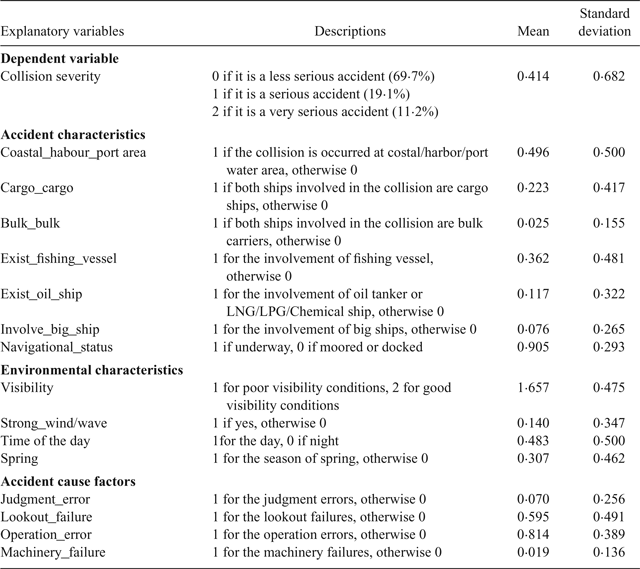
A total of 528 collision accidents were recorded from January 2004 to January 2014. Table 1 provides a detailed summary of statistics of 16 variables described above. Each variable is represented by a binary or an ordinal number. From the collected data, 69·7% of collisions are less serious accidents. Figure 1 graphically shows the distributions of variables related to accident characteristics. From Figure 1(b), it can be clearly seen that about half of the collisions occurred in coastal/harbour/port areas (49·6%). 22·3% of collisions involved two cargo ships while there only 2·5% of collisions involving two bulk carriers, as shown in Figure 1(c) and 1(d). In addition, it can be seen that there is a relatively small proportion of collisions (11·7%) involving oil tankers or LNG/LPG/Chemical ships while fishing vessels are involved in 36·2% of collisions. Figure 1(h) shows that the majority of ship collisions occurred when the ship was underway (90·5%).
Distributions of accident characteristics.

A summary of explanatory variables selected in the ordered probit.

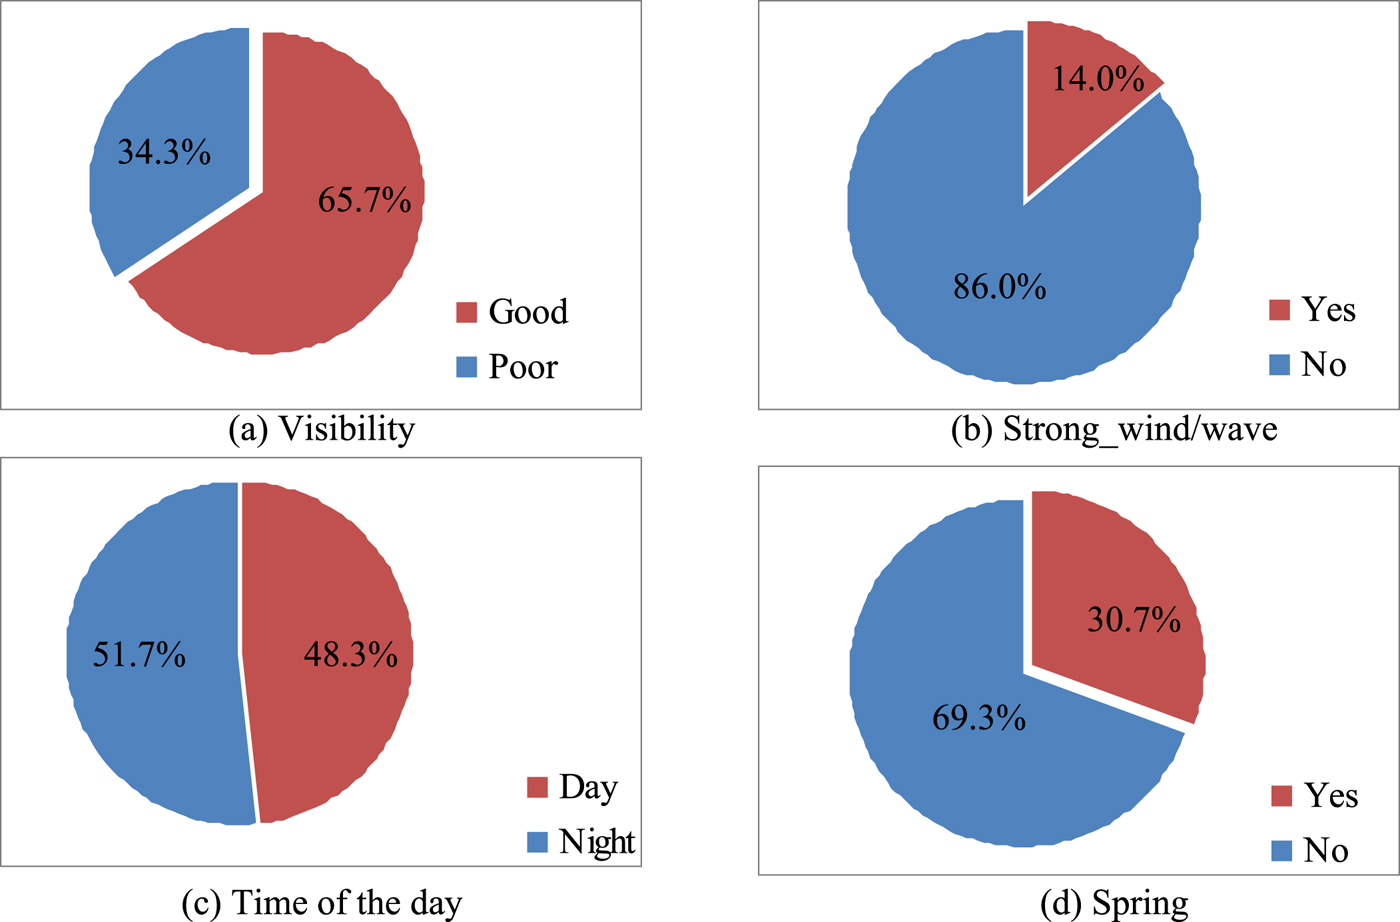
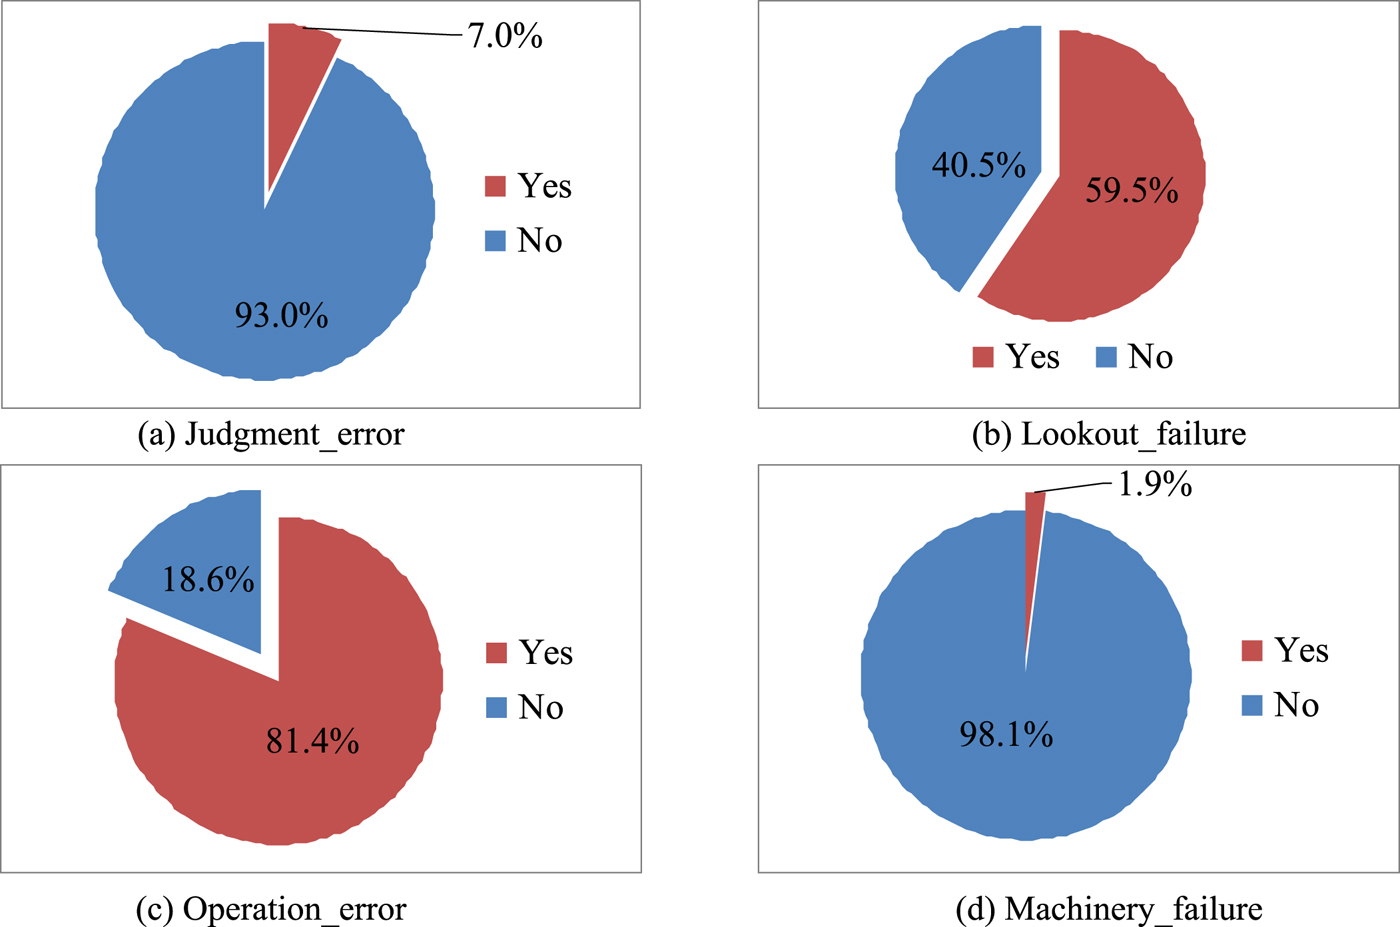
The distributions of environmental characteristic-related variables are given in Figure 2. It can be seen that the proportion of collisions occurring in good visibility conditions is about twice that occurring in poor visibility conditions, as shown in Figure 2(a). Figure 2(b) suggests that the majority of collisions occurred under weather conditions with no strong winds/waves (86·0%). Figure 2(c) indicates that collision accidents are a little more likely to occur at night (51·7%) while about one third of collisions are found to occur during spring time, as shown in Figure 2(d). Figure 3 presents the distributions of accident cause factors. It can be seen from the figure that there is a very small proportion of collisions associated with judgment error (7·0%), operation error (18·6%) and machinery failure (1·9%) while more than half of collisions are found to be associated with lookout failure (59·5%).
Distributions of environmental characteristics.

Distributions of accident cause factors.

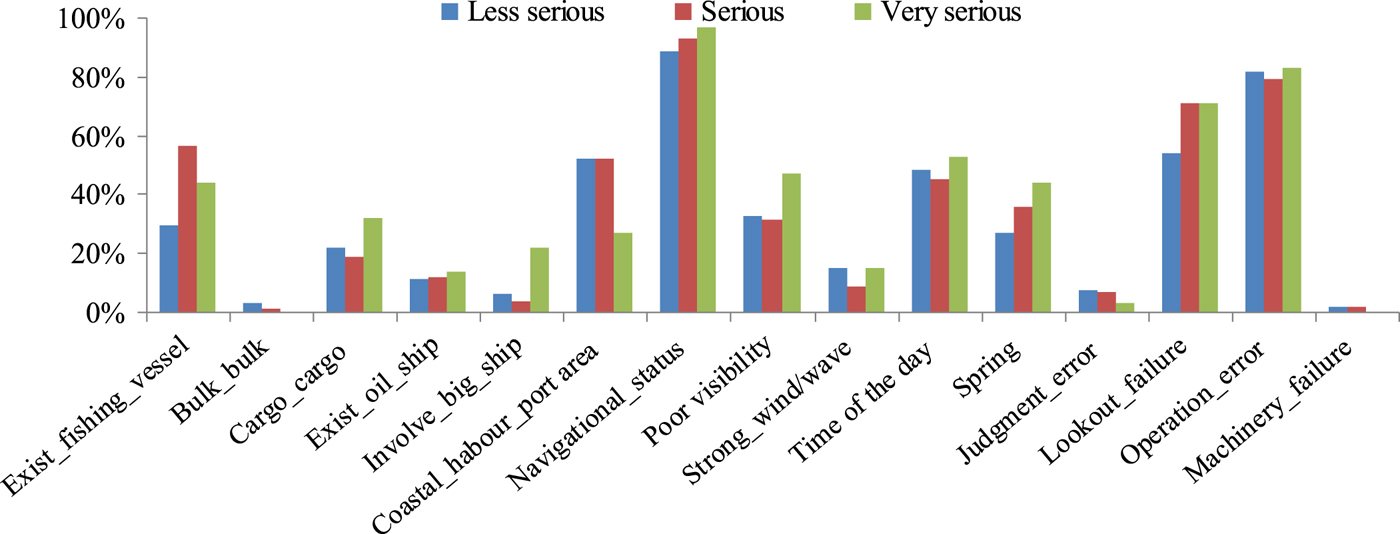
Note that the distribution of ship collisions may vary substantially with different severity levels. For example, Figure 4 shows that there is a smaller proportion of fishing vessels involved in less serious collisions while fishing vessels suffer a high proportion of serious and very serious accidents. A bigger proportion of very serious collisions occur far from coastal/harbour/port areas under poor visibility conditions.
Comparison of ship collision distributions for different severity levels.

5. RESULTS AND DISCUSSIONS
5.1. Model results
The probit procedure in STATA was implemented to estimate the parameters of the ordered probit model using the collected ship collision data. Note that no variables were removed from the model on the basis of low statistical significance because all variables are of interest and expected to have some effect on the collision severity. Therefore, all were maintained in the final model. Three statistics including Loglikelihood, likelihood ratio test statistic LR χ2 and Akaike Information Criteria (AIC) were applied to assess the quality of fit for the estimated model.
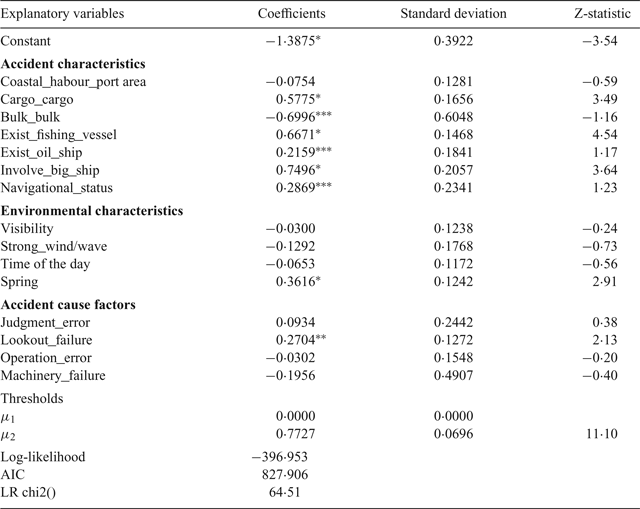
Table 2 provides the estimation results of the ordered probit model for two-ship collisions. The model results show that the collision severity is statistically (at a significance level of 0·05) influenced by five variables including Cargo_cargo, Exist_fishing_vessel, Involve_big_ship, spring and Lookout_failure while the variables of Bulk_bulk, Exist_oil_ship and Navigational_status can affect the collision severity at a significance level of 0·20.
The estimates of the ordered probit model for two-ship collisions.

*p ≤ 0·001; **p ≤ 0·05; ***p ≤ 0·20.
Moreover, the variables including Cargo_cargo, Exist_fishing_vessel, Exist_oil_ship and Involve_big_ship have positive coefficients while the signs of coefficients associated with time of day and visibility are negative. Since the dependent variable increases with collision severity, positive coefficients suggest an increasing likelihood of serious accidents. Therefore, the involvement of two cargo ships, the involvement of fishing vessels, the involvement of oil tankers or LNG/LPG/chemical ships, the involvement of big vessels (e.g., Suezmax ships with a minimum displacement of 100,000 dead weight tons) and lookout failure are associated with serious collisions, while good visibility conditions and the daytime period (i.e., Time of the day=1) are associated with decreased severity levels. Similar to the descriptive statistics mentioned above, the positive sign of coefficient associated with the variable navigational_status implies that the situation when both ships are underway is associated with a higher risk of serious collisions, as compared with the situation when one ship is anchored and the other ship is underway. The estimated coefficient for spring is positive and statistically significant at the 0·001 level, indicating that the season of spring is strongly associated with a higher risk of serious collisions, as compared with other seasons. In addition, it is found that the variable of lookout_failure has a positive coefficient, suggesting that lookout failure could increase the risk of serious collisions.
5.2. Marginal effects
Although the signs of the estimated coefficients for the ordered probit model could provide information on whether changes in given explanatory variables increase or decrease the ship collision severity, they do not provide information on the extent to which the underlying collision severity probabilities change. For instance, there is a critical need to examine the impact of changes in the explanatory variables on the probability of a less serious collision versus the probability of a serious collision.
According to Long and Freese (Reference Long and Freese2006), the marginal probability effects in an ordered probit model can be determined by
 $$\partial\,{\rm Pr} (y_i =0)/\partial x=-\phi (\mu _1 -x\beta )\beta$$
 $$\partial\,{\rm Pr} (y_i =1)/\partial x=[\phi (\mu _1 -x\beta )-\phi (\mu _2-x\beta )]\beta$$
 $$\partial \,{\rm Pr} (y_i =2)/\partial x=\phi (\mu _2 -x\beta )\beta$$
where ϕ (·) is the standard normal density function.
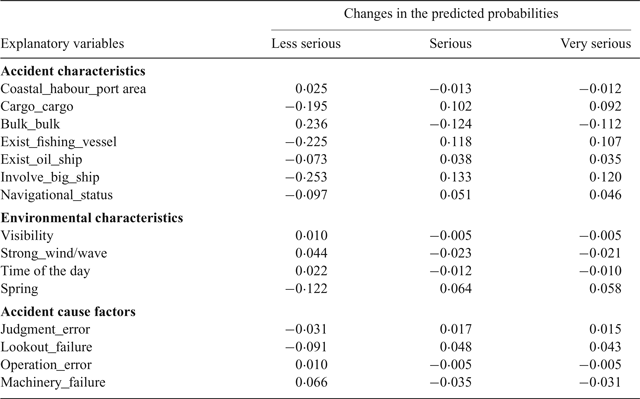
Table 3 provides estimates of the marginal probabilities for the explanatory variables in Table 2. More detailed discussions are shown below.
Marginal effects from the estimated ordered probit model.

5.2.1. Effects of ship types
Table 3 shows that the collision severity is significantly affected by the types of ships involved in collisions. More specifically, if both ships involved in the collision accident are cargo ships, the probability of a less serious accident occurring is lower by 19·5% while there is a 10·2% increase in the probability of a serious accident. The higher probability of a serious accident occurring with the involvement of two cargo ships might be due to the fact that the majority of cargo ships are large vessels and usually carry commercial goods with high economic value. Large financial losses will be incurred when two cargo ships collide.
In contrast to cargo ships, bulk carriers are more likely to be involved in less serious accidents. In general, if a collision happens between two bulk carriers, the probability of a less serious accident occurring will be increased by 23·6% but the probabilities of serious and very serious accidents occurring will be lower by 12·4% and 11·2%, respectively. This result is consistent with reality because bulk carriers often transport raw materials with low economic values. In addition, bulk carriers usually sail at slower speeds than cargo ships. With a lower sailing speed, it is clear that collision severity level could be lower as well.
One important finding is that the severity levels will be increased when fishing vessels are involved in collisions. It can be seen from Table 3 that the probability of very serious accidents occurring is 10·7% higher for collisions involving fishing vessels. This result may be affected by the fact that fishing vessels do not have to be equipped with the Automatic Identification System (AIS) and thus may not be so “visible” to other ships (International Regulations for Preventing Collisions at sea, 1972). It is clear that poor navigation behaviour by fishing vessels could increase the risk of serious collisions.
As expected, the involvement of oil tankers or LNG/LPG/chemical ships is associated with higher probabilities of serious and very serious accidents. Moreover, the involvement of oil tankers or LNG/LPG/chemical ships could increase the probability of a serious accident by 3·8% and a very serious accident by 3·5%. This suggests that there is a critical need to ensure an appropriate and effective watch is kept when a ship is carrying oils or other hazardous cargos in Fujian sea areas. As evidenced by many researchers (for example, Weng and Yang, Reference Weng and Yang2015; Weng et al., Reference Weng, Ge and Han2016), the probability of a serious/very serious accident is expected to be greater when a large ship is also involved in a collision. More specifically, the probability of a less serious accident decreases by 25·3% and that of a very serious accident increases by 12·0% with the involvement of large vessels.
5.2.2. Effects of operational conditions
Consistent with the findings from previous studies (Talley et al., Reference Talley, Jin and Kite-Powell2006; Weng and Yang, Reference Weng and Yang2015), poor visibility conditions are associated with a decreased probability of a less serious accident occurring. It can be seen from Table 3 that the probability of a less serious accident is lower by 1·0% when a collision occurs during a period of poor visibility. Poor visibility can not only increase the occurrence likelihood of human errors by seafarers but also reduce the efficiency of emergency rescue work.
Interestingly, our results show that the presence of strong winds/waves could decrease the seriousness of collisions. It is found that the probability of a serious accident will be reduced by 2·3% under weather conditions with strong winds/waves. This result is reasonable because almost all ships are forewarned to enter sheltered harbours and/or anchorages before the onset of strong winds (e.g., typhoons) in Fujian sea areas. These safety measures could greatly reduce ship collision consequences. Similar to previous studies (e.g., Talley et al., Reference Talley, Jin and Kite-Powell2006), it is found that collision severity is also affected by the navigational status. Table 3 shows a marginal effect of 0·051 when the ships are underway, suggesting that underway ships have a 5·1% higher probability of involvement in a serious accident than docked or moored ships.
5.2.3. Effects of accident location and time
As in the study of Jin (Reference Jin2014), the distance to the shore is also found to be a significant factor influencing collision severity in this study. Compared with a ship collision occurring far away from shore, a ship collision occurring near the shore has a 2·5% higher probability of a less serious accident while the corresponding probabilities of serious and very serious accidents are lower by 1·3% and 1·2%, respectively. This result is consistent with expectations because there will be a short response time and a high rescuing efficiency for ship collisions occurring in coastal/harbour/port water areas.
As evidenced by many researchers (for example, Jin et al., Reference Jin, Kite-Powell and Talley2001), the probability of a serious ship accident is expected to be greater when the accident occurs at night. Table 3 shows that the probability of a serious/very serious collisions occurring at night is slightly higher by 2·2% than of those occurring during the daytime period. This result can be explained by the fact that it is more difficult to identify dangerous encounters at night. Officers have to rely on navigational aids such as radar and navigational lights, which makes risk perception and mitigation processes difficult as they are less able to verify the situation visually (Debnath and Chin, Reference Debnath and Chin2009). These results show the necessity of using adequate navigational lights and signals to reduce the likelihood of serious accidents at night or during periods of poor visibility.
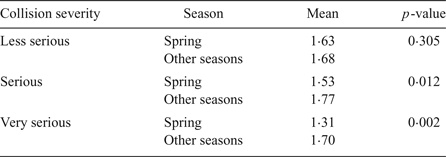
In comparison with the other three seasons, spring appears to give an increase of serious/very serious accident risk. More specifically, Table 3 indicates that the probability of serious or very serious accidents will be higher by 6·4% or 5·8% if the collision occurs in the season of spring. This can be explained by the fact that poor visibility in this season is more likely to occur than in other seasons. For example, one-way Analysis of Variance (ANOVA) test results from Table 4 show that the mean value of visibility in spring is statistically smaller than those in the other three seasons at a level of 0·05 significance for serious and very serious collision accidents. This suggests that serious and very serious accidents in spring are more likely to occur in poor visibility conditions. In order to reduce the likelihood of serious accidents in spring, a vessel should reduce speed when it is not able to determine the sailing course correctly due to poor visibility or weak lights.
Statistical comparison of visibility conditions in different seasons.

5.2.4. Effects of human errors
As expected, Table 3 shows that the collision severity is lower if the ship accident is limited to machinery failure. This might be because ships usually reduce their sailing speed after the machinery failure occurs. In this case, the corresponding accident consequence will be less serious than that for the sudden collision accident where ships may collide with each other at a relatively higher speed. In addition, compared with a sudden ship collision, the event of machinery failure is often associated with more rescue time, which reduces the loss of human life. Many researchers (for example, Karahalios, Reference Karahalios2014) have argued that the most likely cause in a collision accident would be human error on both ships involved. In reality, human error could not only affect the likelihood of ship collision but also influence the collision severity. Our results show that lookout failure is the major type of human error and has the largest impact in increasing serious collision risk, followed by errors of judgment and operation error. More specifically, lookout failure could increase the probability of serious and very serious collision accidents by 4·8% and 4·3%, respectively. However, judgment error only contributes to an increase of 1·7% in the probability of a serious accident or 1·5% in the probability of a very serious accident. Therefore, more attention should be paid to avoiding the occurrence of lookout failures in order to reduce serious accident risk. This suggests that it is necessary to ensure that the lookout gives full attention to keeping a proper look-out and whether he or she undertakes other duties in Fujian sea areas. It is also suggested that additional personnel should be appointed as lookouts at different locations on the ship, especially under adverse weather conditions with restricted visibility.
6. CONCLUSIONS
The main objective of this study was to develop an ordered probit model to investigate relationships between ship collision severity and its influencing factors. The model parameters were estimated based on ten-year ship collision accident data from 2004 to 2014 in Fujian sea areas. The marginal effects of influencing factors on ship collision severity were examined in this study.
According to the model results, it was found that the collision severity is statistically (at a significance level of 0·05) influenced by the involvement of two cargo ships, the involvement of fishing vessels, the involvement of big ships, the season of spring and lookout failure. The involvement of two bulk carriers, the involvement of oil tankers or LNG/LPG/chemical ships and navigational status can affect the collision severity at a significance level of 0·20. Furthermore, the marginal effect results indicate that the involvement of big ships has the largest impact in increasing the occurrence probability of serious/very serious accidents, followed by the involvement of fishing vessels and the involvement of two cargo ships. A higher probability of serious collision is found be associated with the season of spring. Poor visibility and darkness are more likely to cause a high severity level of collision. One finding from this study is that lookout failure plays a decisive role in increasing serious accident risk as compared with other types of human errors. Therefore, more attention should be paid to avoiding lookout failures in order to reduce serious accident risk. For example, the lookout must be able to give full attention to the keeping of a proper look-out and no other duties should be undertaken or assigned which could interfere with that task. In addition, the duties of the lookout and helmsman should be separate and the helmsman should not be considered to be the lookout while steering, except in small ships where an unobstructed all-round view is provided at the steering position and there is no impairment of night vision or other impediment to keeping a proper lookout. It is also suggested that additional personnel should be appointed as lookouts at different locations on the ship in adverse weather conditions with restricted visibility. Consistent with our expectation, ships in coastal/harbour/port water areas have a smaller probability of suffering serious collisions.
FINANCIAL SUPPORT
This study is sponsored by “Shuguang Program” supported by Shanghai Education Development Foundation and Shanghai Municipal Education Commission (Grant No. 16SG41).