INTRODUCTION
The establishment of marine reserves represents a population manipulation experiment on a large spatial scale (Edgar & Barrett Reference Edgar and Barrett1999). By removing fishing and other extractive pressures, populations of previously-harvested species may be allowed to recover to a more natural state. Such recovery has been reported worldwide, with species density, biomass, size and diversity tending to be higher within reserves than outside (Lester et al. Reference Lester, Halpern, Grorud-Colvert, Lubchenco, Ruttenberg, Gaines, Airame and Warner2009). A review of 80 marine protected areas (MPAs) indicated biological responses generally develop within 1–3 years (Halpern & Warner Reference Halpern and Warner2002), but there have also been cases where the response to protection has been slow or even absent, despite the apparent release from fishing pressure (see for example Mayfield et al. Reference Mayfield, Branch and Cockcroft2005). The reasons for the variability in species’ responses to protection are often unclear.
A range of factors may potentially influence the rate of species’ recovery in MPAs. The rate may be species-specific, site-specific, time-period specific and mechanism-specific (Russ et al. Reference Russ, Stockwell and Alcala2005; Molloy et al. Reference Molloy, McLean and Cote2009), with some species potentially taking decades to recover (McClanahan & Graham Reference McClanahan and Graham2005; Edgar et al. Reference Edgar, Barrett and Stuart-Smith2009; Babcock et al. Reference Babcock, Shears, Alcala, Barrett, Edgar, Lafferty, McClanahan and Russ2010). Aspects such as hydrodynamics, habitat quality, predation intensity and competitive interactions vary spatially, including among marine protected areas (see for example Fernandez & Castilla Reference Fernandez and Castilla2000). In turn, these may influence factors that affect population growth (and therefore recovery trajectory), such as the supply of larvae and adult mortality rate. For example, Shears et al. (Reference Shears, Grace, Usmar, Kerr and Babcock2006) demonstrated how allowing some recreational harvest of the lobster Jasus edwardsii in a marine protected area prevented even partial recovery of the population, which provides an indication of how recovery can be affected by increased mortality rate.
The dynamics of populations outside marine protected areas can have a substantial effect on the recovery of populations within protected areas, as can the harvest regime in place prior to protection (Micheli et al. Reference Micheli, Halpern, Botsford and Warner2004; Baskett et al. Reference Baskett, Micheli and Levin2007). Movement of individuals across the MPA boundary, which in turn is affected by factors such as MPA design (Tewfik & Bene Reference Tewfik and Bene2003; Tupper Reference Tupper2007; Freeman et al. Reference Freeman, MacDiarmid and Taylor2009), density-dependent interactions and species’ life history characteristics (see Willis et al. Reference Willis, Millar and Babcock2003), will also influence the recovery of the population within the MPA. Protected area size may be particularly important in influencing the recovery of previously-harvested species, with small reserves often failing to provide adequate protection (Parnell et al. Reference Parnell, Lennert-Cody, Geelan, Stanley and Dayton2005; Claudet et al. Reference Claudet, Osenberg, Benedetti-Cecchi, Domenici, García-Charton, Pérez-Ruzafa, Badalamenti, Bayle-Sempere, Brito, Bulleri, Culioli, Dimech, Falcón, Guala, Milazzo, Sánchez-Meca, Somerfield, Stobart, Vandeperre, Valle and Planes2008). MPAs are thought to be most effective for species with low rates of juvenile and adult movement, with larger MPAs required for species with longer dispersal distances (Botsford et al. Reference Botsford, Micheli and Hastings2003). By encompassing the movement range of a particular species (including aspects such as diel movement and seasonal migrations) within an MPA, the recovery of that species may be enhanced (Holland et al. Reference Holland, Lowe and Wetherbee1996; Chapman & Kramer Reference Chapman and Kramer2000). Where MPAs are intended to provide for fisheries enhancement, smaller areas and the placement of boundaries across suitable habitat may allow the export of individuals to be maximized (Hastings & Botsford Reference Hastings and Botsford2003; Murawski et al. Reference Murawski, Rago and Fogarty2004; Forcada et al. Reference Forcada, Valle, Bonhomme, Criquet, Cadiou, Lenfant and Sanchez-Lizaso2009), but would be at the expense of the MPA's effectiveness at protecting the source population (Freeman et al. Reference Freeman, MacDiarmid and Taylor2009).
When interpreting the recovery trajectories of species within protected areas, the influence of aspects such as adult movement patterns and reserve design are usually better known than the influence of larval supply, which remains unknown for many species. Here, we assess the recovery within New Zealand marine reserves of the spiny lobster Jasus edwardsii (Hutton, 1975) (Palinuridae) and assess some factors that may influence recovery trajectories. This species, which supports important commercial, recreational and customary fisheries, has demonstrated increases in size and abundance in Tasmanian (Edgar & Barrett Reference Edgar and Barrett1999; Barrett et al. Reference Barrett, Buxton and Gardner2009a ) and New Zealand marine reserves (MacDiarmid & Breen Reference MacDiarmid, Breen, Battershill, Schiel, Jones, Creese and MacDiarmid1992; Kelly et al. Reference Kelly, Scott, MacDiarmid and Babcock2000; Davidson et al. Reference Davidson, Villouta, Cole and Barrier2002; Shears et al. Reference Shears, Grace, Usmar, Kerr and Babcock2006; Pande et al. Reference Pande, MacDiarmid, Smith, Davidson, Cole, Freeman, Kelly and Gardner2008). It has long-lived larvae (spending up to 24 months offshore), with settlement patterns displaying significant spatial and temporal variability (Booth et al. Reference Booth, McKenzie, Forman and Stotter2007a ; Chiswell & Booth Reference Chiswell and Booth2008). As adults, movement patterns are similarly variable (MacDiarmid et al. Reference MacDiarmid, Hickey and Maller1991; Kelly & MacDiarmid Reference Kelly and MacDiarmid2003; Kendrick & Bentley Reference Kendrick and Bentley2003; Freeman et al. Reference Freeman, MacDiarmid and Taylor2009), but are within a range where recovery within existing marine reserves could be expected (Barrett et al. Reference Barrett, Buxton and Edgar2009b ). Larval settlement (encompassing the initial puerulus settlement and capture of animals after post-settlement migration; Booth et al. Reference Booth, McKenzie, Forman, Stewart and Stotter2007b ) is correlated with recruitment into the fishery (Booth et al. Reference Booth, McKenzie, Forman, Stewart and Stotter2007b ), but there has been no study of the implications of variable settlement for unfished populations. In this study, we review the recovery trajectories for J. edwardsii within a range of New Zealand marine reserves. We then assess the initial rate of increase in lobster abundance and overall trends in abundance, and consider a number of parameters potentially influencing the observed patterns, including reserve size, length of coastline protected, offshore boundary placement and the initial density of juveniles in the reserve, as a proxy for settlement and subsequent recruitment.
METHODS
Study sites
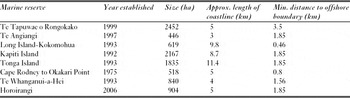
We compiled monitoring data from eight New Zealand coastal no-take marine reserves, five from the North Island and three from the northern end of the South Island (Fig. 1, Table 1). All are in warm-temperate waters and have been placed in the same biogeographic region based on macroalgal presence-absence data (Shears et al. Reference Shears, Smith, Babcock, Duffy and Villouta2008). They support broadly similar biological habitats, including shallow rocky reef dominated by large brown macroalgae (Shears & Babcock Reference Shears and Babcock2007). The reserves ranged in age from five years (Horoirangi Marine Reserve, established in 2006) to 36 years (Cape Rodney to Okakari Point Marine Reserve, established in 1975) and in size from 446 ha (Te Angiangi Marine Reserve) to 2452 ha (Te Tapuwae o Rongokako Marine Reserve).
Location of marine reserves included in this study.

Details relating to the age and design of each marine reserve included in this study. Sources of lobster monitoring data were: Te Tapuwae o Rongokako (Freeman Reference Freeman2008); Te Angiangi (Freeman Reference Freeman2008; Department of Conservation, unpublished data 2007–2009); Long Island-Kokomohua (Davidson et al. Reference Davidson, Abel and Richards2009; R. J. Davidson, unpublished data 2010); Kapiti Island (Battershill et al. Reference Battershill, Murdoch, Grange, Singleton, Arron, Page and Oliver1993; Stewart & MacDiarmid Reference Stewart and MacDiarmid2003); Tonga Island (Davidson et al. Reference Davidson, Villouta, Cole and Barrier2002, Reference Davidson, Richards and Baxter2007; R. J. Davidson, unpublished data 2008–2011); Cape Rodney to Okakari Point (Ayling Reference Ayling1978; MacDiarmid & Breen Reference MacDiarmid, Breen, Battershill, Schiel, Jones, Creese and MacDiarmid1992; Kelly et al. Reference Kelly, Scott, MacDiarmid and Babcock2000; Haggitt & Mead Reference Haggitt and Mead2009a ); Te Whanganui-a-Hei (Kelly Reference Kelly2000; Kelly et al. Reference Kelly, Scott, MacDiarmid and Babcock2000; Haggitt & Mead Reference Haggitt and Mead2009b ); Horoirangi (R. J. Davidson, unpublished data 2006–2011).

Underwater visual census
Underwater visual census methodology was used at all reserves to obtain data on lobster size and abundance. Divers were trained to visually estimate lobster size using an estimate/capture/measure procedure. All surveys were completed during a similar season (summer or summer/autumn) to reduce seasonal variability and take advantage of more workable sea conditions. Wherever possible, divers recorded carapace length (to the nearest 5 mm) and sex of each lobster within each transect (usually 50 × 10 m). For some reserves and in some years, only density was recorded (no size or sex data were recorded). Between 3 and 22 sites were surveyed inside and outside each reserve; between 1 and 8 transects were surveyed at each site. All transects were conducted in rocky reef habitat in less than 30 m depth and were located either randomly or haphazardly.
All diver counts of lobsters were converted to numbers per 500 m2 for analysis. Lobsters that could not be sized were categorized as legal or sublegal based on the relative proportions of measured individuals in those size classes. A legal-sized male has a tail width of at least 54 mm; a female at least 60 mm (equating to carapace lengths of at least 105 mm and 97 mm, respectively; Freeman Reference Freeman2008).
Overall trends in abundance and timing of response
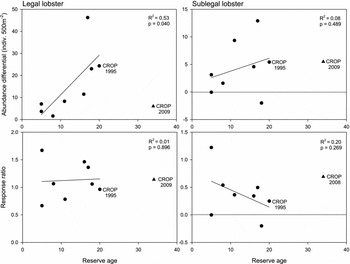
To describe the overall effect of marine reserve protection on lobster densities, we calculated the difference between reserve and non-reserve densities for both legal and sublegal animals over the time series. We then tested for correlation between reserve age and the log reserve:non-reserve ratio using the most recent survey data at each location.
For reserves where a time series of data longer than 10 years existed, we fitted generalized additive models (GAMs) to the density data (using the non-parametric smoother ‘s’) to assess whether reserve age was a significant variable explaining lobster density and then used regression tree analysis (using the function ‘rpart’ in R; R Development Core Team 2007) to determine when significant changes in lobster density occurred. Regression tree analysis was not undertaken for Cape Rodney to Okakari Point Marine Reserve due to significant gaps in the time series.
The initial rates of increase in density, estimated as the slope of the linear regression fitted to the time series of data for each reserve, were compared using analysis of covariance (R Development Core Team 2007). We included only data collected within the first eight years of the reserve's establishment.
Initial rate of increase in density
Influence of reserve design
The initial rate of increase in density (in total number of lobsters per 500 m2 per year, and in the number of legal-sized lobsters per 500 m2 per year) was assessed against reserve size, length of coastline protected and minimum distance to the offshore boundary of the reserve, to establish whether there were any correlations between these variables (Pearson correlations; SPSS 2006).
Influence of recruitment
To provide an estimate of the level of settlement and subsequent recruitment (defined as the addition of individuals to local populations following settlement from the pelagic larval phase to the benthic or demersal early juvenile stage; Caley et al. Reference Caley, Carr, Hixon, Hughes, Jones and Menge1996) at each reserve, we calculated the density of sublegal-sized animals within each reserve at or near the time of the reserve's establishment. We then established whether there was any correlation between this initial density of juveniles and the subsequent rate of increase in density of legal-sized animals and in total density.
RESULTS
Overall trends in abundance and timing of response
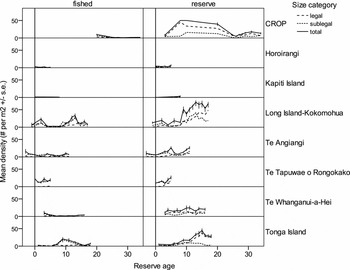
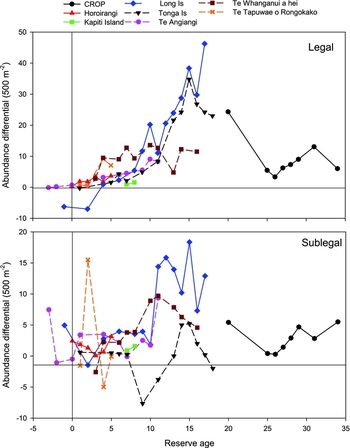
GAMs fitted to the data indicated that reserve age was a significant variable explaining total lobster density (p < 0.01) in all cases, with the exception of Te Tapuwae o Rongokako and Kapiti Island (where there were insufficient data to fit a GAM) and Horoirangi, where a model could not be fitted to the time series data. With the exception of Horoirangi Marine Reserve, there were clear increases in lobster abundance over time within all the reserves we assessed and in the abundance of legal-sized lobsters (Figs 2, 3 and 4). With the exception of Tonga Island, there were also consistent trends over time for the abundance of sublegal-sized lobsters to be higher within marine reserves than outside (Figs 2, 3 and 4).
The mean density of lobsters (all sizes, and divided into legal- and sublegal-size categories) within New Zealand marine reserves and at nearby control (fished) sites in relation to the age of the reserve. Error bars have been omitted from the plots for legal and sublegal size categories for clarity.

Raw difference in the density of legal- and sublegal-sized lobsters between fished and reserve locations for each year monitoring was undertaken at the eight locations. A value greater than zero indicates a higher density within the reserve; a value less than zero indicates a higher density outside the reserve. CROP = Cape Rodney to Okakari Point.

Changes in the density of lobsters within eight no-take marine reserves. Abundance differential is the difference in density between reserve and fished sites; response ratio is the logged ratio of reserve and fished abundance. Data are mean density in the final year of monitoring. For Cape Rodney to Okakari Point Marine Reserve (CROP) we show the data for both 1995 and the final year of monitoring, to demonstrate the influence of the large decline in abundance recorded subsequent to 1995.

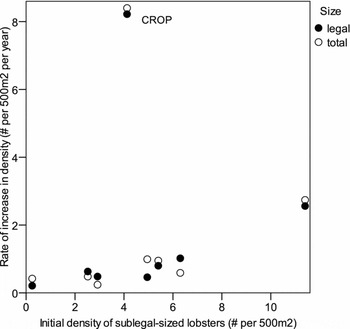
Initial rates of increase in lobster density were highly variable (Fig. 2). The highest initial rate of increase occurred in Cape Rodney to Okakari Point Marine Reserve, which had an average increase of over 8 lobsters per 500m2 per year of protection. Te Tapuwae o Rongokako Marine Reserve had the second highest rate, at 2.7 lobsters per 500m2 per year. The remaining reserves showed only small or no increases in density over this time period (all had a mean rate of less than 1 lobster per 500m2 per year of protection). There were significant differences among the slopes and intercepts of the regressions between reserve age and lobster density over the initial period for the eight marine reserves (total density: analysis of covariance F15,22 = 7.83, p < 0.01; density of legal-sized lobsters: analysis of covariance F15,18 = 34.81, p < 0.01).
North Island north-east coast
At Cape Rodney to Okakari Point Marine Reserve, there was an initial large increase in density which was sustained for around twenty years. At some point between 1995 and 2000 (after between 20 and 25 years of protection), there was a substantial decline in total (and legal-sized) density of lobsters in this reserve, to a density similar to that recorded in 1978, three years after the reserve's establishment (Fig. 2). At Te Whanganui-a-Hei Marine Reserve, total density was variable, but the overall trend was for a slow increase in density with age. Regression tree analysis indicated that a significant change in density occurred after nine years of protection (in 2002).
North Island east coast
At Te Angiangi and Te Tapuwae o Rongokako Marine Reserves, there was an initial rapid increase in total density, followed by a decline then subsequent recovery (Fig. 2). These patterns mirrored the trends in density of sublegal-sized animals, but the density of legal-sized animals showed a continual increase (Fig. 2). At both reserves, mean density displayed a trend of increasing abundance over the last three years of monitoring with no sign of stabilization. At Te Angiangi Marine Reserve, significant changes in density occurred after 2, 4.5, 5.5, 8 and 9.5 years of protection. These changes were all increases in density, with the exception of the decline between 2003 and 2004 (between five and six years of protection).
North Island south-west coast
Too few data were available from Kapiti Island Marine Reserve to fit a GAM or undertake regression tree analysis. The density of lobsters (total density and density of legal-sized animals) remained low over the eight-year period where monitoring was undertaken (Fig. 2) but slightly higher than at the fished sites monitored (Fig. 3).
South Island
At both Tonga Island and Long Island-Kokomohua Marine Reserves there was an initial period of several years when virtually no change in lobster density took place, followed by a rapid increase and stabilization at approximately 30 lobsters per 500 m2 at Tonga Island and at approximately 60 lobsters per 500 m2 at Long Island-Kokomohua (Fig. 2). At Long Island-Kokomohua, this change was driven firstly by a large increase in the density of sublegal-sized animals, which was followed by a large increase in the density of legal-sized animals (Fig. 2). At Tonga Island, a small increase in density of sublegal-sized animals was followed by a large increase in density of legal-sized animals. At both reserves, regression tree analysis indicated that significant increases in density occurred after 8 and 12 years of protection (in 2001 and in 2005). A small but significant decline also occurred at Tonga Island between 2008 and 2009 (age 15 and 16). No significant changes in lobster density were evident at Horoirangi, after five years of protection (Fig. 2).
Initial rate of increase in density
Influence of reserve design
Even when the exceptionally high (and uncertain; see Discussion) rate of increase calculated for Cape Rodney to Okakari Point Marine Reserve was excluded, there were no significant correlations between the rate of increase in lobster density and reserve size (Pearson correlation coefficients p = 0.6 for density of legal-sized and p = 0.6 for all lobsters) or length of coastline protected (p = 0.5 for legal-sized lobsters and p = 0.5 for all lobsters). There was also no significant correlation between the minimum distance to the offshore boundary and the rate of increase in legal-sized lobsters (p = 0.6), or in the rate of increase in total density (p = 0.6).
Influence of recruitment
When data from Cape Rodney to Okakari Point Marine Reserve were excluded, there was a significant positive correlation between the initial density of sublegal-sized lobsters within the reserve at or near the time of establishment with the rate of increase in total density (Pearson correlation coefficient = 0.89, p = 0.007) and in the rate of increase in density of legal-sized lobsters (Pearson correlation coefficient = 0.93, p = 0.002; Fig. 5). When data from Cape Rodney to Okakari Point were included, there were no such correlations (p = 0.67 and p = 0.67 for the rate of increase in total and legal-sized density, respectively).
Relationship between the initial density of juvenile lobsters in each marine reserve and the subsequent rate of increase in recovery of legal-sized and total density of lobsters. CROP = Cape Rodney to Okakari Point Marine Reserve.

DISCUSSION
Long term monitoring has demonstrated that the total abundance of Jasus edwardsii and particularly the abundance of large individuals, have increased significantly within most of the marine reserves we compiled data from. This result is consistent with other reported responses of lobsters to protection (Bertelsen & Matthews Reference Bertelsen and Matthews2001; Goni et al. Reference Goni, Renones and Quetglas2001; Rowe Reference Rowe2002; Wynne & Cote Reference Wynne and Cote2007; Pande et al. Reference Pande, MacDiarmid, Smith, Davidson, Cole, Freeman, Kelly and Gardner2008) and demonstrates that marine reserves in New Zealand have been effective to some degree at minimizing the effects of extractive activities on the size and abundance of harvested species. However, we recorded significant variability among reserves in the timing of response to protection, in the recovery trajectories and we also recorded significant increases in the abundance of juvenile lobsters in marine reserves.
Drivers of lobster recovery in New Zealand marine reserves
We found that the rate of increase in large lobsters within marine reserves and the rate of increase in total abundance were best explained by variation in the density of juvenile lobsters, not the properties of the reserves themselves. Reserves that supported high densities of juvenile lobsters at the time of their establishment tended to have more rapid recovery than reserves that initially had lower densities of juveniles. The distinct variability among recovery trajectories and the recovery trajectories themselves, also suggest that supply-side dynamics (larval settlement and subsequent recruitment) are an important driver of lobster population recovery within New Zealand marine reserves.
While we found that reserve properties, such as size, did not influence the initial recovery rate of lobsters, we consider it likely that offshore boundary placement in particular, would influence aspects of population recovery. All but one marine reserve in our study (Te Tapuwae o Rongokako) had offshore boundaries located less than 2 km from shore. Te Tapuwae o Rongokako coincidentally had the highest initial density of juveniles, which confounded our analysis. Offshore boundary placement may be particularly important if there are no barriers (such as mud) to seasonal inshore-offshore movement associated with the reserve boundaries (Freeman et al. Reference Freeman, MacDiarmid and Taylor2009). At Te Whanganui-a-Hei Marine Reserve, Haggitt and Mead (Reference Haggitt and Mead2009b ) suggested that the decline in abundance of legal-sized animals recorded between 2004 and 2006 reflected a possible emigration across the reserve boundaries, but tagging studies would be required to confirm this. Similarly, targeted fishing of lobster aggregations near the boundary of Cape Rodney to Okakari Point Marine Reserve has been suggested to have contributed to not only a reduction in population growth rate within the reserve, but also a reduction in the number of very large individuals in the reserve population (Kelly et al. Reference Kelly, Scott and MacDiarmid2002; Kelly & MacDiarmid Reference Kelly and MacDiarmid2003). Mature lobsters undertaking offshore migrations as part of their reproductive behaviour crossed the boundary of the marine reserve, but larger lobsters would also have been more susceptible to fishing activity as a result of size-related catchability (Ziegler et al. Reference Ziegler, Johnson, Frusher and Gardner2002). The decline in both legal- and sublegal-sized lobsters we recorded here coincided with this reported change in fishing effort. This experience has prompted the setting of the offshore boundary further from shore in more recently established marine reserves.
Settlement and recruitment as a driver of recovery
Variation in larval settlement is the most likely driver of the variation we report in the density of juvenile lobsters. Unfortunately, insufficient settlement data exist from other studies to enable a meaningful quantitative test of the relationship between settlement and adult abundance at a local level. With the exception of Te Tapuwae o Rongokako Marine Reserve, existing puerulus collector sites are over 100 km from the nearest marine reserve (Booth et al. Reference Booth, McKenzie, Forman, Stewart and Stotter2007a ) and oceanographic features possibly isolate them further from the reserves. However, at the scale of the fishery management area, ‘hotspots’ of settlement (such as the North Island's east coast) qualitatively match reserves demonstrating rapid recovery in lobster abundance. A correlation between juvenile abundances and larval settlement would require (1) density-independent survival of settlers, and (2) minimal post-settlement movement on the spatial scale of reserves. There is evidence that the abundance of juveniles can reflect settlement pulses (Booth et al. Reference Booth, Stotter, Forman and Bradford2001), but factors such as the availability of shelter and habitat quality are also important (Herrnkind & Butler Reference Herrnkind and Butler1997). High larval settlement will therefore not always lead to high juvenile abundance at the site level, due to the influence of post-settlement processes (Frusher et al. Reference Frusher, Prescott, Hobday and Gardner2000).
Periodically high larval settlement events may be a particularly important driver of recovery in marine reserves situated in areas that receive generally low background levels of settlement. Puerulus settlement has been correlated with adult abundance in both Tasmania (Gardner et al. Reference Gardner, Frusher, Kennedy and Cawthorn2001) and New Zealand (Booth et al. Reference Booth, Stotter, Forman and Bradford2001; Booth et al. Reference Booth, McKenzie, Forman and Stotter2007b ) but the implications for unfished populations and for interpreting population recovery have not previously been described. Firstly, sudden changes in lobster density in several reserves coincided with recorded heavy settlement events. The marked increases in density displayed in both Long Island-Kokomohua and Tonga Island Marine Reserves in 2002, eight years after the reserves’ establishment and following the trend of virtually no change in density over the previous years, followed a strong pulse of puerulus settlement in 1991–1992 reported by Booth et al. (Reference Booth, McKenzie, Forman, Stewart and Stotter2007a ). Similarly, trends in juvenile abundance at Te Angiangi and Te Tapuwae o Rongokako Marine Reserves tended to track puerulus settlement patterns (Booth et al. Reference Booth, McKenzie, Forman, Stewart and Stotter2007a ). At some locations, total lobster abundance mirrored the abundance of sublegal-sized animals, suggesting that populations comprised predominantly of sublegal-sized animals may be strongly influenced by low levels of larval settlement. In contrast, unfished populations may be more resilient to fluctuations in factors such as larval supply and recruitment variability that affect population abundance, due to a large ‘residual’ population of legal-sized animals that would be reduced if the area was fished. This resilience may result in more stable populations of targeted species within protected areas than in fished areas (Babcock et al. Reference Babcock, Shears, Alcala, Barrett, Edgar, Lafferty, McClanahan and Russ2010).
The correlation between the rate of increase in lobster density and the initial density of juveniles within that reserve suggests that productive populations may be predisposed to a higher rate of recovery. Marine reserves located in areas of low background larval settlement are dependent on not just the enhanced survival of legal-sized lobsters, but on immigration of adults to allow population recovery. If the density in the surrounding area is low, or there is a low likelihood of adults moving into the reserve (due to proximity, or boundary permeability), the rate of increase in recovery is likely to be low. If there is little movement of adults across the boundary of a reserve, the population is entirely dependent on larval settlement and subsequent recruitment. If the reserve population receives both adult immigrants and larval recruits, then (depending on the rate of these), the rate of recovery within the reserve may be enhanced. An important aspect is that because of the long larval lifespan of this and many other marine species, recruitment and adult abundance are decoupled, with larvae produced from the adult population potentially settling thousands of kilometres from their source (Lipcius et al. Reference Lipcius, Stockhausen and Eggleston2001; Chiswell & Booth Reference Chiswell and Booth2008). If recruitment fails, the local population within a marine reserve could decline to extinction, regardless of how fecund the population is. The patterns of larval settlement, recruitment and cross-boundary movement are therefore important not only for interpreting the recovery trajectories of protected populations, but also for planning protected areas for either conservation or fisheries enhancement purposes.
The very rapid rate of increase in density at Cape Rodney to Okakari Point Marine Reserve is unusual, and considerable uncertainty surrounds this. Firstly, although this reserve was established in 1975, it was not fully enforced until approximately two years later. The density recorded in 1978 (MacDiarmid & Breen Reference MacDiarmid, Breen, Battershill, Schiel, Jones, Creese and MacDiarmid1992) is therefore likely to better reflect the density at the time of the reserve's establishment, rather than the density after three years of protection. Additionally, there was a pulse of recruitment recorded in late 1978 at nearby Tawharanui Marine Reserve and at Mimiwhangata Marine Park (Shears et al. Reference Shears, Grace, Usmar, Kerr and Babcock2006), just after the first biological survey of Cape Rodney to Okakari Point Marine Reserve was undertaken (Ayling Reference Ayling1978). The timing of the first survey at Cape Rodney to Okakari Point Marine Reserve may explain why the initial density of juveniles was unusually low relative to the high rate of increase in density recorded subsequently.
Recovery of juvenile lobsters in marine reserves
In addition to increases in the abundance of legal-sized lobsters following protection, we also recorded significant increases in the abundance of juvenile lobsters (which are not taken in commercial or recreational fisheries). There are four possible explanations for this: enhanced recruitment or settlement within the marine reserves; immigration of sublegal-sized animals into reserves; removal of sublegal-sized animals outside reserves through illegal fishing or customary fishing; and enhanced survivorship of juvenile lobsters within reserves. Spiny lobsters, including J. edwardsii, are highly social animals (Butler et al. Reference Butler, MacDiarmid and Booth1999; MacDiarmid Reference MacDiarmid1994) and the presence of conspecifics may encourage an individual to settle or move into and remain in a reserve where the density of adults is higher (although habitat-related factors such as shelter availability may be more important; Booth Reference Booth2001). The mortality rates of small juveniles may also be lower where they cohabitate with high densities of larger individuals, through enhanced protection from predators. In such cases, densities within marine reserves may increase exponentially rather than linearly (Willis et al. Reference Willis, Millar and Babcock2003). There is some evidence for movement of sublegal-sized animals into New Zealand marine reserves (Kelly & MacDiarmid Reference Kelly and MacDiarmid2003; Freeman Reference Freeman2008) but no evidence that the rate of this movement is higher than the rate of movement out of reserves.
We know of no evidence to suggest that illegal fishing or legal removal of juvenile lobsters is occurring at a level that would explain the distinct differences between reserve and fished areas across the spatial scale we studied. While indirect effects of fishing on condition of sublegal-sized lobsters have been documented (Freeman & MacDiarmid Reference Freeman and MacDiarmid2009) and incidental mortality of sublegal-sized animals is incorporated into lobster stock assessments (see Breen et al. Reference Breen, Haist, Starr and Kendrick2009), fishing-related incidental mortality of sublegal-sized lobsters in New Zealand has not been quantified. However, modelling studies have demonstrated that fishery interactions with spiny lobsters that are not retained by fishing gear can have significant impacts on population abundance (DiNardo et al. Reference DiNardo, DeMartini and Haight2001; Parsons & Eggleston Reference Parsons and Eggleston2007).
CONCLUSIONS
Lobster populations demonstrated significant variability in their responses to protection in New Zealand marine reserves. While aspects of reserve design, such as size and boundary placement, had no significant influence on the initial recovery rate of lobsters, we found that high densities of juveniles were associated with high recovery rates. In addition, we found that densities of juvenile lobsters, along with densities of legal-sized lobsters, were usually enhanced within marine reserves relative to fished locations. Further studies of adult movement patterns and of puerulus settlement, recruitment and juvenile mortality rates in and around marine reserves, are required to better understand the enhanced density of juvenile lobsters and the link between the supply of juveniles and population recovery within New Zealand marine reserves.
ACKNOWLEDGEMENTS
We thank all those who assisted with research and monitoring in the marine reserves in our study, including Department of Conservation staff, contractors, students and volunteers. We thank Eduardo Villouta for his useful comments on our paper, Steven Lau for drafting Figure 1 and Trevor Willis for his invitation to submit this paper. We also thank the anonymous reviewers, whose constructive comments improved this paper.