INTRODUCTION
Gastro-intestinal nematode (GIN) parasites of livestock are a significant threat to small ruminant-based livestock industries world wide, and resistance to anthelmintic drugs exhibited by these parasites is an emerging threat which will impair the future provision of protein and fibre to humans through livestock production. In Australia, the main nematodes causing production loss are Teladorsagia circumcincta, Trichostrongylus spp. and Haemonchus contortus. Drug resistance against all major classes of drugs commercially available, except the organophosphate naphthalophos, has been recorded in Australia for H. contortus, T. circumcincta and Trichostrongylus spp. (Le Jambre et al. Reference Le Jambre, Southcott and Dash1976, Reference Le Jambre, Martin and Webb1979a, Reference Le Jambre, Gill, Lenane and Lacey1995, Reference Le Jambre, Geoghegan and Lyndal-Murphy2005; Webb et al. Reference Webb, McCully, Clark, Greentree and Honey1979; Edwards and Chaneet, Reference Edwards and Chaneet1980; Green et al. Reference Green, Forsyth, Rowan and Payne1981; Rolfe, Reference Rolfe, Boray, Fitzgibbon, Parsons, Kemsley and Sangster1990; Sangster and Bjorn, Reference Sangster and Bjorn1995; Dobson et al. Reference Dobson, Besier, Barnes, Love, Vizard, Bell and Le Jambre2001; Kotze et al. Reference Kotze, Dobson, Tyrrell and Stein2002; Besier and Love, Reference Besier and Love2003). The amino-acetonitrile derivative monepantel and the cyclo-octadepsipeptide emodepside are not yet widely available for use in Australia, and their use in livestock is currently limited worldwide. It is expected that parasites will evolve resistance against these new compounds eventually (Geary et al. Reference Geary, Sangster and Thompson1999). Therefore, a method for identifying field-derived anthelmintic resistance alleles will likely be needed for the longer future, as it is now.
A H. contortus field isolate from the North West slopes of NSW, Australia (Wallangra2003) has shown resistance against multiple classes of drugs, but is marginally resistant to the long-acting macrocyclic lactone (ML) drug moxidectin (Love et al. Reference Love, Neilson, Biddle and McKinnon2003). A number of investigations have studied derivatives of this isolate attempting to demonstrate the involvement of candidate genes in resistance to benzimidazole drugs and macrocyclic lactone drugs (for example Prichard and Roulet, Reference Prichard and Roulet2007). An earlier isolate from the same location is also available (Wallangra1984), and this has also been used to show allele frequency changes over time for selected genes (Prichard and Roulet, Reference Prichard and Roulet2007). The McMaster laboratory strain of H. contortus (McMaster1931) has been used for many years as a reference population for drug studies and other parasitological work. It is susceptible to all classes of anthelmintic drugs currently in use, including the benzimidazoles, levamisole, closantel, naphthalophos, and both long and short-acting macrocyclic lactones.
To investigate DNA-level population changes in response to selection with anthelmintic drugs, we have produced crosses between McMaster1931 and Wallangra2003, aiming to map resistance loci using linked neutral markers. The rationale behind this strategy has been described in some detail elsewhere (Gilleard and Beech, Reference Gilleard and Beech2007). The F2 generation was subjected to drug selection producing 5 different populations, and a non-selected F2 generation was also produced. We present here data for 6 amplicon length polymorphism (ALP) loci showing genetic differences between the selected F2 populations and the unselected F2 population. For each drug used we asked whether there are significant associations between marker genotypes and drug resistance, and further, whether the resistance influenced by the route of inheritance of drug resistance through male or female grandparents.
MATERIALS AND METHODS
Parasite isolates
The drug-susceptible H. contortus McMaster1931 (Albers and Burgess, Reference Albers and Burgess1988) isolate and the multi-drug resistant H. contortus isolate Wallangra2003 (Love et al. Reference Love, Neilson, Biddle and McKinnon2003) were used in this study to produce F1 and subsequent F2 generations of nematodes; throughout this paper we refer to these parental isolates as P0McMaster1931 and P0Wallangra2003. The properties and origin of these parental isolates are discussed in Hunt et al. (Reference Hunt, Knox, Le Jambre, McNally and Anderson2008) and quoted references therein. The P0Wallangra2003 isolate displays resistance against benzimidazoles, levamisole, closantel and the macrocyclic lactones ivermectin and moxidectin (Love et al. Reference Love, Neilson, Biddle and McKinnon2003). We have named the F2 generations which have been selected in vivo with anthelmintic drugs according to the following scheme: F2ABZ – Selection with albendazole, F2CLO – Selection with closantel, F2IVM – Selection with ivermectin, F2LEV – Selection with levamisole, F2MOX – Selection with moxidectin, F2UNS – No drug selection.
These parental and F2 generations were examined alongside 4 field isolates to assess whether the level of heterozygosity of our ALP markers was within Hardy Weinberg Equilibrium (HWE) (as described below). The additional field isolates were:
Wallangra1984 – 18 years prior to the isolation of Wallangra2003, this isolate was obtained from the same farming enterprise and closantel resistance was evident at that time (Rolfe et al. Reference Rolfe, Boray, Fitzgibbon, Parsons, Kemsley and Sangster1990). The isolate might be regarded as ancestral to Wallangra2003; however, extensive migration facilitated by stock movement cannot be excluded as a factor that affected the population over the intervening period.
MountBarker2006 – This isolate originated from the Western Australian Department of Agriculture and Fisheries field station in 2006, it has uncharacterized drug resistance status. Nematodes used in the study were from a faecal culture undertaken with animals infected at pasture on the field station, and used to infect sheep in the animal house at the CSIRO facility in Armidale. The abomasal contents of the sheep were frozen after euthanasia and worms separated from thawed contents and DNA extracted within a year.
Cannawigara2005 – This isolate originated from near the South Australian town of Cannawigara in 2005, it has uncharacterized drug resistance status, see Hunt et al. (Reference Hunt, Knox, Le Jambre, McNally and Anderson2008).
GoldCoast2004 – this isolate displays resistance to benzimidazoles and both short and long-acting macrocyclic lactones (for example ivermectin, IVM, and moxidectin, MOX, respectively) see (Le Jambre et al. Reference Le Jambre, Geoghegan and Lyndal-Murphy2005). A derivative of this isolate, highly selected for MOX resistance is resistant to albendazole (ABZ) and IVM, but not closantel (CLO) or levamisole (LEV) (Le Jambre, unpublished observations).
Crosses and efficacy trials
Two Merino wethers were surgically fitted with abomasal canulae to enable access to the abomasum. They were used for previous infections with drug-susceptible H. contortus, but these were removed by anthelmintic treatment and this was confirmed by faecal egg count 14 days later. The animals were then kept parasite free until the implantation of nematodes from the experimental cross.
Four nematode-donor Merino sheep were also prepared for infection with the parental strains by simultaneously treating with 3·6 mg/kg albendazole combined with 8·25 mg/kg levamisole hydrochloride (Rotate; Novartis Animal Health Australasia Ltd), 0·2 mg/kg abamectin with 3·75 mg/kg praziquantel (First Mectin drench; Virbac Australia Pty Ltd) and 37·5 mg/kg naphthalophos (Rametin; Bayer Australia Ltd) to remove all nematode parasites and moved to individual pens and fed 900 g/day pelleted feed ration. After 14 days of acclimatization to animal house conditions, and allowing for anthelmintic drugs to be cleared, a faecal sample was taken from each animal and faecal worm egg counts (FWEC) conducted to confirm the sheep were worm free. Two animals were given 10 000 third-stage larvae (L3) from McMaster1931, and another 2 animals were administered 10 000 L3 from Wallangra2003.
On the 15th day following infection of the donor sheep, these animals were euthanased and the pre-adult worms removed into phosphate-buffered saline (pH 6·5) supplemented with 10 mg/ml glucose and 0·1% agar, pre-warmed and maintained at 37°C. Fifty male Wallangra2003 and 50 female McMaster1931 were selected using a dissecting microscope and transferred into the abomasum of 1 cannulated recipient (mating type 1), and the other cannulated sheep received 50 male McMaster1931 and 50 female Wallangra2003 (mating type 2). The reciprocal crosses were undertaken to test for X-linkage of drug resistance genes; the dosage of X-linked drug resistance genes transmitted to progeny should be twice as high in mating type 2 compared to mating type 1. The transfer procedure has been described in detail elsewhere (Le Jambre, Reference Le Jambre1979b).
Faeces was collected from the abomasal cannulates from 7 days after transfer and L3 cultured, these larvae were the F1 progeny of the cross. F1 larvae were used to infect 4 worm-free sheep prepared as above for the nematode donors. These sheep contained adult F1 worms once the infections were established, and the progeny of these worms were the F2 generation. Faeces containing eggs of the F2 generation was collected from these sheep, and cultured to produce sufficient L3 for the drug selection experiment. Throughout this procedure, the 2 crosses (mating types 1 and 2) were kept separate so that drug selection could take place using both populations and potential effects of mating type identified.
Sixty-five Merino sheep, approximately 1 year of age (live weight mean 25·7 kg) were prepared as above with anthelmintic drugs and following acclimatization to animal house conditions, were infected with F2 L3 from the crosses between P0McMaster1931 and P0Wallangra2003. Thirty-three randomly selected sheep were administered 10 000 L3 from the F2 generation of mating type 2 and thirty-two animals received 10 000 L3 from the F2 generation of mating type 1.
FWECs were undertaken at days 30 and 36 following infection with F2 larvae. Following faecal collection on day 36, animals were divided into groups of between 5 and 8 sheep containing worms from either of the 2 crosses. Groups of each cross type were administered with 1 of 6 treatments: F2CLO group – closantel at (7·5 mg/kg live weight); F2MOX group – moxidectin (200 μg/kg live weight); F2IVM group – ivermectin (200 μg /kg live weight); F2LEV group – levamisole-HCl (8 mg/kg live weight); F2ABZ group – albendazole (3·8 mg/kg live weight); or F2UNS group – no anthelmintic.
FWEC was undertaken 7 and 14 days following anthelmintic administration (p.t.), and animals were euthanased at between 21 and 25 days p.t. Prior to euthanasia, faecal material was collected to culture larvae from each group (F3 generation), and these were live cryopreserved for future use. Post-mortem, the abomasum from each animal was removed, and washed, keeping the washed contents for further work. For sheep with FWEC below 1000 eggs/g, the entire contents was concentrated to 400 ml and kept, for animals with higher FWEC, 3 subsamples of 40 ml (FWEC 1100–10 000 eggs/g ) or 3 subsamples of 20 ml (FWEC>10 000 eggs/g) were kept. These samples of abomasal contents were kept until needed at −20°C. Frozen samples were thawed and nematodes counted for determination of worm burden, then worms were either retained in 100% ethanol for later DNA extraction or stored at 4°C and used within 48 h for DNA extraction.
Drug efficacy was calculated in 3 ways. Using either the worm count data, corrected for subsample volume, or the FWEC measured at 2 time-points (day 7 and day 14) following drug administration. In each case the percentage difference between the count from the unselected group, relative to the drug-selected group was calculated.
These animal experiments were approved by, and performed under guidelines set out by, the F.D. McMaster Animal Ethics Committee, CSIRO Livestock Industries (Animal ethics approval number 06/34).
In vitro drug bioassays – egg hatch assay
Sheep faeces recovered from sheep housed in the animal facility at the F.D. McMaster Laboratory was sealed into air-tight bags and sent by courier to Queensland Biosciences Precinct laboratory at St Lucia, Brisbane. Nematode eggs were recovered from the faeces by passage through a series of fine sieves (250 μm and 75 μm) followed by centrifugation in a stepwise sucrose gradient (10, 25 and 40% sucrose). The eggs were recovered from the interface between the 10 and 25% sucrose layers, and washed over a 25 μm sieve with water to remove residual sucrose. They were diluted in water to a concentration of approximately 50–60 eggs per 30 μl, and used immediately for egg hatch assays.
Assays were conducted in a microtitre plate format as described previously (Lacey et al. Reference Lacey, Redwin, Gill, DeMargheriti, Waller, Boray, Martin and Roush1990). Aliquots (2 μl) of separate 2-fold serial dilutions of thiabendazole (in DMSO) were deposited into wells of the plate. Control wells received DMSO only. Agar (200 μl of 2% w/v) was added to each well of the plate. After this had solidified, 30 μl of nematode egg solution was aliquotted into each well. For each assay, triplicate wells were examined at each concentration. The plates were incubated for 48 h at 27°C. After this time, the numbers of first-stage larvae (L1) present in each drug well were counted, while both L1 and eggs were counted in control wells. The percentage egg hatch at each drug concentration was estimated by comparing the numbers of L1 with the total number of eggs and larvae in control wells.
In vitro drug bioassays – migration assay
L3 were collected after migrating from faecal cultures, and separated from faecal debris by passage through a 20 μm filter into water. They were stored at 10°C, and used for migration assays within 3 weeks of collection.
The effect of eprinomectin on the ability of the larvae to migrate through an agar layer and a 20 micron filter was assessed using the method described by Kotze et al. (Reference Kotze, Le Jambre and O'Grady2006) (a sample of eprinomectin was obtained from a confidential, commercial source; the chemical composition was 88·3% eprinomectin-B1a, and 4·2% -Blb). Larvae were exposed to drug in 96-well microtitre plates. Stock drug solutions (10 mg/ml in DMSO) were serially diluted by 2-fold, and aliquots of each dilution (0·5 μl) were added to assay plate wells, followed by 20 μl of water. Control wells received water only. Worms were diluted to a concentration of approximately 2–2·5/μl, amphotericin B (250 μg/ml) was added at a rate of 100 μl/ml, and penicillin/streptomycin (penicillin 10 000 U/ml, streptomycin 10 000 μg/ml) added at 10 μl/ml. Aliquots of this worm solution (30 μl, equivalent to approximately 55–65 larvae) were added to the assay plate wells. Plates were incubated for 24 h at 27°C. The worms were then transferred to agar/filter plates (75 μl of 0·125% (w/v) agar in each well of multiscreen-mesh 20 μm filter plates; Millipore, Australia). The agar/filter plates were placed under a light at 27°C. After 24 h, the filter plate was removed, and all worms that had migrated through the agar/filter matrix into the lower collection wells were counted.
ALP marker genotyping
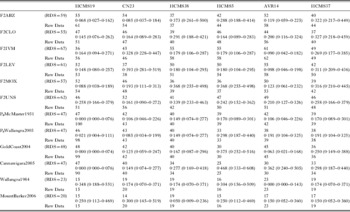
DNA was extracted from H. contortus males and the heads of females dissected anterior to the ovary, using Chelex™ resin as described previously (Hunt et al. Reference Hunt, Knox, Le Jambre, McNally and Anderson2008). PCR was used to attempt DNA amplification from 72 individual nematodes from each drug selected and the unselected F2 populations and 48 individuals from each of the parental isolates. For the locus HCMS19, 100 PCRs were undertaken for P0McMaster1931, P0Wallangra2003, and some of the other isolates, and these data have been described previously (Hunt et al. Reference Hunt, Knox, Le Jambre, McNally and Anderson2008). For PCR of the remaining loci, 48 of the same individuals were chosen at random from the previous study for the populations included in that study. The incidence of putative null homozygotes given in Table 1 is based on these 48 selected individuals only, those for which PCR was not attempted for markers other than HCMS19 were not considered in the analysis. For consideration of single locus data, however, we included all available information for each locus/population combination (‘raw data’ in Table 1). For the F2 populations, equal numbers of male and female nematodes were used, and the nematodes were obtained from 2 separate sheep for each mating type within each anthelmintic selection group (3 sheep for F2LEV mating type 1 and F2MOX mating type 1).
Number of individuals used for genotyping and the incidence of putative null homozygotes

We have called the polymorphic loci assayed amplified length polymorphism (ALP) markers because few of these are simple sequence or microsatellite repeats (SSR), but instead are variable in length because of a number of indels of varying size which are sometimes repetitive elements and sometimes are not. The ALP markers assayed were HCMS5, HCMS19, HCMS37, HCMS38 (Hoekstra et al. Reference Hoekstra, Criado-Fornelio, Fakkeldij, Bergman and Roos1997; Otsen et al. Reference Otsen, Plas, Groeneveld, Roos, Lenstra and Hoekstra2000), CN23 and AVR14 (this study). CN23 is an ALP marker derived from the H. contortus genome sequence (http://www.sanger.ac.uk/cgi-bin/blast/submitblast/h_contortus). CN23 is a complex repeat consisting of CAA/AC/AATC, is amplified using the primers 5′ GTCCCTCCTACCTGAAACG 3′ and 5′GAAACCTACTTGGACACATGC 3′, and the sequence is derived from the genomic supercontig 0056532 (data available 21/08/2008). AVR14 is a fragment of the H. contortus homologue of the avr-14 gene from Caenorhabditis elegans. The 3rd intron and parts of the flanking exonic sequences are amplified using the primers 5′ TTCGTAGTGTTGGCGACCA 3′ and 5′ ATCGAGCCGTCCTTGTGAAT 3′ and the amplicon contains at least 2 indel regions, with multiple length indels observed at one position. AVR14 is located on supercontig 0036066. For both CN23 and AVR14, amplicons were cloned into pGEMt-easy (Promega) and sequenced; sequences for some of the alternative alleles for each locus have been entered into GenBank under the Accession numbers FJ749287, FJ749288, FJ749289, FJ749290, (CN23) and FJ749284, FJ749285, FJ749286, (AVR14). HCMS19, HCMS37 and HCMS38 are found on supercontigs 0059559 0057698 and 0059669, respectively, and no match to supercontigs could be found for HCMS5 by Blastn.
PCR was conducted using fluorescence-labelled primers and the amplicons analysed using capillary gel electrophoresis. Peak fragment lengths were derived from binning software and checked by eye. An assessment of sex linkage was undertaken for each marker, and there was no excess of homozygotes observed in males for any of the 6 loci assessed. An assessment of the proportion of failed PCR amplifications between populations showed that although there were missing data for all loci, the proportion missing was consistent across all populations within data sets for each locus.
Statistical analysis of genotyping data was undertaken using 4 separate procedures to explore the data. This was necessary as there are no accepted procedures for the type of experiment we have conducted. For some analyses where the aim was to consider the various populations across the 6 loci, we removed individuals from the data set where fewer than 3 of the loci amplified by PCR, we call this set of data the reduced data set (RDS). We did this in an attempt to minimize the effects of DNA quality on the analysis. Table 1 shows the number of individuals included for each population in the RDS, and the number included for each locus in analyses where loci were considered separately.
To explore the possible role of non-amplifiable alleles at each locus, we calculated the incidence of PCR failure for each locus in each population and the 95% confidence limit surrounding this percentage, using the RDS (Table 1). The confidence limits reported use the method of Newcombe (Reference Newcombe1998) as incorporated in the confidence interval calculator spreadsheet (freely available at http://vl.academicdirect.ro/). We have described this procedure for inferring the presence of putative null alleles previously (Hunt et al. Reference Hunt, Knox, Le Jambre, McNally and Anderson2008).
We used the RDS genotype data to examine differences between the 2 parental and the 6 F2 populations. We used the program Structure 2·2 (Pritchard et al. Reference Pritchard, Stephens and Donnelly2000) to investigate the number of populations (K) that were the best fit to the data. We used a parameter set with the admixture ancestry model in effect and the prior assumption of allele frequencies correlated among populations, the program was run with 50 000 burnin replicates and 100 000 Markov chain Monte Carlo (MCMC) replicates, and each run was repeated over 5 iterations for each value of K. The data for the 2 parental populations were analysed in a first run, this was repeated with a second dataset containing both the parental and unselected (F2UNS) F2 populations and finally repeated once more with the parental and all F2 populations.
Subsequently, we used the RDS genotype data and Arlequin (Excoffier et al. Reference Excoffier, Laval and Schneider2005) to assess departures from HWE, possible linkage between markers (linkage analysis), heterozygosity and genetic distance between pairs of populations. For this analysis 6 isolates including the parental isolates were used as has been described above. The assessment of HWE and of linkage between markers using the isolates was necessary for assessment of the statistical usefulness of each marker, as the F2 populations are not appropriate for this assessment. In a second analysis we also calculated putative linkage between markers and heterozygosities and departures from HWE in the F2 populations. The analysis of HWE, linkage and putative null alleles conducted, led us to exclude HCMS5 and HCMS37 for the purpose of calculating genetic distances. Based on the other 4 loci, the genetic distance and P values for the significance of distance estimates was calculated in Arlequin using the method of Nei and Li (Reference Nei and Li1979), (in Arlequin, Corrected average pair wise difference (PiXY−(PiX+PiY)/2)). Values were used to construct a phylogenetic network using Splitstree4 (V4.10 – Huson and Bryant, Reference Huson and Bryant2006), the distances were transformed using the NeighbourNet method and variance calculated using Ordinary Least squares, splits transformation was set at Equal Angle and all iteration procedures were run with 1000 steps.
To assess whether markers were associated with resistance to the anthelmintic drugs used, the raw data (see Table 1) were used in a locus specific non-parametric Chi square tests and in allele specific z-tests to compare the allele frequencies for each selected population compared to the F2UNS, P0McMaster1931, P0Wallangra2003 and the predicted outcome of the parental cross (TF2). Calculations were conducted in Microsoft Excel, using established methods, confidence limits for allele frequencies were calculated using the same method as for proportions of putative null homozygotes described above.
RESULTS
Efficacy of drugs against the parental populations and F2 generation
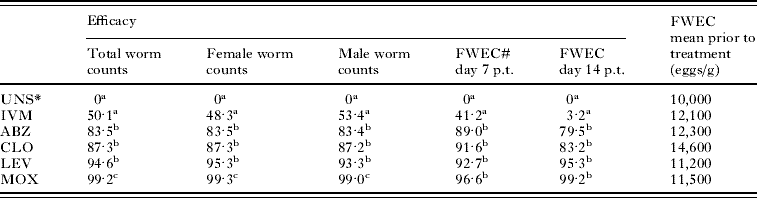
The cross between the resistant P0Wallangra2003 isolate and P0McMaster1931, produced an F2 population displaying resistance to albendazole, ivermectin, levamisole and closantel (Table 2). In contrast, efficacy for the long-acting ML moxidectin (MOX) was greater than 95%. Using either faecal worm egg count (FWEC) or post-mortem worm counts, the efficacy of the short acting ML ivermectin (IVM) in the F2 was significantly lower than that of other drugs, and worm counts and FWEC in the IVM treated F2 group were not significantly lower than for F2UNS. The time post-treatment when FWEC was determined changed the magnitude of efficacy measures, but not the rank of efficacy of the drugs. Albendazole, ivermectin and closantel had a higher apparent efficacy at 7 days post-treatment compared to 14 days, and the apparent efficacy of levamisole and moxidectin was similar between the 2 estimates. For ivermectin, the difference in efficacy between worm count at day 21 pt and FWEC at day 14 p.t. was >40%, whereas this difference was less than 10% for the other anthelmintics.
Efficacy of anthelmintic drugs (%) in vivo against the F2 population of a cross between P0Wallangra2003 and P0McMaster1931
(Efficacies are given with superscripts indicating values which are either not significantly different from one another (superscripts are the same) or where there is a significant difference (superscripts are different, P<0·05). These statistical comparisons are only valid within and not between data columns.)
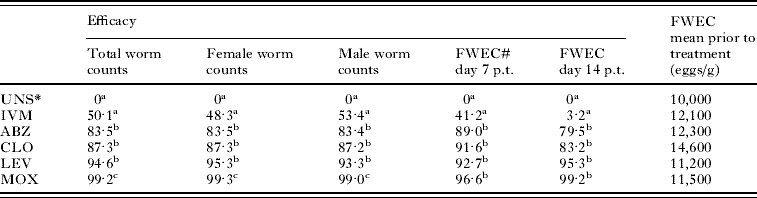
* UNS, unselected (no drug treatment); as all efficacies are reported relative to the unselected or untreated group, figures in this row are 0 values.
# FWEC, faecal worm egg count.
The sensitivity of the parental and F2 populations to benzimidazole and macrocyclic lactone drugs was assessed using in vitro bioassays with free-living life stages. Dose responses are presented in Fig. 1 for thiabendazole in egg hatch assays, and eprinomectin in migration assays. P0McMaster1931 was susceptible to thiabendazole by WAAVP criteria (Coles et al. Reference Coles, Bauer, Borgsteede, Geerts, Klei, Taylor and Waller1992) as the IC50 was below 0·1 μg/ml (0·044 μg/ml, 0·217 μm), while P0Wallangra2003 was resistant (1·76 μg/ml, 8·73 μm). The positions of the F2 dose responses relative to the parental populations differed for the 2 drugs. For eprinomectin, the F2 responses were similar to the resistant parent P0Wallangra2003 (IC50 6·77 and 5·43 μm for F2 mating type 1 and 2 respectively and 9·90 μm for Wallangra2003). On the other hand, responses of the F2 populations to thiabendazole were closer to the susceptible P0McMaster1931 than to P0Wallangra2003 (IC50 0·483 and 0·660 μm for F2 mating type 1 and 2 respectively).
Dose responses of parent and F2 generations to thiabendazole (A) and eprinomectin (B) in egg hatch and migration assays, respectively. Parent generation shown as solid lines, P0McMaster1931 as ▪ and P0Wallangra2003 as •. F2 shown as dashed lines; mating type 1 shown as ▵, mating type 2 as ◊. Each data point represents mean of data pooled from 3 (thiabendazole) or 4 (eprinomectin) separate experiments, each with triplicate assay wells at each drug concentration.

To produce the F1 generation, 2 separate matings used either P0Wallangra2003 or P0McMaster1931 as female parent (mating types 1 and 2 respectively); however, for the in vivo investigation, there were no significant effects of mating type upon drug efficacy in the F2 (results not shown). As shown in Table 2, the efficacy of all drugs in vivo was similar against both male and female nematodes. The 2 F2 populations were also not significantly different to each other in their response to eprinomectin in vitro (overlapping 95% confidence intervals), in agreement with the drug efficacy data described above. In contrast, the F2 from mating type 2 (P0McMaster1931 as female parent) showed a slightly higher IC50 towards thiabendazole than type 1. This indicates a slightly higher resistance for nematodes inheriting resistance alleles from the P0Wallangra2003 male grandparent as compared to the female grandparent. Given the small magnitude of the difference between mating types against thiabendazole in vitro, and the absence of any other significant effects observed for mating type or worm gender, we decided to undertake the following genetic analyses treating the 2 mating types together rather than separately.
Using ALP markers to identify genomic regions of interest for drug resistance – analyses using multiple markers
We had 6 ALP loci available which we used to assess genetic divergence between P0Wallangra2003, P0McMaster1931 and the F2 populations from their cross. It was not possible to genotype the actual P0 individuals or the F1 in this experiment because these nematodes existed inside host animals and could not be removed without compromising our ability to produce enough F2 nematodes for the subsequent in vivo anthelmintic selection experiment. For the same reason, the parental isolates P0Wallangra2003 and P0McMaster1931 were genotyped using a different sample of individuals to those used in the mating experiment. This caused some problems with statistical analysis, as 11 rare alleles were observed in the F2 but not in the parents (across 5 of the ALP loci). Six of these observations were unique in the data set including the only one observed for F2UNS. No instances of F2 alleles absent in the parental data were recorded for HCMS19, where there was approximately double the number of records in the raw data for the parental populations.
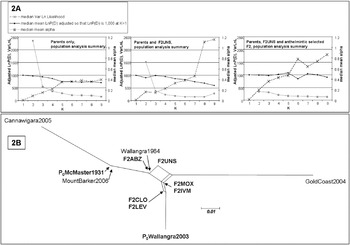
We used Bayesian inference to estimate K, the number of populations into which the data could be divided with maximal likelihood (Fig. 2A). We did this first with the data from the 2 parental populations, and the maximum Ln probability of the data (LnP(D)) was estimated at −1277·66 (mean of 5 iterations) for K=1. This indicated that the 2 parental populations were not easily separated into more than 1 population given the data we generated. We repeated the analysis using genotype data from both parent populations and F2UNS. In this case, maximum LnP(D) was also at K=1 (mean of 5 iterations −2008·5). This was taken as a good confirmation that the F2UNS population was derived from the 2 parental populations as inclusion of data generated from the F2UNS population did not change the result of the analysis. Finally we undertook the analysis including all the genotype data from F2 populations selected with anthelmintics, the parent populations and F2UNS. This time the maximum LnP(D) was obtained at K=5 (LnP(D)=−5480·42), indicating that the addition of anthelmintic-selected subpopulations increased the optimal number of groups the genotype data could be divided into with maximal statistical support.
(A) Summary of results from analysis of genotype data using Structure. The three graphs show results of analysis including only the P0 (left), P0 and F2UNS (middle) and P0 and all F2 populations (right). All data are median values for 5 iterations of the analysis (see Materials and Methods section). Variance of Ln likelihood increases with K, and the Ln likelihood of the data matching K (LnP(D)) has peak values at K=1 for the left and middle graphs, and K=5 for the right graph. Alpha (left vertical axis) declines with increasing K in all the figures. To facilitate visualization, values of LnP(D) have been adjusted upward so that LnP(D)=1000 at K=1 in all graphs. (B) Genetic distance network of relationships between P0Wallangra2003, P0McMaster1931 and F2 populations, with other isolates of Haemonchus contortus from Australia.

Next we wanted to assess all 6 markers to see whether they could be used in an analysis of relatedness between the F2 populations, parental populations and other isolates. A good fit to Hardy Weinberg expectations (HWE) of homozygote:heterozygote ratios and an absence of linkage between loci are required for the type of analysis we intended to undertake. Using the parent populations and additional populations (see Materials and Methods section), it was determined that the observed level of heterozygosity was within Hardy Weinberg Equilibrium (HWE) expectations for all 6 populations for HCMS19 and AVR14 (limit of confidence, α=0·00069 for this analysis). The loci CN23 and HCMS38 were not in HWE for the Cannawigara2005 isolate (P=0·00005 and P=0·00048 respectively); HCMS37 was not in HWE for Wallangra2003 (P=0·0001) and GoldCoast2004 (P=0·00002); and HCMS5 was not in HWE for Wallangra2003 (P=0·00000), GoldCoast2004 (P=0·00000), Cannawigara2005 (P=0·00000) and MountBarker2006 (P=0·00066). These results indicated that HCMS5 and HCMS37 were not well suited for genetic distance estimates. These loci also displayed high rates of putative null allele homozygotes across the isolates and F2 populations (no PCR product when considering only individuals within the RDS – data in Table 1).
We also analysed linkage between markers using a likelihood test (Slatkin and Excoffier, Reference Slatkin and Excoffier1996) and there was predicted linkage between HCMS5 and HCMS38 in the P0McMaster1931, P0Wallangra2003, Wallangra1984 and Cannawigara2005 populations (P=0·0000, 0·0002, 0·0002 and 0·0000 respectively, α=0·00027) and significant only before Bonferroni correction for GoldCoast2004 (P=0·0069) but not for MountBarker2006 (P=0·4147). Linkage between HCMS5 and HCMS38 was supported by the analysis of data from 4 of the 6 F2 samples, and was marginally significant for F2IVM (P=0·0476) and F2LEV (P=0·0003). There was evidence for linkage between HCMS38 and AVR14 (P=0·0001) in the GoldCoast2004 population, but neither this pair of loci nor any other pair other than HCMS38:HCMS5 had a significant prediction of linkage in the isolates or F2 populations at the Bonferroni corrected significance level.
By analysing DNA from both males and the isolated heads of female individuals, we were able to assess the likely X-linkage of any of the 6 markers. None of the markers had an excess of homozygotes in males compared to females (data not shown), and so given the X0 system of sex determination in H. contortus, all 6 markers are determined to be autosomally located.
Considering the results of putative null alleles, linkage and HWE analyses, we conducted an analysis of pairwise genetic distances (Nei and Li, Reference Nei and Li1979) and their significance, excluding HCMS5 and HCMS37. The pairwise distance between P0Wallangra2003 and P0McMaster1931 was 0·0935 (inferred net number of nucleotide differences), and this was a significant result (P=0·00000). We used these genetic distances to construct a network diagram illustrating the relatedness between parental and F2 populations and four other isolates (Fig. 2B). The figure shows that the F2 populations are closely related and positioned between the 2 parental populations as expected. The isolate Wallangra1984 which originates from the same locality as P0Wallangra2003, also grouped with the F2 populations in the diagram, and MountBarker2006 was not separated from McMaster1931. Cannawigara2005 and GoldCoast2004 are clearly separated from each other, the other isolates, and the F2 populations.
Using ALP markers to identify genomic regions of interest for drug resistance – analyses using individual loci
For HCMS19, and CN23 there was no statistically significant departure from HWE for any F2 population. F2CLO data showed departure from HWE for AVR14 (P=0·00036), but as F2UNS was also significant (P=0·00002), this HWE alone is probably not indicative of an effect of this genomic region on selection for closantel resistance. For HCMS38, both F2ABZ and F2MOX genotype data showed departure from HWE (P=0·00035 and P=0·00006 respectively); however, there was only marginal significant divergence from HWE in F2UNS (P=0·00099, and adjusted α=0·00069). Thus there is an indication of selection signatures for albendazole and moxidectin in these populations.
A Chi-square analysis was undertaken for each set of F2 genotype data to test the goodness of fit between the F2 population and the expected mid-point of the parental populations. This was done as an alternative to the HWE analysis to determine whether there was evidence for selection acting on any of the genetic loci under consideration. Hence, only HCMS19, CN23, HCMS38 and AVR14 were considered. For this analysis we used the raw data, and not the RDS, as each locus was considered separately (see Table 1). There was no significant result for any locus by F2 population which was also identified using the HWE method. F2UNS, however, differed significantly from predicted expectations given the parental data for AVR14 (P=0·00031, α=0·00208). For some combinations of F2 populations and loci, the analysis could not be completed because alleles were observed in the F2 which were absent in the parental populations, generating a zero value in the denominator. For these loci by population data sets we repeated the analysis with non-parental alleles excluded. This subsequent analysis revealed no additional statistically significant observations.
Using ALP markers to identify genomic regions of interest for drug resistance – analyses using individual alleles
An analysis of allele frequency was undertaken for each allele at each locus across the 6 F2 populations, the 2 parental populations and the other 4 isolates considered above. For this analysis we used the raw data, and not the RDS, as each locus was considered separately (see Table 1). In searching for possible associations between marker loci and drug resistance, we sought out incidences where the allele frequency of the drug selected F2 (or other isolate) was significantly different to F2UNS. We also sought out incidences where the allele frequency of the drug selected F2 (or other isolate) was significantly different from P0McMaster1931 or P0Wallangra2003.
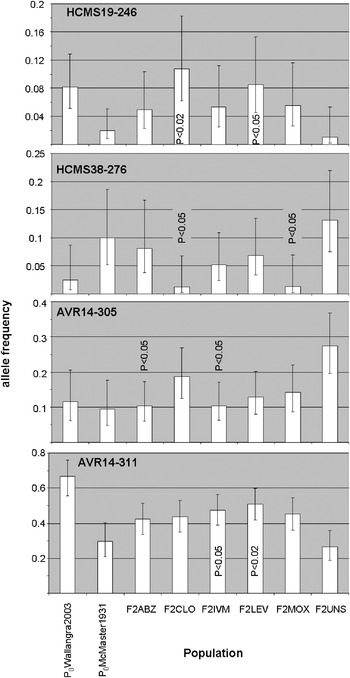
There were 72 alleles observed across the 6 loci in the full dataset. Twenty-two rare alleles existed as only single observations in the dataset and so we excluded these from the analysis. Of the remaining 50 alleles, there were significant (α=0·05) differences between the F2 or isolate populations and F2UNS, McMaster1931 or Wallangra2003 for 24 alleles; however, when α was corrected for multiple testing to minimize false positives (Bonferroni correction) none of these results was significant at the required level. Despite this, we have presented some of the findings in Fig. 3 to illustrate the range of differences in allele frequencies that have been observed in the work. The alleles selected for illustration in Fig. 3 are those which had marginally significant results (P<0·05) for any of the drug-selected F2 populations in comparison to F2UNS. The figure shows the P-values on bars corresponding to the populations with allele frequency differing from F2UNS at the 95% level. For 2 of the alleles illustrated, HCMS19-246 and HCMS38-276, the differences in allele frequency between F2UNS and the significant drug-selected F2 populations are similar to the differences between P0McMaster1931 and P0Wallangra2003.
Allelic frequencies for the 246 bp allele from the HCMS19 locus (HCMS19-246), 276 bp allele from the HCMS38 locus (HCMS38-276) and the 305 bp and 311 bp alleles from the AVR14 locus (AVR14-305, AVR14-311 respectively) in parental and F2 populations. For each population the allele frequency is shown by white bars and the error bars represent the 95% confidence interval. For F2 populations which have significantly different allele frequencies to F2UNS, P values are shown on, or adjacent to the bars.

DISCUSSION
Anthelmintic resistance in H. contortus P0Wallangra2003
By crossing the drug-resistant P0Wallangra2003 and drug-susceptible P0McMaster1931 isolates and exposing the F2 generation to anthelmintics we have confirmed previous reports of anthelmintic resistance in P0Wallangra2003. Furthermore, the level of resistance in the F2 is consistent for 1 or more dominant mutations controlling resistance toward ivermectin (<75% efficacy) as has been illustrated by published in vitro egg-hatch assay data (Le Jambre et al. Reference Le Jambre, Gill, Lenane and Baker2000) and recessive alleles controlling resistance to the other drugs tested (albendazole, levamisole, closantel and moxidectin all >75% efficacy). Benzimidazole resistance in H. contortus has been described in the past as semi-dominant or incompletely recessive (Le Jambre et al. Reference Le Jambre, Royal and Martin1979c; Sangster et al. Reference Sangster, Redwin and Bjorn1998). The egg-hatch dose response of F2UNS was closer to the P0McMaster1931 than P0Wallangra2003 for thiabendazole whereas in the eprinomectin migration assay the F2UNS dose response was more similar to P0Wallangra2003 than P0McMaster1931. There was surprisingly little evidence for moxidectin resistance in vivo, when considering the reported 84% efficacy of moxidectin against Wallangra2003 (Love et al. Reference Love, Neilson, Biddle and McKinnon2003); however, worms surviving treatment were obtained. Efficacy was calculated using a number of methods. By evaluating male and female worm counts, there was no evidence for sex chromosome linkage for loci controlling resistance to any of the anthelmintics used. We evaluated efficacy by FWEC on both day 7 and day 14 post-treatment and with the exception of ivermectin saw comparable efficacy of drugs between these time-points, and between either of these and efficacy calculated by worm count post-mortem approximately 1 week later. The efficacy based on FWEC at day 14 p.t. for ivermectin (3·2%) was much less than the efficacy based on total worm counts (50·1%), or separate female and male counts, indicating that the worms remaining after anthelmintic treatment may have been more fecund at the day 14 p.t. time-point than the worms in the unselected sheep at that time. This suggests that the dynamic response in egg output observed with canine hookworms in response to drug treatment, and hypothesized to be due to the relaxation of density-dependent fecundity constraints by removal of a portion of the adult worm population by the drug (Kopp et al. Reference Kopp, Coleman, McCarthy and Kotze2008; Kotze and Kopp, Reference Kotze and Kopp2008), may also be occurring with H. contortus. However, further study will be required to confirm such a relationship.
The use of ALP markers to map resistance loci
Neutral DNA markers, such as microsatellites, could be used to map anthelmintic resistance loci in nematodes as suggested by Gilleard and Beech (Reference Gilleard and Beech2007), and we have undertaken an attempt to map multiple resistance loci deriving from the P0Wallangra2003 isolate of H. contortus. The mutational events which generate drug resistance alleles may be ancient, and for commercially available drugs these alleles are found at very low frequencies at the time of market release. This is a logical conclusion as a higher frequency of resistance alleles would lead to a failure of the drug during the registration phase or earlier in the drug discovery pipeline. It is most probable that resistance alleles will be carried on the same chromosome as the most frequent alleles at nearby neutral markers, and it is also most likely that recombination between a drug resistance locus and a nearby neutral locus will result in the drug resistance allele recombining most often with frequently occurring alleles at the second locus. Hence, the drug resistance allele will most likely occur in cis with common alleles at the second, neutral, locus. Therefore there will be some alleles at a neutral marker to which both resistant and susceptible alleles at a nearby drug resistance locus will be linked in different haplotypes; they will be in cis chromosomal orientation. This phenomenon means that a mapping strategy designed to detect drug resistance loci will be less able to detect linkage for frequent alleles than rare alleles at neutral loci which differ in frequency between populations.
To investigate DNA-level population changes in response to selection with anthelmintic drugs, we produced crosses between P0McMaster1931 and P0Wallangra2003. The F2 generation was subjected to 5 different drug selections, or no drug selection in a sixth control F2 population. Six ALP markers were used to assess differences between the drug-selected and unselected F2 populations. We had only 6 markers available that were acceptable for use in the parent populations and so applicable for the study, and we discovered that 2 of these had limited use because of linkage disequilibrium, departures from HWE and a high frequency of null alleles. Another 21 markers have been investigated but were not useful (Hunt et al. 2008 and additional data not shown), and we find that 2 of the 6 are not useful for some types of analysis. Clearly, ALP markers are not highly suited to the type of work we have attempted, as each marker locus is expensive and time consuming in the discovery and validation phases.
Marker association studies such as we have described here are subject to statistical limitations, because of the high number of tests which must be conducted. Formally, the alpha value (limit of confidence) must be reduced as the number of tests increases, otherwise the false-positive rate will inevitably increase. We have used the Bonferroni correction to adjust alpha, and for that reason find no statistically significant associations between ALP locus alleles and drug resistance. This has also effected our assessment of loci displaying departures from HWE and of putative linkage between loci. This problem of multiple testing means that associations detected need to be very marked, or significance will not be reached. This is another reason why many more markers are required to effectively map drug resistance loci than we currently have available.
In addition, more marked genetic differences between resistant and susceptible parents would make mapping drug resistance easier. Only 5 of 50 alleles (ignoring single observation alleles) across the 6 loci displayed significant differences in frequency between P0McMaster1931 and P0Wallangra2003 and none of these differences are significant after Bonferroni correction. This illustrates the need for more divergent parents for future studies. One option would be to find drug-resistant populations more divergent from P0McMaster1931, so we looked at the 4 isolates we have genotyped as part of the work described above. Of these, GoldCoast2004 has 9 alleles that are divergent from McMaster1931, Cannawigara2005 has 5, MountBarker2006 has 3 and Wallangra1984 has 1. None of these are significant after Bonferroni correction. A second option would be to choose a different drug-susceptible parent, but we do not currently have any data from other isolates for which we are sure there is no drug resistance.
Despite limitations, the work we have described here shows the following. (i) It is possible to use genotyping data to explore the relationships between isolates of H. contortus, and that the markers HCMS19, HCMS38, CN23 and AVR14 are useful in this context. (ii) Genotyping data can be used as an adjunct to guard against contamination during parasitic nematode experiments. (iii) A single, effective drug selection generated F2 populations derived from the same parental cross which had some divergent properties, and we used departures from HWE and divergence in allele frequency to quantitate this. (iv) The divergence between McMaster1931 and Wallangra2003 though statistically significant across loci, is perhaps not sufficient to enable mapping of drug resistance loci derived from Wallangra2003.
The strategy of using neutral markers to map drug resistance loci in H. contortus has some merit because of our observations described above and in line with the suggestions of other works (for example, Gilleard and Beech, Reference Gilleard and Beech2007). There is a clear need to develop more genetic markers, and SNP markers may be best suited for future work because of lower cost and ease of discovery and validation. An assembled genomic sequence would also aid both the appropriate selection of markers, and the subsequent work necessary to fine-map linked drug resistance loci. In this study for example, a random selection of markers failed to find an X-linked locus. The use of inbred drug-susceptible parents could enable the mapping of drug resistance loci in field populations, irrespective of the anthelmintic drug of concern. This approach should enable much faster progress toward developing useful DNA markers for field application, as the need to inbreed each field isolate individually is circumvented.
ACKNOWLEDGEMENT
The authors gratefully acknowledge the technical assistance of Troy Kalinowski and Judi Kenny. We also thank Paul de Barro for valuable advice regarding statistical analysis. Financial support for the work conducted was provided by CSIRO.