Introduction
The mechanism of pyramidal slip, namely the movement of 〈c + a〉 dislocations with a Burgers vector of  ${1 / 3}\langle 11\bar{2}3\rangle$ in hexagonal close-packed (HCP) metals, especially Mg and its alloys, has long been investigated and debated [Reference Price1, Reference Rosenbaum2, Reference Stohr and Poirier3, Reference Obara, Yoshinga and Morozumi4, Reference Yoo5, Reference Yoo, Agnew, Morris and Ho6, Reference Agnew, Horton and Yoo7, Reference Ando, Gotoh and Tonda8, Reference Sandlöbes, Friák, Neugebauer and Raabe9, Reference Geng, Chisholm, Mishra and Kumar10, Reference Wu and Curtin11, Reference Buey and Ghazisaeidi12, Reference Itakura, Kaburaki, Yamaguchi and Tsuru13, Reference Wu and Curtin14, Reference Wu and Curtin15, Reference Wu, Yin and Curtin16, Reference Xie, Alam, Caffee and Hemker17, Reference Wu, Ahmad, Yin, Sandlöbes and Curtin18]. The literature shows that major efforts have been devoted to (i) identifying the precise slip planes, namely
 $\left\{ {10\bar{1}1} \right\}$ plane (i.e., pyramidal I) [Reference Xie, Alam, Caffee and Hemker17, Reference Tang and El-Awady19] or
 $\left\{ {11\bar{2}2} \right\}$ plane (i.e., pyramidal II) [Reference Price1, Reference Stohr and Poirier3, Reference Obara, Yoshinga and Morozumi4, Reference Agnew, Horton and Yoo7, Reference Sandlöbes, Friák, Neugebauer and Raabe9]; (ii) establishing whether cross-slip between pyramidal I and pyramidal II planes can occur [Reference Buey and Ghazisaeidi12, Reference Itakura, Kaburaki, Yamaguchi and Tsuru13, Reference Wu and Curtin15]; and (iii) understanding the source mechanisms [Reference Yoo, Agnew, Morris and Ho6, Reference Sandlöbes, Friák, Zaefferer, Dick, Yi, Letzig, Pei, Zhu, Neugebauer and Raabe20, Reference Agnew, Capolungo and Calhoun21]. However, only until recently efforts have been particularly focused on the mobility of 〈c + a〉 dislocations [Reference Wu and Curtin11, Reference Wu and Curtin14, Reference Wu, Ahmad, Yin, Sandlöbes and Curtin18], even though the 〈c + a〉 dislocation mobility holds the key to important mechanical properties, including ductility and work-hardening [Reference Yoo5, Reference Wu and Curtin11]. Using long-time molecular dynamics simulations [Reference Wu and Curtin11] with a recently developed density functional theory–validated interatomic potential [Reference Wu, Francis and Curtin22], Wu and Curtin reported that mobile 〈c + a〉 dislocations tend to dissociate on the basal plane, resulting in sessile configurations that impede the movement of other 〈c + a〉 dislocations. They claim to have unveiled the linkage between the high hardening/low ductility in Mg and the basal dissociation of mobile 〈c + a〉 dislocations. However, clear experimental evidence has not been provided to validate this basal dissociation model. To date, only few post-mortem transmission electron microscopy (TEM) studies [Reference Geng, Chisholm, Mishra and Kumar10, Reference Zhiqing, Chisholm, Duscher, Xiuliang and Pennycook23, Reference Geng, Chisholm, Mishra and Kumar24] have documented 〈c + a〉 type dislocation loops on the basal plane in deformed Mg single crystals, although post-mortem TEM was not able to determine the mobility of these loops.
Motivated by the lack of experimental observations described above, we present in situ TEM results that not only confirm the above-mentioned basal dissociation model but also reveal unique details concerning the mobility of 〈c + a〉 dislocations. Our novel experimental design of nano-indentation on H-bar-shaped thin foil Mg samples (“H-bars” for short hereafter), loaded perpendicular to the c-axis, is based on the following: (i) a micron-sized H-bar gives much larger field of view to observe dislocation activity than the common nano-pillars [Reference Ye, Mishra, Sachdev and Minor25, Reference Yu, Qi, Chen, Mishra, Li and Minor26]; (ii) simple tensile loading on thin foils could not activate 〈c + a〉 slip, because twinning dominates deformation for loading along c-axis, whereas prismatic slip dominates deformation for loading perpendicular to c-axis; and (iii) considering the stress concentration commonly occurring in the vicinity of an indenter [Reference Bei, Lu and George27, Reference Zhu, Li, Van Vliet, Ogata, Yip and Suresh28, Reference Mao, Shen and Lu29, Reference Catoor, Gao, Geng, Prasad, Herbert, Kumar, Pharr and George30, Reference Kwon, Brandes, Sudharshan Phani, Pilchak, Gao, George, Pharr and Mills31, Reference Shin, Kim, Ha, Oh, Choi and Han32, Reference Selvarajou, Shin, Ha, Choi, Joshi and Han33], it is possible to activate 〈c + a〉 slip in Mg and its alloys or other HCP metals by (nano)-indentation [Reference Kwon, Brandes, Sudharshan Phani, Pilchak, Gao, George, Pharr and Mills31, Reference Shin, Kim, Ha, Oh, Choi and Han32, Reference Selvarajou, Shin, Ha, Choi, Joshi and Han33]. Given that conventional (nano)-indentation on bulk samples would fail to reveal the details of 〈c + a〉 slip, especially regarding the glissile or sessile nature of active 〈c + a〉 dislocations, nano-indentation was performed on a specially designed H-bar-shaped thin foil Mg single crystal samples in a TEM. The deformation process and dislocation activity were recorded in situ to give insight into the nature of dissociation of the 〈c + a〉 dislocations during deformation.
Results
#1 H-bar: “low” strain
Multiple trials of in situ TEM deformation on H-bars were initially performed with incremental indentation distances in an effort to explore at what strain level 〈c + a〉 slip is activated. Our results reveal that with the H-bar indentation setup used, new dislocations, giving contrast under g = 0002, nucleated with a corresponding indentation distance larger than ∼200 nm, as shown in Fig. 1, for #1 H-bar. Post-mortem TEM characterization was performed for the selected area of interest in #1 H-bar deformed to relatively low strain. Figures 1(a) and 1(b) are g = 0002 and  $g = 2\bar{1}\bar{1}0$ under dark field, respectively. A few dislocations are clearly visible in Fig. 1(a), indicating they at least contain 〈c〉 component. It is also noted that most of these dislocations appear to align with the trace of the basal plane, as depicted by the white dashed line in Fig. 1(a). In contrast, a high density of dislocations is visible in Fig. 1(b) under
 $g = 2\bar{1}\bar{1}0$, indicating that the majority of dislocations are 〈a〉 type, besides contrast from possible 〈c + a〉 dislocations.
(a) and (b) Post-mortem TEM for #1 H-bar deformed to relatively low strain with g = 0002 and  $g = 2\bar{1}\bar{1}0$ under dark field, respectively. The white dashed line in (a) represents the trace of the basal plane.

#2 H-bar: “high” strain
Based on the information obtained from #1 H-bar, #2 H-bar was further deformed with an indentation distance of ∼500 nm in an attempt to introduce a higher density of new 〈c〉-component dislocations for further study. Post-mortem TEM characterization was performed for the selected area of interest in #2 H-bar deformed to relatively high strain, as shown in Fig. 2. Figures 2(a) and 2(b) are g = 0002 and  $g = 2\bar{1}\bar{1}0$ under dark field, respectively. More 〈c〉-component dislocations are clearly visible in Fig. 2(a) with g = 0002 compared with those in Fig. 1(a). In addition, most of these dislocations are also aligned with the trace of the basal plane (depicted by the white dashed line), resembling the 〈c〉-component dislocations observed in Fig. 1(a). Similar to Fig. 1(b), a high density of mostly 〈a〉-type dislocations is visible in Fig. 2(b). It is noted that most of these 〈a〉-type dislocations are also aligned with the trace of the basal plane [depicted by the white dashed line in Fig. 2(b)], indicating predominant basal slip activity. These basal 〈a〉 dislocations make it difficult to discern the possible contrast of 〈c〉-component dislocations in Fig. 2(b) from other 〈a〉 dislocations. Namely, basal 〈a〉 dislocations obstruct precise classification of possible 〈c + a〉 dislocations.
(a) and (b) Post-mortem TEM for #2 H-bar deformed to a relatively high strain level containing 〈c〉-component dislocations with g = 0002 and  $g = 2\bar{1}\bar{1}0$ under dark field, respectively. The white dashed line represents the trace of the basal plane. Some dislocations with stair-like configuration are pointed out by red arrows in (a).

Thicker #3 H-bar: more 〈c〉-component dislocations in action
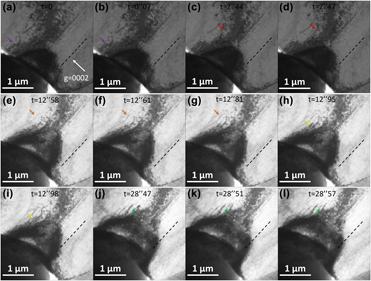
In order to capture more detailed dislocation activity under g = 0002, #3 H-bar with an increased thickness of ∼800 nm was deformed. Figure 3 presents a series of snapshots from the in situ TEM video (Supplementary material Video 1). It is noted that the black dashed line represents the trace of the basal plane. In addition, in each snapshot, an arrow with a certain color highlights a fixed location in space, where dislocation activity would occur in the vicinity. For example, the purple arrow in Fig. 3(a) (t = 0) points to a location where one dislocation would emerge just two frames later [Fig. 3(b), t = 0″07], with the same location in space highlighted by the purple arrow. In this way, the arrows act as fiduciary “coordinates” in space, so that as certain dislocations in the H-bar may move with the progression of deformation, the arrows can approximately track dislocation movement by comparing the location changes of dislocations relative to the arrows from one snapshot to the next.
(a)–(l) Snapshots of the deformation process of thicker #3 H-bar with approximate g = 0002 under bright field. The colored arrow in each snapshot acts as a fiduciary “coordinate” in space. With reference to the corresponding arrow, the movement of each dislocation in the vicinity can be better discerned. The black dashed line represents the trace of the basal plane.

In Fig. 3(c) (t = 2″44), one curved dislocation is highlighted by the red arrow; right in the next frame [Fig. 3(d), t = 2″47], this dislocation appeared to be “straightened,” aligning itself mostly with the basal plane. From Fig. 3(e) (t = 12″58) to Fig. 3(f) (t = 12″61), one long dislocation emerged, with most of the dislocation line aligned with the basal plane, except one notable “bump” pointed out by the orange arrow. However, this bump appeared to be “straightened” as well shortly after [Fig. 3(g), t = 12″81]. From Fig. 3(h) (t = 12″95) to Fig. 3(i) (t = 12″98), one loop-like dislocation pointed out by the yellow arrow appeared to be straightened. Figures 3(j)–3(l) demonstrate yet another interesting and clear example of this “straightening” dislocation behavior. In Fig. 3(j) (t = 28″47), one bow-like dislocation is highlighted by the green arrow. In the next frame [Fig. 3(k), t = 28″51], part of this dislocation bowed out, resulting in an “S” shape, with the middle portion aligned with the basal plane. Shortly after, half of the “S” curve appeared to be straightened.
Another “bowing out” dislocation behavior is clearly documented in Fig. 4 during later stage of indentation for #3 H-bar. In Fig. 4(a) (t = 43″49), two bow-like dislocations B1 and B2 appeared to be side-by-side as highlighted by the two blue arrows, respectively. As indentation progressed [Figs. 4(b)–4(f)], dislocation B2 gradually bowed out, whereas dislocation B1 remained intact. It is also noted that the direction of the bowing out movement of dislocation B2 appeared to be along the trace of the basal plane, as depicted by the black dashed line in each snapshot. As the H-bar, especially the area in the vicinity of the indenter, had undergone severe plastic deformation with the advance of the indenter, the severely deformed zone consumed most of the dislocations seen in Fig. 3. For example, the green arrow in Fig. 4(f) approximately points to the location where the “S”-shaped dislocation was in Figs. 3(k) and 3(l), but that dislocation was barely visible in Fig. 4(f), let alone other precedent dislocations seen in Fig. 3. However, it was still possible to perform clear post-mortem TEM characterization for the area of interest containing dislocations B1 and B2, as outlined by the black dashed box in Fig. 4(f). Figures 4(g) and 4(h) are g = 0002 and  $g = 01\bar{1}0$ under dark field, respectively. In Fig. 4(g) with g = 0002, the bow-like dislocations B1 and B2 are clearly visible, along with several other dislocations, which may have been sessile during indentation. Therefore, it is confirmed that B1 and B2 were at least 〈c〉-component dislocations.
(a)–(f) Snapshots of the deformation process in the later stage of thicker #3 H-bar with approximate g = 0002 under bright field. The activity of two bow-like dislocations B1 and B2 is tracked by two blue arrows. (g) and (h) Post-mortem TEM for the area of interest containing dislocations B1 and B2, as outlined by the black dashed box in (f) with g = 0002 and  $g = 01\bar{1}0$ under dark field, respectively.

#4 H-bar: peculiar 〈c + a〉 dislocation reaction
Efforts were devoted to observing dislocation bow out at higher magnification with better contrast, as this task was found difficult due to the bending contours (especially occurring at high strain) overshadowing dislocation contrast, as well as the uncertainty involved in the variation in dislocation mobility, as seen in Figs. 3 and 4. However, after many trials, dislocations bowing out as well as an additional behavior were captured during in situ deformation of #4 H-bar under g = 0002 dark field.
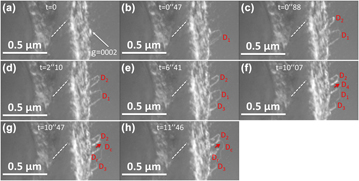
Figure 5 presents a series of snapshots from the in situ TEM video (Supplementary material Video 2). It is noted that at higher magnification, only part of the indenter tip was shown on the left of each snapshot, and the indenter also advanced from bottom-left to top-right. In Fig. 5(a) at t = 0, no contrast of individual dislocations could be seen, except the blurry bright contrast caused by a large bending contour. In Fig. 5(b) at t = 0″47, one dislocation denoted as D1 nucleated, assuming a bow-like configuration. Then in Fig. 5(c) at t = 0″88, another bow-like dislocation D2 nucleated, whereas D1 appeared to have not moved. Then in Fig. 5(d) at t = 2″10, D2 “bowed out” with the curved portion advanced by a noticeable distance, whereas D1 remained at the same position. Then in Figs. 5(e) and 5(f), new bow-like dislocations D3 and D4 nucleated, respectively, whereas D1 and D2 virtually remained intact. Then in Fig. 5(g), dislocations D1 and D4 appeared to have merged with each other, resulting in a combined dislocation Dc, and left a “residual” dislocation Dr. In addition, following the red arrow in Figs. 5(f) and 5(g) as a fiduciary reference fixed in space, one can tell Dc also bowed out by a subtle distance in Fig. 5(g) as compared with the original position of D1/D4 in Fig. 5(f). Then in Fig. 5(h), the new dislocation Dc further bowed out, whereas Dr remained immobile.
(a–e), snapshots of activity of D1–D3 dislocations in #4 H-bar during indentation with approximate g = 0002 under bright field. The bowing out of the newly formed dislocation D4 is tracked by red arrows in (f), (g), and (h). The white dashed line represents the trace of the basal plane.

Discussion
Mobile 〈c〉-component dislocations → 〈c + a〉 dislocations
It is acknowledged that the density of dislocations is so high in Fig. 1(b) with  $g = 2\bar{1}\bar{1}0$ and that it is impossible to clearly discern if the several 〈c〉-component dislocations visible in Fig. 1(a) with g = 0002 are also visible in Fig. 1(b) among other visible copious 〈a〉 dislocations. Namely, it was difficult to unambiguously determine whether these 〈c〉-component dislocations in #1 H-bar were actually 〈c + a〉 dislocations or just 〈c〉 dislocations, even though #1 H-bar was only slightly deformed to the point 〈c〉-component dislocations started to appear. Considering, however, the complex stress state during the deformation of the H-bar, as well as the considerable amount of plastic strain, it would be expected that many basal and non-basal 〈a〉 dislocations were activated at the same time. Moreover, they were probably also responsible for the formation of the bending contours. However, due to the in situ TEM setup (namely, close to g = 0002), the activity of 〈a〉-type dislocations remained largely invisible in the background. Only when a two-beam condition different from g = 0002 was set up in post-mortem TEM, was pervasive activity of 〈a〉 dislocations revealed. Undoubtedly, in #2 H-bar (as well as #3 H-bar) that was more severely deformed, an even higher density of dislocations is present in Fig. 2(b) with
 $g = 2\bar{1}\bar{1}0$, together with a remaining bending contour, overshadowing possible contrast from the several 〈c〉-component dislocations in Fig. 2(a) with g = 0002.
The deformed structure of #1 and #2 H-bars revealed that some 〈c〉-component dislocations with peculiar configuration formed at certain stages of loading/unloading. However, the full Burgers vector could not be obtained, which would be needed to confirm that these are 〈c + a〉 dislocations. An alternative way is to examine whether they are glissile, as revealed in the in situ deformation experiment of the thicker #3 H-bar (Figs. 3 and 4). The 〈c〉-component dislocation B2 in Fig. 4 was glissile. The 〈c〉-component dislocations highlighted in Fig. 3 also moved. Because they are glissile, we can infer that they are probably 〈c + a〉 dislocations [Reference Yoo5, Reference Partridge34]. These 〈c + a〉 dislocations are similar to those 〈c〉-component dislocations in #1 and #2 H-bars, implying that these could also be 〈c + a〉 dislocations that nucleated during deformation.
Peculiar configurations and reaction of 〈c + a〉 dislocations
It is noted that whether a dislocation is sessile or glissile and what configuration it assumes when stressed or relaxed largely depends on the dislocation core structure [Reference Hull and Bacon38, Reference Rodney, Ventelon, Clouet, Pizzagalli and Willaime39]. Therefore, to explain the peculiar behavior and configuration(s) of 〈c + a〉 dislocations documented in this study, we need to refer to the atomistic/subatomic structure of dislocations, which is beyond the resolution of the experimental observation of dislocation contrast. Based on long-time molecular dynamics simulations [Reference Wu and Curtin11] utilizing a recently developed density functional theory–validated interatomic potential [Reference Wu, Francis and Curtin22], Wu and Curtin reported computational studies, suggesting that 〈c + a〉 dislocations in Mg have a strong tendency to dissociate along the basal plane, resulting in a sessile configuration [Reference Wu and Curtin11, Reference Wu and Curtin14]. In other words, the basal-dissociated configuration is an energetic “ground state” for 〈c + a〉 dislocations. However, this atomistic-level model needs to be combined with the dislocation length scale observed by in situ TEM herein to rationalize the various documented dislocation configurations. Depending on the configuration of the initially nucleated dislocation line and its relationship with the basal plane, a 〈c + a〉 dislocation can assume a final configuration of straight line along the trace of the basal plane [e.g., most of the dislocations in Fig. 1(a)], or stair-like [e.g., the dislocations highlighted by the red dashed arrows in Fig. 2(a)], or bow-like (e.g., B1 and B2 dislocations in Fig. 4, and D1–D4 dislocations in Fig. 5).
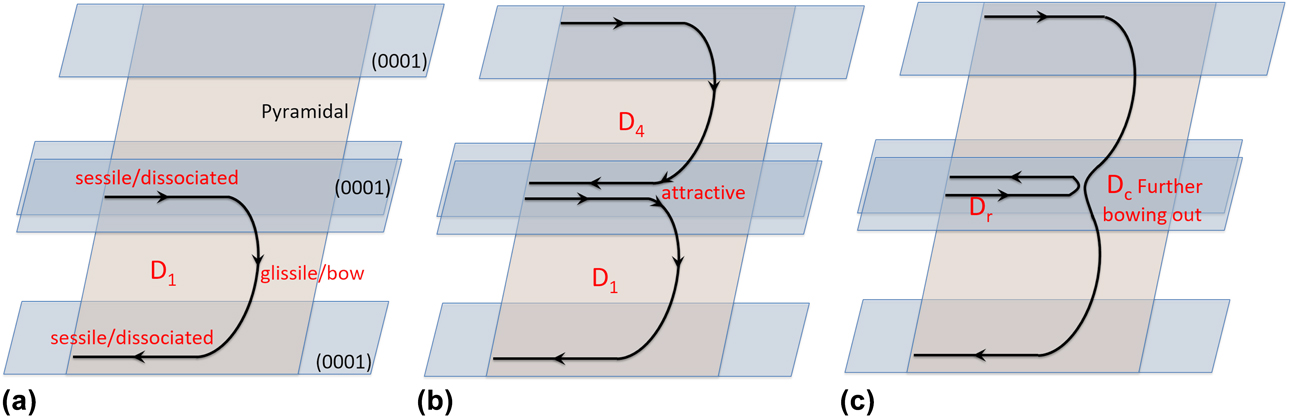
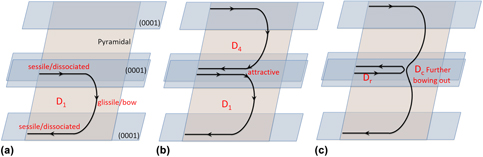
Moreover, since the unusually slow movement of bow-like 〈c + a〉 dislocations was captured by in situ TEM in great detail, especially in #4 H-bar (Fig. 5), a feasible explanation is proposed (Fig. 6) to account for the peculiar dislocation behavior observed in Fig. 5. First, D1 was nucleated and soon assumed the bow configuration with the two ends dissociated on the basal plane [Fig. 6(a)]. Namely, two portions of the dislocation were basal-dissociated [Reference Wu and Curtin11, Reference Wu and Curtin14] along the intersection lines of the pyramidal plane and two basal planes at different levels. However, the middle portion of D1 was out of the basal plane, thus was possible to bow out (i.e., glissile). Then D4, which was nucleated on the same pyramidal slip plane as D1, also assumed the bow configuration [Fig. 6(b)]. Consequently, while both D1 and D4 assumed similar bow configuration, the upper sessile portion of D1 [residing on a (0001) plane] and the lower portion of D4 [residing on a different (0001) plane] had opposite signs of Burgers vectors. In addition, one can see from Figs. 5(f) and 5(g) that the “gap” [exaggerated illustratively in Fig. 6(b)] between the two sessile portions was so small that diffraction contrast imaging could not accurately resolve, which made it possible for the two portions with opposite signs to strongly attract each other [Reference Hirth and Lothe40], resulting in a “pinch-out” glissile Dc and a half loop of sessile Dr [Fig. 6(c)]. While Dc further bowed out briefly as evidenced in Figs. 5(g) and 5(h), Dr stayed behind. The fact that the glissile portions of D1 and D4 can further bow out in the form of Dc supports the assumption that the original D1 and D4 were nucleated on the same pyramidal plane.
Proposed dislocation model for the movement and reaction of dislocations D1 and D4 observed in Fig. 5. (a) D1 was nucleated, assuming the bow-like configuration. (b) D4 was also nucleated on the same pyramidal plane as D1, assuming the bow-like configuration as well. (c) The adjacent glissile ends of D1 and D4 attracted each other, leading to a “pinched out” glissile Dc and a half loop of sessile Dr. Dc was able to further bow out.

The foregoing interpretation would suggest that the in situ TEM observation provides evidence for the basal dissociation of 〈c + a〉 dislocations. In addition, the bow-like configuration for D1–D4 also confirms the common immobility of 〈c + a〉 dislocations in Mg [Reference Wu and Curtin11, Reference Wu and Curtin14]: while they may have moved briefly before assuming this configuration, they virtually lost mobility after assuming the bow-like configuration, except only the curved portion can sometimes further bow out briefly. In other words, after most of the dislocation line is “trapped” at the ground state of basal dissociation, either assuming bow-like configuration or other configurations, the small portion that is out of the basal plane also has very limited mobility. Moreover, it is also noted that the reaction between D1 and D4 (Figs. 5 and 6) suggests reversibility of basal dissociation. Namely, under certain circumstances, the largely sessile basal-dissociated 〈c + a〉 dislocation may be “unpinned” and become glissile again.
Limitations of in situ H-bar deformation
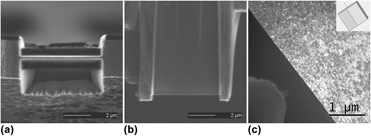
The experimental setup for H-bar deformation/indentation generated a complex stress state, one that is analogous to that of a bulk sample undergoing (nano)-indentation. With this in mind, we refer to the two-dimensional stress distribution maps commonly reported for bulk (nano)-indentation studies [Reference Bei, Lu and George27, Reference Zhu, Li, Van Vliet, Ogata, Yip and Suresh28, Reference Mao, Shen and Lu29, Reference Kwon, Brandes, Sudharshan Phani, Pilchak, Gao, George, Pharr and Mills31]. Of particular relevance here, Kwon et al. provided a comprehensive study on the distributions of resolved shear stress in HCP α-Ti undergoing nano-indentation, considering particular crystal orientations and possible active slip/twinning systems [Reference Kwon, Brandes, Sudharshan Phani, Pilchak, Gao, George, Pharr and Mills31]. Referring to one similar orientation (i.e.,  $\left[ {\bar{1}100} \right]$) reported by Kwon et al. [Reference Kwon, Brandes, Sudharshan Phani, Pilchak, Gao, George, Pharr and Mills31], in the Mg H-bars studied herein, the location where 〈c + a〉 slip would most likely occur is not at the central axis of the indenter but in areas that are beneath the corners of the indenter. This qualitative prediction agrees well with the experimental observation for most Mg H-bars herein. It is also noted that out-of-plane bending occurred for all H-bars presented herein, so that the bulk indentation analogy is not fully accurate. However, since the c-axis was in-plane in the horizontal direction [Figs. 7(a) and 7(b)], out-of-plane bending would not cause significant strain along the c-axis, hence not significantly affecting 〈c + a〉 dislocation activity.
A representative H-bar of Mg single crystal showing different views. (a) Cross-section view in SEM, showing the thickness of the H-bar, which is typically ∼300 nm. (b) Planar view in SEM, showing that the planar dimension of the H-bar is ∼5 µm × ∼5 µm. (c) Planar view in TEM, showing the size of the H-bar as compared with the conical ∼1 µm tip of the indenter.

Nevertheless, undoubtedly there are a number of possible complications involved in the in situ H-bar deformation. (i) The 〈c + a〉 dislocations were viewed with g = 0002, namely, with the basal plane edge-on. Under this projected view, any possible dislocation activity taking place on the basal plane was undiscernible. (ii) Neither the in situ TEM nor the post-mortem TEM was able to determine different variants of 〈c + a〉 slip, let alone possible cross-slip between pyramidal I and pyramidal II planes [Reference Buey and Ghazisaeidi12, Reference Itakura, Kaburaki, Yamaguchi and Tsuru13, Reference Wu and Curtin15]. (iii) It is highly desirable to characterize the detailed structure of basal-dissociated 〈c + a〉 dislocations. Unfortunately, due to the contrast of pervasive 〈a〉 dislocations, any contrast from the possible fine structure of 〈c + a〉 dislocations was overshadowed. Namely, it remains a challenging experimental task to observe detailed 〈c + a〉 dislocation activities under g = 0002, while also being able to characterize fine dislocation structures post-mortem. However, the principal goal of this study is to reveal the dynamics of 〈c + a〉 dislocations in Mg/Mg alloys, as a complement to post-mortem TEM characterization. Several previous reports [Reference Stohr and Poirier3, Reference Agnew, Horton and Yoo7, Reference Geng, Chisholm, Mishra and Kumar10] have provided detailed post-mortem TEM studies on similar 〈c + a〉 dislocation configurations based on deformed bulk Mg/Mg alloys. One feasible future study is to combine the in situ H-bar deformation experiments with atomistic modeling, e.g., molecular dynamics, in order to unveil the evolution of 〈c + a〉 dislocation core under complicated stress state. In addition, advances in image subtraction [Reference Hu, Shu, Yang, Guo, Liaw, Dahmen and Zuo41] may lead to more detailed observations in dislocation activities.
Conclusions
From in situ TEM study of the deformation process for H-bar-shaped thin foils of Mg single crystals, the key findings and conclusions are as follows:
(1) Compared with the pervasive 〈a〉 dislocations, new 〈c + a〉 dislocations were infrequently nucleated with various initial configurations.
(2) These 〈c + a〉 dislocations at best moved briefly, then became mostly aligned with the trace of the basal plane, since the basal-dissociated configuration was a low-energy sessile state.
(3) Limited bowing out movement for some non-basal portions of 〈c + a〉 dislocations was possible. Moreover, under certain circumstances, the basal-dissociated end can also be “unpinned,” enabling further movement.
Experimental procedure
Single-crystal pure Mg (99.99% purity) grown along the [0001] direction was purchased from the Goodfellow Corporation (Coraopolis, Pennsylvania). Thin slices of ∼0.5 mm thickness were sectioned parallel to the c-axis by electrical discharge machining (EDM). In this way, the (0001) basal plane would be edge-on under the microscope, which enables setting up the g = 0002 two-beam condition. The thin slices were etched in a 10% nitric acid until the edges started to be etched away, resulting in a wedge shape at the edges. Therefore, the thickness at the edges of the etched thin foils was a few micrometers. Then, H-bar-shaped thin foil specimens were prepared by focused-ion beam (FIB scanning electron microscope, i.e., SEM, FEI Strata 235, Thermo Fisher Scientific, Hillsboro, OR). Figure 7 shows a representative H-bar using different views. It represents the typical dimensions of H-bars involved in the study herein, unless otherwise specified. Figure 7(a) is the cross-section view in SEM, showing the thickness of the H-bar is ∼300 nm. It is noted that the thickness of the thin foil in the vicinity is only ∼3 µm. Figure 7(b) is the planar view in SEM, showing the planar dimension of the H-bar is ∼5 µm × ∼5 µm. Figure 7(c) is the planar view in TEM, showing the size of the H-bar as compared with the conical ∼1 µm tip of the Pico-Indenter (PI-95 by Hysitron, Minneapolis, Minnesota) located at the bottom-left corner. The inset hexagonal prism represents the typical orientation of the H-bars, although each H-bar might be tilted slightly to set up the g = 0002 two-beam condition for in situ TEM observation. It is noted that with this nano-indentation setup, 〈c + a〉 slip, as well as basal slip, would be readily activated [Reference Kwon, Brandes, Sudharshan Phani, Pilchak, Gao, George, Pharr and Mills31]. It is acknowledged that some black dots of contrast are present in Fig. 7(c), which stem from the inevitable FIB beam damage, even though minimum beam current was utilized at the final stage of thinning to minimize this damage. Nevertheless, the limited, randomly distributed FIB damage did not seem to affect the mobility of the dislocations that were of interest.
In situ TEM deformation of the H-bars was performed in a JEOL 3010 TEM (JEOL Ltd., Tokyo, Japan; operated at 300 kV) equipped with a Gatan Orius CCD camera (Gatan, Inc., Pleasanton, CA) and a Hysitron PI-95 Pico-Indenter system, under displacement control mode with a loading rate of ∼2 nm/s. The videos were recorded with a frame rate of ∼30 frames/s, namely, the interval between frames is 33 millisecond (i.e., 0″033). Post-mortem TEM characterization of dislocation configuration was performed in a JEOL 2500 TEM (operated at 200 kV). It is noted that, as mentioned earlier, the H-bars were prepared in the way that the two-beam condition g = 0002 could be set up for both in situ TEM and post-mortem TEM. The g = 0002 condition was extensively used to identify any 〈c〉 or 〈c + a〉 dislocations from 〈a〉 dislocations [Reference Agnew, Horton and Yoo7, Reference Partridge34, Reference Li, Ma and Ramesh35, Reference Zhang, Wen, Kumar, Chen, Zhang, Beyerlein, Schoenung, Mahajan and Lavernia36, Reference Zhang, Jiang, Schoenung, Mahajan and Lavernia37]. In addition, two-beam conditions  $g = 2\bar{1}\bar{1}0$ or
 $g = 01\bar{1}0$ were also used to visualize 〈a〉 dislocations in addition to possible 〈c + a〉 dislocations.
Supplementary material
To view supplementary material for this article, please visit https://doi.org/10.1557/jmr.2018.487.
Acknowledgments
This work was supported by National Science Foundation (NSF CMMI-1437327) and 111 Project of China (No. B13035). The authors also acknowledge the support from the Molecular Foundry, which is funded by the Office of Science, Office of Basic Energy Sciences of the US Department of Energy under Contract No. DE-AC02-05CH11231. Experimental assistance from Mr. John Turner and Dr. Joshua Kacher is highly appreciated.