


I. INTRODUCTION
Indoor stationary object detection in an unknown environment is important for many civilian and military applications, such as indoor surveillance, search and rescue operations, logistics, security, and so on. However, it is challenging as compared with moving target detection, or target detection in a known environment, due to the highly cluttered indoor environment, the motionless nature of the targets concerned, as well as the lack of a priori information of the background for some scenarios (e.g. a disaster scenario after earthquake).
The detection of radar targets against a background of unwanted clutter due to echoes from the environment is a problem of fundamental interest in radar community [Reference Scheer1]. Generally, the detection algorithm is designed based on the differences (or deviations) between the targets and the background (clutter, noise). The ability to distinguish objects depends on how much their properties (e.g. electromagnetic properties, motion properties, polarization, etc.) deviate from the properties of the background. Since the targets concerned are stationary objects, there would be no distinct speed difference between the targets and the background. Hence, it prevents the application of the motion-parameter-based detection techniques, e.g. Doppler-based approaches, subtraction (or cancellation) between sequence snapshots (e.g. Displaced Phased Center Antenna (DPCA)-based detection), etc. [Reference Scheer1].
In literature, for the detection of a stationary object, background subtraction-related techniques are widely used to reduce the influence of background clutters (e.g. [Reference Moura and Jin2, Reference Varslot, Yazici, Yarman, Cheney and Scharf3]). Generally, it is assumed that “a priori” information about the environment can be acquired before presence of the target, and the target signature is contained in the residual of the subtraction operation. In literature [Reference Moura and Jin2, Reference Borcea, Papanicolaou, Tsogka and Berryman4], after background subtraction, a computational time reversal (TR) technique is adopted to extract target information. Typically, it is realized by DORT (French acronym for “Decomposition of the Time Reversal Operator”), which relies on the assumption that the Green's function can be calculated (e.g. [Reference Zhang, Hoorfar and Li5, Reference Wang6]). However, under a layered medium condition (e.g. an indoor environment with walls), the computational TR demands a mathematical model of wall, in which the parameters of wall, such as thickness and real dielectric constant are required for construction of the mathematical model. In a realistic unknown indoor detection scenario, it is impractical to know all these detailed physical parameters of wall in advance.
Consider a stationary object detection scenario in an unknown realistic indoor environment (e.g. an indoor environment after disaster). Firstly, “a priori” information of the disaster environment is not always available in advance, so that it is not possible to use “background subtraction” related techniques any more. Extremely, for this unknown environment, the statistical distributions of clutter and noise are probably also unknown. This would even lead to difficulties in designing of a detector in the sense of statistics. Secondly, in indoor environments, targets (objects of interest) are typically surrounded by clutter (objects of uninterest). The responses of targets are not always stronger than that of clutter. It implies that we cannot always guarantee the signal-to-interference-and-noise ratio (SINR) of the system is high enough so that the target can be detected. Thirdly, in indoor environments, there exists a number of objects and obstacles (e.g. wall) with unknown parameters. Owing to lack of parameter information of these obstacles, the Green's function is difficult to be constructed. This would further hinder the application of computational TR-related techniques.
In this paper, the concerned target is an object with a diffuse planar-surface. It can be testified that, for this kind of target, the reflections in different directions are angular-dependent, and with certain relationships among them. This property could be used to distinguish the target from other objects (clutter) in the environment. In fact, here, angular-dependent information is utilized, which has no relationship with the excess time-delay, incurred by obstacles such as walls. Therefore, it does not demand the knowledge of the obstacle parameters. In addition, in order to get a more reliable detection, a signal enhancement scheme is designed to enhance the signal. The byproduct of this operation is that the responses of clutter scattered from various sources (e.g. different objects in the surrounding) are non-uniformly time-shifted and accumulated. According to the Central Limit Theorem (CLT) of probability theory, the accumulation of clutter from a large number of different sources would approach Gaussian distribution. Thus, unknown clutter and noise are transformed into Gaussian clutter and noise. Correspondingly, a detector could be designed.
II. PROBLEM STATEMENT AND THE SIGNAL MODEL
We assume that the detection takes place in an unknown cluttered indoor environment, which is not possible to be probed before presence of the target. As an example, it may be an indoor environment after disaster. There are a number of objects and obstacles (e.g. wall) existing in the surroundings. The statistical distribution of clutter and noise is unknown.
We assume for our investigations that the target to be detected is an extended object with a planar-surface, on which there are a number of scatterers diffusing probing signals. As shown in Fig. 1, a set of ultra-wideband (UWB) radar sensors is used to detect the target. It consists of a number of receivers R m ∈ {R 1,…,R M}, and one or more transmitters which move along predefined linear tracks Ll ∈ {L1,…,LL}, on which signals are transmitted at different transmission positions T n ∈ {T 1,…,T N}. The environment is explored in a “line by line” manner by the movement of the transmitter. In order to improve the efficiency of the detection, several transmitters may be used to search several lines at the same time. In this way, a multiple-input multiple-output (MIMO) configuration is constructed.
Measurement configuration. The transmitter moves along predefined tracks. T 1,…,T n,…,T N are different transmission positions on the track Ll. “R1,…,RM” are sparsely spaced receivers with different reception angles. It is noted that the walls in the scenario could appear anywhere, not just the location indicated in this figure.

Suppose p(t) is the radiated waveform. Then, the signal received at the receiver R m with respect to the transmission position T n can be expressed as
 $$\eqalign{{s_{Rm\comma Tn}}\lpar t\rpar & = \sum\limits_i {a_{{R_m}\comma {O_i}\comma {T_n}}}p\lpar t - {t_{{R_m}\comma {O_i}\comma {T_n}}^{\prime}}\rpar \cr &\quad + \sum\limits_j {a_{{R_m}\comma {C_j}\comma {T_n}}}p\lpar t - {t_{{R_m}\comma {C_j}\comma {T_n}}^{\prime}}\rpar + {n_{{R_m}\comma {T_n}}}\lpar t\rpar\comma } \; $$
where i and j are the indexes of O i and C j. As shown in Fig. 1, O i and C j denote objects in and out of the line under exploration (e.g. Ll), respectively. The first term of the right part of (1) is the response of the objects (e.g. O i) in the line under exploration. The second term is the response of the objects (e.g. C j) out of the line under exploration.  ${n_{{R_m}\comma {T_n}}}\lpar t\rpar $ is additive noise.
 ${a_{{R_m}\comma {O_i}\comma {T_n}}}$ and
 ${a_{{R_m}\comma {C_j}\comma {T_n}}}$ are the complex reflectivities due to the interaction of the reflections from the scatterers located on the objects O i and C j, respectively. Their values depend on a number of factors, such as the orientation of object, the illumination geometry of transmitter–receiver pair “R m − T n”, etc. For the scope of the paper, the antenna gain and the signal fading due to propagation are ignored hereinafter.
The parameter
 $${t_{{R_m}\comma {O_i}\comma {T_n}}^{\prime}} = [ {\vert {{{\bf R}_m} - {{\bf O}_i}} \vert + \vert {{{\bf O}_i} - {{\bf T}_n}} \vert } ] /c\comma \;$$
where Rm, Oi, and Tn are, respectively, the position vectors of R m, O i and T n, is the average time-delay of the signals scattered by the scatterers located on the object O i. Subscript “R m, O i, T n” is used to indicate the parameters associated with propagating path “R m ← O i ← T n”. Subscript “R m, T n” indicates the parameters related to the transmitter–receiver pair “R m − T n”. The symbol |·| is a modulus operator, and c is the wave propagation speed. Likewise
 $${t_{{R_m}\comma {C_j}\comma {T_n}}^{\prime}} = [ {\vert {{{\bf R}_m} - {{\bf C}_j}} \vert + \vert {{{\bf C}_j} - {{\bf T}_n}} \vert } ] /c\comma \;$$
where Cj is the position vector of C j, is the average time-delay with respect to the clutter C j.
It should be noted that, for each detection, the responses of the objects out of the line under exploration, i.e. the second term of (1), will be regarded as clutter. Since the target is stationary, it is less practical to suppress the second term of (1) via motion-related techniques (e.g. subtraction or cancellation of sequence snapshots). Furthermore, because a priori information of the background is not available in our scenario, background subtraction-related techniques are not able to be used any more.
In addition, due to the fact that there exist plenty of objects in a typical indoor environment, for the data segment within a certain time slot of the received signal, it could be a mixture of responses scattered from objects situated on a certain ellipse (e.g. the ellipse shown in Fig. 1, or in three-dimensional (3D) case, an ellipsoid). This implies that the response of a target can probably be contaminated by responses of many other objects, which are located on the same ellipse with the target. In this case, we cannot always guarantee that the response of the target is strong enough to be detected.
Figure 2 gives the flowchart of our proposed algorithm. In order to get a reliable detection, it is necessary to enhance the signal before detection. For our concerned unknown environment, after the signal enhancement procedure, the statistical distribution of clutter could be changed into Gaussian distribution. Afterward, the detection is operated in a Gaussian clutter and noise environment using a kind of angular-dependent spectrum-shift information.
Flow chart of the algorithm.
III. SIGNAL ENHANCEMENT
In (1), the value of  ${a_{{R_m}\comma {O_i}\comma {T_n}}}$ or
 ${a_{{R_m}\comma {C_j}\comma {T_n}}}$ highly depends on the orientation of the target and the corresponding illumination geometry. However, for the same orientation of the target,
 ${a_{{R_m}\comma {O_i}\comma {T_n}}}={a_{{R_m}\comma {O_i}\comma {{T}_n^{\prime}}}}$ holds, under the condition
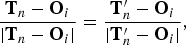 $$\displaystyle{{{{\bf T}_n} - {{\bf O}_i}} \over {\vert {{{\bf T}_n} - {{\bf O}_i}} \vert }}=\displaystyle{{{{{\bf T}}_n^{\prime}} - {{\bf O}_i}} \over {\vert {{\bf T}{_n^{\prime}} - {{\bf O}_i}} \vert }}\comma \; $$
where Tn and T′n are the different transmission positions in the line under exploration, e.g. Ll, as shown in Fig. 1. Under this condition, we can further have  $\vert {{{\bf T}_n} - {{\bf O}_i}} \vert - \vert {{{{\bf T}}_n^{\prime}} - {{\bf O}_i}} \vert =\vert {{{\bf T}_n} - {{{\bf T}}_n^{\prime}}} \vert $.
Obviously, for the objects in the concerned line, Tn and T′n have the same illumination angles. But for the objects out of this line, they have different illumination angles. Therefore, for the objects in the concerned line, the same distance between Tn and T′n would induce the same time-delay difference given by
 $$\eqalign{t_{{T_n}\comma {{T}_n^{\prime}}}^{diff} & = {t_{{R_m}\comma {O_i}\comma {T_n}}^{\prime}} - {t_{{R_m}\comma {O_i}\comma {{T_n^{\prime}}}}^{\prime}} \cr & = [ {\vert {{{\bf T}_n} - {{\bf O}_i}} \vert - \vert {{{{\bf T}}_n^{\prime}} - {{\bf O}_i}} \vert } ] /c = \vert {{{\bf T}_n} - {{{\bf T}}_n^{\prime}}} \vert /c.}$$
However, it would induce different time-delay differences for the objects out of this line, due to the fact that  $\vert {{{\bf T}_n} - {{\bf C}_j}} \vert - \vert {{{{\bf T}}_n^{\prime}} - {{\bf C}_j}} \vert \ne \vert {{{\bf T}_n} - {{{\bf T}}_n^{\prime}}} \vert $.
According to (3), if taking the transmission position T1 as a reference, we have
 $$p\lpar t - {t_{{R_m}\comma {O_i}\comma {T_n}}^{\prime}} + t_{{T_n}\comma {T_1}}^{diff} \rpar = p\lpar t - {t_{{R_m}\comma {O_i}\comma {T_1}}^{\prime}}\rpar \comma \; $$
where the time-delay difference  $t_{{T_n}\comma {T_1}}^{diff} $ only depends on the transmission positions. This implies that, for the objects located in the line under exploration, their time-delays with respect to different transmission positions could be compensated and then aligned by the operation given by (4).
Based on the signal model given by (1), let us consider a “time-shift & accumulation” operation which is described as
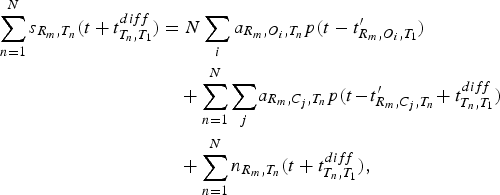 $$\eqalign{\sum\limits_{n = 1}^N {s_{{R_m}\comma {T_n}}}\lpar t + t_{{T_n}\comma {T_1}}^{diff} \rpar & = N\sum\limits_i {a_{{R_m}\comma {O_i}\comma {T_n}}} p\lpar t - {{t}_{{R_m}\comma {O_i}\comma {T_1}}^{\prime}}\rpar \cr & \quad + \sum\limits_{n = 1}^N \sum\limits_j \!{a_{{R_m}\comma {C_j}\comma {T_n}}} p\lpar t \!-\! {{t}_{{R_m}\comma {C_j}\comma {T_n}}^{\prime}} \!+ t_{{T_n}\comma {T_1}}^{diff} \rpar \cr & \quad + \sum\limits_{n = 1}^N {n_{{R_m}\comma {T_n}}}\lpar t + t_{{T_n}\comma {T_1}}^{diff} \rpar \comma \;} $$
where n is the index of the transmission positions. The first and second terms of the right part of the equation, are the accumulations of responses scattered from the objects located in and out of the line under exploration, respectively. The third term is noise. It is noted that
• in the line under exploration: the responses of the objects (O i) are time-shifted, aligned and then accumulated. It is a coherent operation, where the parameter
 $t_{{T_n}\comma {T_1}}^{diff} $ is used for time-delay correction. Responses are enhanced for N times as compared with the case of single transmission data.
• Out of the line under exploration: the responses of objects (C j) are non-uniformly time-shifted, disturbed, and then accumulated. It is an incoherent operation, because
${a_{{R_m}\comma {C_j}\comma {T_n}}} \ne {a_{{R_m}\comma {C_j}\comma {{T}_n^{\prime}}}}$, and the fact that the parameter $t_{{T_n}\comma {T_1}}^{diff} $ could further disturb the arriving-time of the responses. As a consequence, for a certain time-slot, the responses from objects located on different ellipses (or ellipsoids) are non-uniformly time-shifted and accumulated. Hence, these responses are attenuated as compared with the output of the coherent operation above.



The main steps of the operation are summarized as follows:
(a) move the transmitter along a certain track, e.g. Ll;
(b) execute the “time-shift & accumulation” operation to enhance the signal. In the operation, responses of objects located in Ll are aligned, whereas responses of objects out of Ll are non-uniformly time-shifted (disturbed);
(c) target detection along the track Ll;
(d) repeat (a)–(c) for other tracks.
IV. DATA-PROJECTION AND THE SPECTRUM-SHIFT
A) Data-projection
As shown in Fig. 3, X is an arbitrarily scatterer located on the surface of the concerned target (e.g. O i in Fig. 1). X0 denotes a reference point (e.g. the center of surface).
Illumination geometry with respect to the target's surface plane.
Owing to the existence of walls in the indoor environment, excess time-delay occurs when rays penetrate wall materials. Denote as ζ(B, A) the excess time delay existing in the propagating path starting from point A and ending at point B. Then, the propagation time between the transmitter Tn, scatterer X, and receiver Ri can be expressed as
 $$t^{\prime}\lpar {{\bf R}_i}\comma \; {\bf X}\comma \; {{\bf T}_n}\rpar = d\lpar {{\bf R}_i}\comma \; {\bf X}\comma \; {{\bf T}_n}\rpar /c + \zeta \lpar {{\bf R}_i}\comma \; {\bf X}\rpar + \zeta \lpar {\bf X}\comma \; {{\bf T}_n}\rpar \comma \; $$
where d(Ri, X, Tn) = | Ri − X| + | Tn − X| is the range of propagation.
Suppose the target locates in the far field of the radar sensors, and the spatial extent is far less than its distance to the radar sensors. It is reasonable to assume that all the scatterers on the concerned extended target have the same excess time-delay. This implies that the excess time-delay does not change with the variation of scatterer's position X. Mathematically, it can be assumed that
 $$\displaystyle{{\partial} \over {{\partial} {\bf X}}}[ {\zeta \lpar {{\bf R}_i}\comma \; {\bf X}\rpar + \zeta \lpar {\bf X}\comma \; {{\bf T}_n}\rpar } ] = 0.$$
Then (6) can be expanded at the nearby of X0 as
 $$t^{\prime}\lpar {{\bf R}_i}\comma \; {\bf X}\comma \; {{\bf T}_n}\rpar \approx t^{\prime}\lpar {{\bf R}_i}\comma \; {{\bf X}_0}\comma \; {{\bf T}_n}\rpar + \tau .$$
The variable τ is the time-delay induced by the variation of scatterer positions,
 $$\tau = { {\hbox{gra}{\hbox{d}_x}\lpar {d\lpar {{\bf R}_i}\comma \; {\bf X}\comma \; {{\bf T}_n}\rpar } \rpar } \vert _{{\bf X} = {{\bf X}_0}}} \cdot \Delta {\bf X}/c = {{\bf p}_{ref}} \cdot \Delta {\bf X}\comma \; $$
where  ${{\bf p}_{ref}} = { {\hbox{gra}{\hbox{d}_x}\lpar {d\lpar {{\bf R}_i}\comma \; {\bf X}\comma \; {{\bf T}_n}\rpar } \rpar } \vert _{{\bf X} = {{\bf X}_0}}}/c$ is a reference vector selected. ΔX = X − X0 is a vector on the target-surface plane. gradx(·) is a gradient operator with respect to the variable X. According to the concept of gradient operation, gradx(d(Ri, X, Tn)) points to the direction of the greatest rate of change of the distance d(Ri, X, Tn). It determines the direction of pref. Here, “·” is a dot-product operator. Via the dot-product operation given in (8), the vector ΔX is projected onto the direction of the reference vector pref.
Similarly, consider the time-delay of the signal received by R j, whose reception angle is different from that of R i. When projecting the data onto the same reference vector pref, the time-delay can be given as
 $$t^{\prime}\lpar {{\bf R}_j}\comma \; {\bf X}\comma \; {{\bf T}_n}\rpar \approx t^{\prime}\lpar {{\bf R}_i}\comma \; {{\bf X}_0}\comma \; {{\bf T}_n}\rpar + {\gamma _{j\comma i}}\tau\comma \; $$
where γ j,i is a scaling factor,
 $$\eqalign{{\gamma _{j\comma i}} & = \displaystyle{{{{ {\hbox{gra}{\hbox{d}_x}\lpar {d\lpar {{\bf R}_j}\comma \; {\bf X}\comma \; {{\bf T}_n}\rpar } \rpar } \vert }_{{\bf X} = {{\bf X}_0}}} \cdot \Delta {\bf X}} \over {{{ {\hbox{gra}{\hbox{d}_x}\lpar {d\lpar {{\bf R}_i}\comma \; {\bf X}\comma \; {{\bf T}_n}\rpar } \rpar } \vert }_{{\bf X} = {{\bf X}_0}}} \cdot \Delta {\bf X}}} \cr & = 1 + \displaystyle{{\lpar {{\bf U}_{{R_j}\comma {X_0}}} - {{\bf U}_{{R_i}\comma {X_0}}}\rpar } \over {{{\bf V}_{bi}} \cdot \Delta {\bf X}}}.}$$
In (10),  ${{\bf V}_{bi}} = {{\bf U}_{{T_n}\comma {X_0}}} + {{\bf U}_{{R_i}\comma {X_0}}}$.
 ${{\bf U}_{{T_n}\comma {X_0}}}$ and
 ${{\bf U}_{{R_i}\comma {X_0}}}$ are the unit vectors of Tn − X0, and Ri − X0, respectively.
 ${{\bf U}_{{R_j}\comma {X_0}}}$ is the unit vector of Rj − X0. It can be proven that Vbi locates on the bisector of the angle ∡R iX 0T n.
In fact, (8)–(10) define a data-projection operation, in which, ΔX, the location variations of scatterers on the target-surface plane with respect to the different receivers R i and R j, are projected onto the same the reference vector pref. In other words, the location variations ΔX on the target-surface plane are translated into time-delay variations in the direction of the reference vector pref. In the perspective of signal processing, it would correspond to a resampling operation, in which the resampling rate is controlled by the parameter γ j,i.
Apparently, due to the existence of the scaling factor γ j,i, even for the same location variation ΔX on the target-surface plane, it will induce different time-delays, τ and γ j,iτ, with respect to different illumination geometries, e.g. “Tn → X → Ri” and “Tn → X → Rj”. Consequently, it will further impact on the spectrum in frequency domain.
B) Spectrum-shift
Recalling that  ${s_{{R_i}\comma {T_n}}}\lpar t\rpar $ and
 ${s_{{R_j}\comma {T_n}}}\lpar t\rpar $ are the responses obtained at different receivers R i, R j, with respect to the same transmission position T n. Denote as
 ${\tilde s_{{R_i}\comma {T_n}}}\lpar t\rpar $ and
 ${\tilde s_{{R_j}\comma {T_n}}}\lpar t\rpar $ the expressions of
 ${s_{{R_i}\comma {T_n}}}\lpar t\rpar $ and
 ${s_{{R_j}\comma {T_n}}}\lpar t\rpar $ after they pass through the down-converter of the system. Denote as
 ${\hat s_{{R_i}\comma {T_n}}}\lpar \tau \rpar $ and
 ${\hat s_{{R_j}\comma {T_n}}}\lpar \tau \rpar $ the expressions of
 ${\tilde s_{{R_i}\comma {T_n}}}\lpar t\rpar $ and
 ${\tilde s_{{R_j}\comma {T_n}}}\lpar t\rpar $ after they are projected onto the reference vector direction. Denote as
 ${\hat S_{{R_i}\comma {T_n}}}\lpar \bar \omega \rpar $ and
 ${\hat S_{{R_j}\comma {T_n}}}\lpar \bar \omega \rpar $ the Fourier transforms of
 ${\hat s_{{R_i}\comma {T_n}}}\lpar \tau \rpar $ and
 ${\hat s_{{R_j}\comma {T_n}}}\lpar \tau \rpar $, respectively.
According to the results given in the appendix, the relative spectrum-shift between  ${\hat S_{{R_i}\comma {T_n}}}\lpar \bar \omega \rpar $ and
 ${\hat S_{{R_j}\comma {T_n}}}\lpar \bar \omega \rpar \rpar $ can be given by
 $${\Omega _{j\comma i}} = {\omega _c}\lpar {\gamma _{j\comma i}} - 1\rpar = {\omega _c}\displaystyle{{\lpar {{\bf U}_{{R_j}\comma {X_0}}} - {{\bf U}_{{R_i}\comma {X_0}}}\rpar } \over {{{\bf V}_{bi}} \cdot \Delta {\bf X}}}.$$
Apparently, it does not contain the excess time-delay-related terms. By a further investigation of (6), (A.6), and (A.7), it can be seen that the excess time-delay only impact on the phase of (A.6). But, it does not impact on the relative spectrum-shift Ωj,i.
As discussed in the appendix, the relative spectrum-shift Ωj,i can be further expressed as a function of angle-difference  $\lpar {\theta _{{R_j}}} - {\theta _{{R_i}}}\rpar $ as
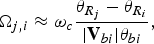 $${\Omega _{j\comma i}} \approx {\omega _c}\displaystyle{{{\theta _{{R_j}}} - {\theta _{{R_i}}}} \over {\vert {{{\bf V}_{bi}}} \vert {\theta _{bi}}}}\comma \;$$
where θ bi,  ${\theta _{{R_i}}}$ and
 ${\theta _{{R_j}}}$ are the angles between the normal of the target surface (i.e. vector e3 in Fig. 3) and the vector Vbi, the projections of Ri and Rj onto the plane B, respectively. Specially, we assume that the radar sensors (transmitter, receiver) and the target are located at the same plane (e.g. the sensors and the target are all located on the floor of a room). Then, if the normal of the target surface (i.e. vector e3) also locates in the same plane (e.g. in indoor environment, a wide range of objects, such as cabinets, refrigerators, etc., are with vertical surfaces. The normals of all these vertical surfaces are located in the floor plane), the angle-difference
 $\lpar {\theta _{{R_j}}} - {\theta _{{R_i}}}\rpar $ given in (A.11) would be ∡R iX 0R j, which is an angle-difference between the corresponding reflection directions.
In indoor environments, walls exist inevitably. It is reasonable to assume that the two sides of walls are parallel, and the rays going out the wall material can still be parallel to the incident ray (as shown in Fig. 4). Under this assumption, the angle-difference  $\lpar {\theta _{{R_j}}} - {\theta _{{R_i}}}\rpar $ does not change after the wave passing through walls. That is, the wall does not change the value of
 $\lpar {\theta _{{R_j}}} - {\theta _{{R_i}}}\rpar $. Hence, the measured spectrum-shift Ωj,i and the parameter γ j,i do not change after the wave passing through walls.
The model of the wall. Assume that the rays (r 2) going out the wall material are still parallel to the incident rays (r 1). That is, θ 1 = θ 2.
In short, under the given assumptions, both the excess time-delay due to walls and the refraction effect of walls do not impact on the value of spectrum-shift Ωj,i and also the value of the parameter γ j,i, theoretically.
C) Signal expression after data-projection
If we neglect the influence of the phase of complex reflectivity σ, it can be inferred from (A.6) that, the spectrum-shift given in (A.7) or (A.11) is same with the shift between  $\vert {{{\hat S}_{{R_i}\comma {T_n}}}\lpar \bar \omega \rpar \rpar } \vert $ and
 $\vert {{{\hat S}_{{R_j}\comma {T_n}}}\lpar \bar \omega \rpar \rpar } \vert $. Obviously, the operation of |·| isolates the influence of excess time-delay incurred by walls. Let
 ${\bar s_{{R_i}\comma {T_n}}}\lpar \tau \rpar $ and
 ${\bar s_{{R_j}\comma {T_n}}}\lpar \tau \rpar $ be the inverse Fourier transform of
 $\vert {{{\hat S}_{{R_j}\comma {T_n}}}\lpar \bar \omega \rpar \rpar } \vert $ and
 $\vert {{{\hat S}_{{R_j}\comma {T_n}}}\lpar \bar \omega \rpar \rpar } \vert $, respectively. The relationship between
 ${\bar s_{{R_i}\comma {T_n}}}\lpar \tau \rpar $ and
 ${\bar s_{{R_j}\comma {T_n}}}\lpar \tau \rpar $ can be given as
 $${\bar s_{{R_j}\comma {T_n}}}\lpar \tau \rpar \approx {\bar s_{{R_i}\comma {T_n}}}\lpar \tau \rpar \exp \lpar - j{\gamma _{j\comma i}}\tau \rpar .$$
If take the receiver R 1 as the reference, after the data-projection operation, we have
 $${\bar{\bf s}_{{T_n}}} = \bar s_{{T_n}}^{ref} {\bf K}\comma \; $$
where  ${\bar{\bf s}_{{T_n}}} = [ {\bar s_{{R_1}\comma {T_n}}}\comma \;{\bar s_{{R_1}\comma {T_n}}}\comma \; ...\comma \;{\bar s_{{R_M}\comma {T_n}}}{] ^T}$. The superscript T indicates the transpose operation. In addition,
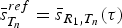 $\bar s_{{T_n}}^{ref} = {\bar s_{{R_1}\comma {T_n}}}\lpar \tau \rpar $, and K = [1, exp(−jγ 2,1τ),…, exp(−jγ M,1τ]T.
For convenience of mathematical manipulation, if we consider the effects of unwanted contributions due to clutter c and noise n, the signal model for all transmission positions can be given as
 $$\eqalign{{\bf y} & = {{\bar{\bf s}}^{ref}} \otimes {\bf K} + {\bf c} + {\bf n} \cr & = {\bf x} + {\bf c} +{\bf n}\comma \; } $$
where y is a N MN×1 vector,  ${\bar{\bf s}^{ref}}=[ \bar s_{{T_1}}^{ref}\comma \; \bar s_{{T_n}}^{ref}\comma \; ...\comma \; \bar s_{{T_N}}^{ref} {] ^T}$, and
 ${\bf x}={\bar{\bf s}^{ref}} \otimes {\bf K}$. N MN = M × N, where M and N are the numbers of receivers and transmission positions, respectively. The symbol ⊗ denotes Kronecker product. Noise n and clutter c are N MN × 1 independent zero-mean complex Gaussian with known N MN × N MN covariance matrices Mc+n = E[(c + n)(c + n)H]. It is noted that Mc+n is positive semidefinite and Hermitian symmetric [Reference van den Bos7]. The superscript H indicates conjugate transpose of a matrix.
According to the CLT of the probability theory [Reference Kobayashi, Mark and Turin8], if a large number of clutters from different sources (scattered from different objects) are accumulated, the statistical distribution of the sum will approach Gaussian distribution. Recalling that our scenario takes place in a cluttered indoor environment, which is with plenty of various scatterers. We assume that clutter c and noise n here could satisfy, or approach Gaussian distribution due to the “time-delay & accumulation” operations in the signal enhancement procedure. Hence, our detection problem becomes searching targets in Gaussian clutter and noise.
V. DETECTION
A) Detection problem formulation
For the detection, we define the two hypotheses:
 $${H_{0\colon }}\; {\bf y} = {\bf c} + {\bf n}\; \colon \; {\rm Clutter}\; {\rm and}\; {\rm noise}\; {\rm only\comma \; }$$
 $${H_{1\colon }}\; {\bf y} = {\bf x} + {\bf c} + {\bf n}\; \colon \; {\rm Target}\; {\rm plus}\; {\rm clutter}\; {\rm and}\; {\rm noise} .$$
The task is to observe the return vector y and decide which of the two hypotheses best describes the observed vector.
Suppose p(y/H 0) and p(y/H 1) are the conditional probability density functions of the observed vector y. The log-likelihood ratio test can be given by
 $$\eqalign{& \bar \Lambda \lpar {\bf y}\rpar = \ln \displaystyle{{p\lpar y/{H_1}\rpar } \over {p\lpar y/{H_0}\rpar }} \geq {{\bar k}_{th}}\comma \; \quad {H_1}\, \hbox{is}\, \hbox{true} \cr & \bar \Lambda \lpar {\bf y}\rpar = \ln \displaystyle{{p\lpar y/{H_1}\rpar } \over {p\lpar y/{H_0}\rpar }}\rpar \lt {{\bar k}_{th}}\comma \; \quad {H_0}\, \hbox{is}\, \hbox{true}\comma \; } $$
where  ${\bar k_{th}}$ is the threshold.
 $\bar \Lambda \lpar {\bf y}\rpar $ can be further expressed as
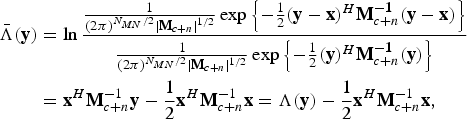 $$\eqalign{{\bar \Lambda ({\bf y})} &= \ln{{1 \over (2\pi )^{{N_{MN}}/2}\vert{\bf M}_{c + n} \vert^{1/2}}\exp \left\{- {1 \over 2}({\bf y} - {\bf x})^H {\bf M}_{c + n}^{ - \bf 1} ({\bf y} - {\bf x})\right\}\over{1 \over (2\pi )^{{N_{MN}}/2}\vert{\bf M}_{c + n} \vert^{1/2}}\exp \left\{- {1 \over 2}({\bf y})^H {\bf M}_{c + n}^{ - \bf 1} ({\bf y})\right\}} \cr & ={\bf x}^H {\bf M}_{c + n}^{-1} {\bf y} - {1 \over 2} {\bf x}^{H}{\bf M}_{c + n}^{ - 1} {\bf x} = \Lambda ({\bf y}) - {1 \over 2}{\bf x}^{H}{\bf M}_{c + n}^{ - 1} {\bf x},}$$
where |Mc+n| denotes the determinant of Mc+n, and Mc+n−1 denotes the inverse of Mc+n. Herein, the property of Hermitian symmetric matrix is used, and let
 $${\Lambda \lpar {\bf y}\rpar } = {{\bf x}^H}{{\bf M}_{c + n}^{ - 1}} {\bf y}.$$
Thus, the likelihood ratio test becomes
 $$\eqalign{& {\Lambda \lpar {\bf y}\rpar } \geq {k_{th}}\comma \; \quad {H_1}\, \hbox{is}\, \hbox{true}\comma \; \cr & \Lambda \lpar {\bf y}\rpar \lt {k_{th}}\comma \; \quad {H_0}\, \hbox{is}\, \hbox{true}\comma \; } $$
where the threshold k th is defined as
 $${k_{th}} = {\bar k_{th}} + {1 \over 2}{{\bf x}^H}{\bf M}_{c + n}^{ - 1} {\bf x}.$$
B) Detector
Based on (16), (17), a detector could be given as
 $${\bf h} = {\bf M}_{c + n}^{ - 1} {\bf x} = {\bf M}_{c + n}^{ - 1} \lpar {\bar{\bf s}^{ref}} \otimes {\bf K}\rpar .$$
In fact, it is a matched filter detector, and we have Λ(y) = hHy. The matrix K could be set based on the values of γ j,i or Ωj,i given by (A.7) or (A.11).
The detector h can be further expressed as h = [h1, h2, ..., hN]T, where the element hi ≜ [h (i−1)·N+1, h (i−1)·N+2,…, h (i−1)·N+M]T. For example, h1 = [h 1, h 2,…, h M]T, h2 = [h N+1, h N+2,…, h N+M]T, and so on. Similarly, we have y = [y1, y2,…, yN]T, where the element yi is defined as yi ≜ [y (i−1)·N+1, y (i−1)·N+2,…, y (i−1)·N+M]T. Here, the symbol i in the subscript is the index of the transmission positions.
The output of the matched filter detector can be given as
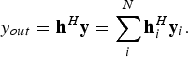 $${y_{out}} = {{\bf h}^H}{\bf y} = \sum\limits_i^N {\bf h}_i^H {{\bf y}_i}.$$
It gives a coherent combination of signals from N-transmission positions as shown in Fig. 1. In order to lose the requirement of the phase synchronization between different transmissions, we can incoherently combine the data from different transmissions, by
 $${y_{out}} = \sum\limits_i^N \vert {{\bf h}_i^H {{\bf y}_i}} \vert .$$
In fact, hiHyi in both (19) and (20) can be regarded the detection result obtained at a certain individual transmission position T i. Then, the final output of the detector could be a coherent combination of the individual detection result hiHyi as given in (19), or an incoherent combination of all the individual detection results as given in (20).
C) Threshold and performance
The probability of detection in (19), and false alarm can be given as
 $${P_d} = 1 - \Phi \lpar {{{k_{th}} - {{\bf h}^H}{\bf x}} \over D}\rpar \comma \; $$
 $${P_f} = 1 - \Phi \left({{{{k_{th}}} \over D}} \right)\comma \; $$
where 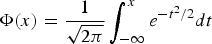 $\Phi \lpar x\rpar = {1 \over {\sqrt {2\pi } }}\int_{ - \infty }^x {e^{ - {t^2}/2}}dt$, and the parameter D is defined as
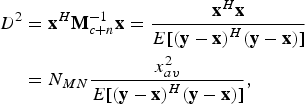 $$\eqalign{{D^2} & = {{\bf x}^H}{\bf M}_{c + n}^{ - 1} {\bf x} = {{{{\bf x}^H}{\bf x}} \over {E[ {{{\lpar {\bf y} - {\bf x}\rpar }^H}\lpar {\bf y} - {\bf x}\rpar } ] }} \cr & = {N_{MN}} {{x_{av}^2 } \over {E[ {{{\lpar {\bf y} - {\bf x}\rpar }^H}\lpar {\bf y} - {\bf x}\rpar } ] }}\comma} \; $$
where x Reference Moura and Jin2av is the average signal power of x. Generally,
 $${{x_{av}^2 } \over {E[ {{{\lpar y - x\rpar }^H}\lpar y - x\rpar } ] }}$$
can be regarded as the SINR at the output of the detector [Reference Poor9].
In terms of Neyman–Pearson criterion, the threshold k th could be set as
 $${k_{th}} = D\Phi \lpar 1 - {P_f}\rpar .$$
Correspondingly, the detection probability can be further given as P d = 1 − Φ(Φ−1(1 − P f) − D).
VI. MEASUREMENT RESULTS
The measurement environment is shown in Fig. 5(a). A UWB M-sequence pseudo-noise radar developed by Ilmenau University of Technology in cooperation with MEODAT company [Reference Zetik, Sachs and Thoma10] is used in the measurement. The sensor setup is given by Fig. 5(b). The transmitter moves along track Ll, and illuminating the surroundings meanwhile. It is mounted on a program-controlled positioning unit (as shown in Fig. 5(a), the column-like object, which is attached on a rail mounted at the ceiling of the room). The positioning unit allows precise positioning of the transmitter antenna with 0.75 mm precision in two directions. The target is a concrete brick-like object with a square planar-surface (50 cm × 50 cm) as shown in Fig. 5. It is located at x = 24 cm in the track Ll, with an orientation angle 60°. R 1–R 4 are four receivers, receiving the scattered signals from the surroundings. They are located at different directions with respect to the target. The transmitter–target–receiver angles are 13.9°, 20.3°, 26.3°, and 31.7°, respectively. The antennas of the transmitter and receivers are omnidirectional and horn antennas, respectively. As shown in Fig. 5(b), R 1 and R 2 are located in the same room with the target and the transmitter, whereas R 3 and R 4 are located behind a 20-cm-thick concrete wall. Figure 6 shows the signals received by R 1–R 4. Apparently, excess time-delays exist in the signals received by R 3 and R 4. However, there is no excess time-delay for the signal received by R 1 and R 2.
Measurement setup. (a) measurement environment. The target is a concrete brick-like object with a diffuse surface. The receivers placed behind the wall are not shown in the picture. (b) Sensor setup. The target is located at x = 24 cm on the line L l, with an orientation angle θ = 60°.
Measured signals in a realistic environment given by Fig. 5(a). The red vertical line: the theoretical position of the direct-path; the first blue peak: direct-path. The vertical axis: normalized amplitude.
In a realistic indoor environment, the response of the target is mixed with clutter and noise at the receivers. Typically, the clutter comes from objects in 3D space, such as walls, furniture, the ceiling, and also the ground, etc. Owing to the complexity of indoor environment, in a high probability, clutter is not weaker than the response of the target. In order to get a reliable detection, our first step is to enhance the responses in the line under exploration via a “time-shift & accumulation” scheme, in which the signals recorded at different transmission positions are time-shifted, aligned, and accumulated according to (5). After “time-shift & accumulation” operation, the data are projected onto the reference vector direction. This is realized by a resampling operation. Figure 7 shows the spectrum-shifts after data-projection. In the figure,  ${f_{{R_1}}}{\rm \sim }{f_{{R_4}}}$ are the frequencies at which the spectra have the maximum values. Theoretically, if the target presents in the scenario, for the data acquired at the true target position and orientation, the differences between
 ${f_{{R_i}}}$ and
 ${f_{{R_j}}}$ (
 ${f_{{R_i}}}\comma \;{f_{{R_j}}} \in [ {f_{{R_1}}}\comma \;{f_{{R_2}}}\comma \;{f_{{R_3}}}\comma \;{f_{{R_4}}}] $) should satisfy (A.7) or (A.11). Furthermore,
Measured spectrum-shifts. (a) Spectrum-shift in a “true target position, true target orientation” condition. (b) Spectrum-shifts in a “false target position, true target orientation” condition. (c) Spectrum-shifts in a “true target position, false target orientation” condition.
 $${{{f_{{R_i}}} - {f_{{R_1}}}} \over {{f_{{R_j}}} - {f_{{R_1}}}}} = {{{\gamma _{i\comma 1}} - 1} \over {{\gamma _{j\comma 1}} - 1}}$$
should also be satisfied.
Figure 7(a) shows the measured result obtained at the true target position and orientation. It is shown that the results approach
 $${{{f_{{R_i}}} - {f_{{R_1}}}} \over {{f_{{R_j}}} - {f_{{R_1}}}}} \approx {{{\gamma _{i\comma 1}} - 1} \over {{\gamma _{j\comma 1}} - 1}}.$$
However, Figs 7(b) and 7(c) are obtained under the condition of “false position, true orientation” and “true position, false orientation”, respectively. Their results can rarely satisfy (24). As compared with (A.7) and (A.11), (24) does not demand the absolute value of ω c, so that it is more convenient to be utilized in practice.
In Fig. 8, it shows the output of the detector when the transmitter locates at x = 200 cm, searching for the target position and orientation area.
In order to further fuse the detection results obtained at different transmission positions, the final detection could be a coherent/incoherent combination of these results according to (19) or (20). Figure 9(a) shows the estimates of the target position at different transmission positions. Figure 9(b) shows the estimated orientations. In the figures, the results for different data accumulation ranges,  $c \cdot t_{{T_n}\comma {{T \prime}_n}}^{diff} $, are provided. Accumulation 1 and 2 in the figures correspond to
 $c \cdot t_{{T_n}\comma {{T_n^ \prime}}}^{diff}$ = 10 cm and 20 cm, respectively. It is seen that their values are distributed around the true values. As indicated by the horizontal lines, the final outputs of the coherent detector are (25 cm, 61.7°) are (24.2 cm, 60.8°) for “Accumulation 1” and “Accumulation 2”, respectively. The final outputs of the incoherent detector are (26 cm, 61.9°) and (25.2 cm, 61.0°) for “Accumulation 1” and “Accumulation 2”, respectively. It is shown that the results for “Accumulation 2” are better than “Accumulation 1” under given conditions. The results when without the data enhancement procedure is not shown in the figures, because there would be no effective results in this case.
VII. CONCLUSIONS
A stationary object detection problem in an unknown indoor environment is discussed in the paper. A “time-shift & accumulation” scheme is proposed, and a spectrum-shift-dependent detector is constructed. Using a “time-shift & accumulation” scheme, the responses of the target are time-shifted, aligned, and accumulated, while clutter from different sources is non-uniformly time-shifted and accumulated. As a consequence, the signal is enhanced, and the SINR is increased. Since the concerned target is a planar-surface object, spectrum-shift information is used to construct the detector. It is shown that this spectrum-shift information is angular-dependent, so that it is not affected by the excess time-delays incurred by walls. In fact, spectrum-shifts discussed in the paper can be regarded as a kind of angular diversity information. The property of angular diversity of a planar-surface object is distinct from other objects in the surroundings. Hence, based on this difference (or deviation), our detector is designed. In this sense, angular diversity information is used in our detector designing. In addition, the transmission positions are assumed exactly known in the paper. That is the positioning error is not considered. In our next step research, the influences of the positioning errors will be investigated, and the performance will be further evaluated under different wall parameter (e.g. thickness, orientation, material, etc.) conditions.
The output of the detector when the transmitter locates at x = 200 cm.
Detection results. (a) Position estimates at different transmission positions. (b) Orientation estimates at different transmission positions. The ranges of “time-shift & accumulation” operation: 10 cm (Accumulation 1), 20 cm (Accumulation 2). The horizontal lines indicate the final detection results under different conditions, the “cross-dash-dot” line: “incoherent detector, accumulation 1”; The “star-dash-dot” line: “incoherent detector, accumulation 2”. The other horizontal lines are the final results of the coherent detector.
APPENDIX
For explanation simplicity, we suppose that the transmitted signal is an impulse signal δ(t), then after passing through the down converter, the signal which is transmitted by T n and then received by R i, can be expressed as
 $${\tilde s_{{R_i}\comma {T_n}}}\lpar t\rpar = \int \sigma \lpar {\bf X}\rpar \delta \lpar {t - t^\prime}\lpar {{\bf R}_i}\comma \; {\bf X}\comma \; {{\bf T}_n}\rpar \rpar \exp \lpar - j{\omega _c}t\rpar d{\bf X}\comma \;$$
where ω c is the central frequency of the system, σ(X) is the complex reflectivity of the scatterer X, and σ is a Gaussian distribution variable with  $\sigma {\rm \sim }N\lpar 0\comma \;\sigma _0^2 \rpar $. It can be further simplified as
 $${\tilde s_{{R_i}\comma {T_n}}}\lpar t^\prime\lpar {{\bf R}_i}\comma \; {\bf X}\comma \; {{\bf T}_n}\rpar \rpar = \sigma \lpar {{\bf k}^{ - {\bf 1}}}\lpar {\bf t}\rpar \rpar \exp \, \lpar - j{\omega _c}t^\prime\lpar {{\bf R}_i}\comma \; {\bf X}\comma \; {{\bf T}_n}\rpar \rpar \comma \; $$
where κ −1(·)) is the inverse function of κ(·), and κ(X) = t′(Ri, X, Tn). Using (8), the data are projected onto the reference direction defined by pref. It can be further transformed into an expression with a new variable τ,
 $${\hat s_{{R_i}\comma {T_n}}}\lpar \tau \rpar = \sigma \lpar {{\bf X}_{\bf 0}} + {\bf t}{{\bf p}_{ref}}{\bf /}{\vert {{{\bf p}_{ref}}} \vert ^{\bf 2}}\rpar \exp \!\lpar\!\! -\! j{\omega _c}t^\prime\lpar {{\bf R}_i}\comma \; {{\bf X}_0}\comma \; {{\bf T}_n}\rpar - j{\omega _c}\tau \rpar . $$
The corresponding Fourier transform with respect to the variable τ can be given as
 $${\hat S_{{R_i}\comma {T_n}}}\lpar \bar \omega \rpar = {\sigma _F}\lpar \bar{\bf w} + {{\bf w}_{\bf c}}\rpar \exp \lpar\! -\! j{\omega _c}t^\prime \lpar {{\bf R}_i}\comma \; {\bf X}\comma \; {{\bf T}_n}\rpar \rpar \comma \; $$
where  ${\hat S_{{R_i}\comma {T_n}}}\lpar \bar \omega \rpar $ and
 ${\sigma _F}\lpar \bar{\bf w}\rpar $ are the Fourier transforms of
 ${\hat s_{{R_i}\comma {T_n}}}\lpar \tau \rpar $ and
 $\sigma \lpar {{\bf X}_{\bf 0}} + {\bf t}{{\bf p}_{ref}}{\bf /}{\vert {{{\bf p}_{ref}}} \vert ^{\bf 2}}\rpar $ with respect to the variable τ, respectively.
Consider the signal received by another receiver R j, whose reception angle is different from that of R i, as shown in Fig. 3. The time delay within the transmitter T n, the scatterer X, and the receiver R j is given in (9). Similar to the analysis above, after projecting the data onto the same reference direction, the signal can be given as [Reference Prati and Rocca11]
 $${\hat s_{{R_j}\comma {T_n}}}\lpar \tau \rpar \approx \sigma \lpar {{\bf X}_{\bf 0}} + \tau\;\;\; {{\bf p}_{ref}}{\bf /}{\vert {{{\bf p}_{ref}}} \vert ^{\bf 2}}\rpar \exp \!\lpar\!\! -\! j{\omega _c}t^\prime\lpar {{\bf R}_j}\comma \; {{\bf X}_{\bf 0}}\comma \; {{\bf T}_n}\rpar - j{\omega _c}{\gamma _{j\comma i}}\tau \rpar . $$
Similarly, in the frequency domain, it is given as
 $${\hat S_{{R_j}\comma {T_n}}}\lpar \bar \omega \rpar = {\sigma _F}\lpar \bar{\bf w} + {{\bf g}_{j\comma i}}{{\bf w}_{\bf c}}\rpar \exp \lpar - j{\omega _c}t^\prime\lpar {{\bf R}_j}\comma \; {{\bf X}_{\bf 0}}\comma \; {{\bf T}_n}\rpar \rpar . $$
Statistically, it can be proofed that the cross-correlation of  ${\hat S_{{R_i}\comma {T_n}}}\lpar \bar \omega \rpar $,
 ${\hat S_{{R_j}\comma {T_n}}}\lpar \bar \omega \rpar $ can be given as
 $$\eqalign{& E[ {\hbox{corr}\lpar {{{\hat S}_{{R_i}\comma {T_n}}}\lpar \bar \omega \rpar \comma \; {{\hat S}_{{R_j}\comma {T_n}}}\lpar \bar \omega \rpar } \rpar } ] \approx \sigma _0^2 \hbox{W}\lpar {\bar \omega + {\omega_c}\lpar {\gamma_{j\comma i}} - 1\rpar } \rpar \cdot \cr & \quad \exp \lpar {j{\omega_c}t^\prime\lpar {{\bf R}_j}\comma \; {{\bf X}_{\bf 0}}\comma \; {{\bf T}_n}\rpar - j{\omega_c}t^\prime\lpar {{\bf R}_i}\comma \; {{\bf X}_{\bf 0}}\comma \; {{\bf T}_n}\rpar } \rpar \comma \;} $$
where E[·] is a mathematical expectation operator, corr(·,·) is a cross-correlation operator. σ 0Reference Moura and Jin2 is the variance of the reflectivity of scatterers. W(·) is the output of the correlation operation between the windows functions determined by the frequency range of the spectrum. Constant amplitude is omitted in (A.7). This result is firstly proofed and testified by C.Prati and F.Rocca in a spaceborne radar imaging scenario [Reference Prati and Rocca11].
According to (A.6), apparently, ω c(γ j,i − 1) is the relative spectrum shift between  ${\hat S_{{R_i}\comma {T_n}}}\lpar \bar \omega \rpar $ and
 ${\hat S_{{R_j}\comma {T_n}}}\lpar \bar \omega \rpar $. According to (10), the relative spectrum shift can be further expressed as
 $${\Omega _{j\comma i}} = {\omega _c}\lpar {\gamma _{j\comma i}} - 1\rpar = {\omega _c}{{\lpar {{\bf U}_{{R_j}\comma {X_0}}} - {{\bf U}_{{R_i}\comma {X_0}}}\rpar } \over {{{\bf V}_{bi}} \cdot \Delta {\bf X}}}. $$
As shown in Fig. 3, the symbol A stands for the target-surface plane. e1 is the unit vector of the projection of Vbi on the target-surface plane. We define another two unit vectors e2, e3 as
 $${{\bf e}_2} = {{{{\bf e}_1} \times {{\bf V}_{bi}}} \over {\vert {{{\bf e}_1} \times {{\bf V}_{bi}}} \vert }}\comma \; \quad {{\bf e}_3} = {{{{\bf e}_1} \times {{\bf e}_2}} \over {\vert {{{\bf e}_1} \times {{\bf e}_2}} \vert }}\comma \; $$
where “ × ” denotes “cross product” or vector product. If we regard the unit vectors e1, e2, e3 as a set of basis vectors, {e1, e2, e3} would span a 3D space  ${{\open R}^3}$, in which {e1, e2} spans the target-surface plane A. Apparently, e3 is located in the normal direction of the plane A, and we have e1·e2 = Vbi·e2 = 0.
As shown in Fig. 3, ΔX is a vector locating on the target-surface plane A. It can be decomposed as
 $${\Delta {\bf X}} = {x_{e1}}{{\bf e}_1} + {x_{e2}}{{\bf e}_2}. $$
In (A.7), the value of  $\lpar {{\bf U}_{{R_j}\comma {X_0}}} - {{\bf U}_{{R_{i\comma }}{X_0}}}\rpar $ depends on the relative position of the vectors Ri and Rj. If we adjust the relative positions of Ri and Rj, so as to let
 $\lpar {{\bf U}_{{R_j}\comma {X_0}}} - {{\bf U}_{{R_i}\comma {X_0}}}\rpar \cdot {{\bf e}_2} = 0$ is satisfied. Thus, we have
 $$\lpar {{\bf U}_{{R_j}\comma {X_0}}} - {{\bf U}_{{R_i}\comma {X_0}}}\rpar \cdot \lpar {{\bf e}_1} \times {{\bf V}_{bi}}\rpar = 0. $$
It implies that the vector  $\lpar {{\bf U}_{{R_j}\comma {X_0}}} - {{\bf U}_{{R_i}\comma {X_0}}}\rpar $ is parallel to the plane B, which is spanned by {e1, e3} or {e1, Vbi}, as shown in Fig. 3.
Let  ${\tilde{\bf U}_{{R_i}\comma {X_0}}}$ and
 ${\tilde{\bf U}_{{R_j}\comma {X_0}}}$ denote the projections of
 ${{\bf U}_{{R_i}\comma {X_0}}}$ and
 ${{\bf U}_{{R_j}\comma {X_0}}}$ on the plane B, respectively. And
 ${\theta _{{R_i}}}$,
 ${\theta _{{R_j}}}$ are the angles formed by the vector
 ${\tilde{\bf U}_{{R_i}\comma {X_0}}}$ and e3,
 ${\tilde{\bf U}_{{R_j}\comma {X_0}}}$ and e3, respectively. That is,
 ${\theta _{{R_i}}}$ and
 ${\theta _{{R_j}}}$ are, respectively, the reflection angles of the projections of and Rj onto the plane B. Apparently,
 $\hbox{sin}{\theta _{R_j}} = {\tilde{\bf U}_{{R_j}\comma {X_0}}} \cdot {{\bf e}_1}$,
 $\hbox{sin}{\theta _{R_i}} = {\tilde{\bf U}_{{R_i}\comma {X_0}}} \cdot {{\bf e}_1}$. Hence, after some calculations, (A.7) can be further simplified as
 $${\Omega _{j\comma i}} = {\omega _c}\lpar {\gamma _{j\comma i}} - 1\rpar = {\omega _c}{{\hbox{sin}{\theta _{{R_j}}} - \hbox{sin}{\theta _{{R_i}}}} \over {\vert {{{\bf V}_{bi}}} \vert \hbox{sin}{\theta _{bi}}}} \approx {\omega _c} {{{\theta _{{R_j}}} - {\theta _{{R_i}}}} \over {\vert {{{\bf V}_{bi}}} \vert {\theta _{bi}}}}\comma \; $$
where θ bi is the angle between the vector Vbi and e3.
Honghui Yan received his B. Sc. degree in Information & Communication Engineering from Shanxi University, Taiyuan, China, in 1997 and M. Sc. degree from Armored Force Engineering College, Beijing, China, in 2002 and Ph. D. degree from the Institute of Electronics, Chinese Academy of Sciences (IECAS), Beijing, China, in 2005. From 2005 to 2008, he was a Research Associate with the airborne radar R&D Department of IECAS, where he conducted research in the field of Synthetic Aperture Radar (SAR) signal processing, bi/multistatic radar theory, as well as SAR interferometry. And then he worked in the field of UWB radar system with the Electronic Measurement Research Laboratory (EMT) at Ilmenau University of Technology, Germany. Currently, he is working for MIMO radar in Sony EuTEC. His research interests include Radar Imaging and Detection, Localization and Tracking, MIMO Radar, as well as Digital Signal Processing.
 Qiaozhen Liu received her Ph.D degree at BeiHang University in 2005. Currently she is working for Beijing Institute of Astronautical Systems Engineering. She is a professor in the field of signal processing and astronautical system design.
 Prof. Dr.-Ing. R. Thomä received the Dipl.-Ing. (M.S.E.E.), Dr.-Ing. (Ph.D.E.E.), and the Dr.-Ing. habil. degrees in electrical engineering and information technology from Technische Hochschule Ilmenau, Germany, in 1975, 1983, and 1989, respectively.
From 1975 to 1988, he was a Research Associate in the fields of electronic circuits, measurement engineering, and digital signal processing at the same university. From 1988 to 1990, he was a Research Engineer at the Akademie der Wissenschaften der DDR (Zentrum für Wissenschaftlichen Gerätebau). During this period, he was working in the field of radio surveillance. In 1991, he spent a three-month sabbatical leave at the University of Erlangen-Nürnberg (Lehrstuhl für Nachrichtentechnik). Since 1992, he has been a Professor of electrical engineering (electronic measurement) at TU Ilmenau where he was the Director of the Institute of Communications and Measurement Engineering from 1999 until 2005. With his group, he has contributed to many European and German research projects and clusters such as WINNER, PULSERS, EUWB, NEWCOM, COST 273, 2100, EASY-A, EASY-C. Currently he is the speaker of the German nation-wide DFG-focus project UKoLOS, Ultra-Wideband Radio Technologies for Communications, Localization and Sensor Applications (SPP 1202). Since 1999 he has been serving as chair of the IEEE-IM TC-13 on Measurement in Wireless and Telecommunications. In 2007 he was awarded IEEE Fellow Member and received the Thuringian State Research Award for Applied Research both for contributions to high-resolution multidimensional channel sounding. His research interests include measurement and digital signal processing methods (correlation and spectral analysis, system identification, array methods, time-frequency and cyclostationary signal analysis), their application in mobile radio and radar systems (multidimensional channel sounding, propagation measurement and parameter estimation, ultra-wideband radar), measurement-based performance evaluation of MIMO transmission systems, and UWB sensor systems for object detection and imaging.




