INTRODUCTION
The alluvial plains between the rivers of Tigris and Euphrates in Iraq, known as Southern Mesopotamia, witnessed the emergence of humanity’s first sedentary, urbanized, and literate societies during the Early Bronze Age. The appearance of the very first cuneiform texts recording sentences in Sumerian, an extinct language isolate, was preceded by centuries of experimentation with a variety of methods of symbolic representation, mainly for the purpose of administration (Schmandt-Besserat Reference Schmandt-Besserat1979; Nissen et al. Reference Nissen, Damerow and Englund1993). Other important cultural achievements of the Mesopotamians, such as the development of early bureaucracy, statehood, legal systems, literature, philosophy, arithmetic, and astronomy, heavily influenced the later Biblical and Classical traditions. The very first historical period in Mesopotamia, known as the Early Dynastic (ED), is conventionally dated to about 3000/2900–2334 BC (Postgate Reference Postgate1992: 22; Sallaberger and Schrakamp Reference Sallaberger and Schrakamp2015: 6; van de Mieroop Reference van de Mieroop2016). The period was traditionally divided into three main subunits, ED I → ED II → ED III, based on the pottery profiles from excavations in Northern Mesopotamia (Delougaz Reference Delougaz1952). However, later reconsiderations of the archaeological material from the Near East led most researchers to abandon the distinction between ED I and II, preferring the periodization scheme ED I/II → ED IIIa → ED IIIb, with ED III being split into two subunits based on pronounced differences in the written material (e.g. Porada et al. Reference Porada, Hansen, Dunham and Babcock1992: 107; Evans Reference Evans2007).
There are numerous problems with the study of the Early Dynastic period’s chronology. Firstly, it is well known that some of the most significant bodies of material culture and textual information from Southern Mesopotamia are deprived of a satisfactory context, either due to poor archaeological practice or looting (Zettler Reference Zettler2003: 9; Rothfield Reference Rothfield2009; Williams Reference Williams2013). Secondly, while the texts from the later parts of the Early Dynastic period (ED IIIb) are quite numerous and provide valuable information about the sequences of Mesopotamian rulers, their dynasties, diplomatic and military activities, earlier ED texts are much scarcer and often difficult to fully interpret, rendering traditional historical methodologies inadequate (Sallaberger and Schrakamp Reference Sallaberger and Schrakamp2015: 3). Thirdly, the fact that any chronological inquiry of that period operates on the transition from prehistory to history raises a number of conceptual and methodological difficulties stemming from academic fractionation—the insufficient dialogue between researchers in various disciplines including archaeology, archaeological science, history, and philology.
The lack of sufficient historical and archaeological sources for the earlier part of the Early Dynastic period has often left researchers reliant on texts of questionable historical value, such as mythological compositions or chronicles. Perhaps most importantly, the Sumerian King List (SKL), a text composed probably during the early 21st century BC (Michałowski Reference Michałowski1983; Steinkeller Reference Steinkeller2003), lists the consecutive rulers of Mesopotamia and the lengths of their reigns. While the later parts of the SKL chronology corroborate well with other historical sources, the parts describing the first half of the 3rd millennium BC contain ambiguities and gradually descend into incredulous and mythical accounts. The problems with using semi-historical texts such as the SKL for chronological studies are generally recognized by the research community and yet are used for want of a better source of information (Nissen Reference Nissen1987; Frayne Reference Frayne2009: 39; Marchesi and Marchetti 2011; Sallaberger and Schrakamp Reference Sallaberger and Schrakamp2015: 13).
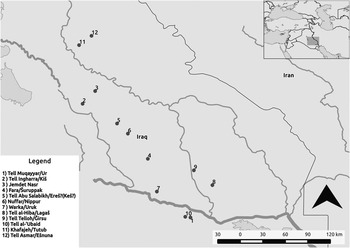
The application of scientific dating to the problems of Early Bronze Age chronology in the Near East and North Africa is not a new idea (Mellaart 1979; Hassan and Robinson Reference Hassan and Robinson1987; Bruins and Mook Reference Bruins and Mook1989; Waterbolk Reference Waterbolk1994; Bruins et al. Reference Bruins, Plicht van der and Mook1991; Bruins Reference Bruins2001; van der Plicht and Bruins Reference van der Plicht and Bruins2001). Indeed, radiocarbon dates from Southern Mesopotamian contexts were among the very first published in Radiocarbon (Barker and Mackey Reference Barker and Mackey1961; Stuckenrath Reference Stuckenrath1963; Stuckenrath and Ralph Reference Stuckenrath and Ralph1965; Stuckenrath et al. Reference Stuckenrath, Coe and Ralph1966). 14C dating remained, however, tangential to the constructions of Mesopotamian chronologies. Given the large measurement uncertainties associated with the 14C measurements made in the 1960s, many of the dates were too imprecise to be relevant to historical research. Patchy archaeological contexts and poor preservation of organic remains in the Southern Mesopotamian soil further exacerbate the problem of the tenuous chronologies for the Early Dynastic period. My ongoing doctoral research project aims to address this problem by constructing Bayesian models based on available archaeological and textual information in order to constrain the uncertainties of the 14C dates. In the future, the project will involve producing new 14C dates from a number of important archaeological sites in Iraq and Syria to enhance our understanding of the period (Figure 1). The models discussed here present my preliminary results of the analysis of published 14C dates.
Map of Southern Mesopotamia, showing the most important Early Dynastic sites

RADIOCARBON DATES AND MODEL SPECIFICATION
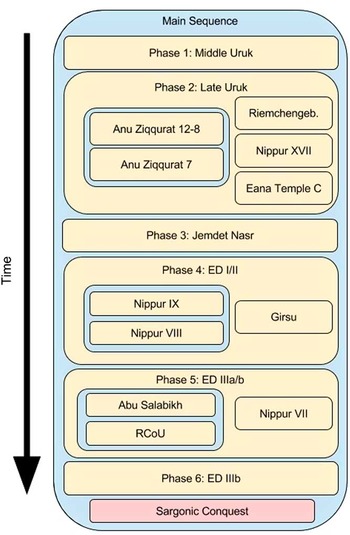
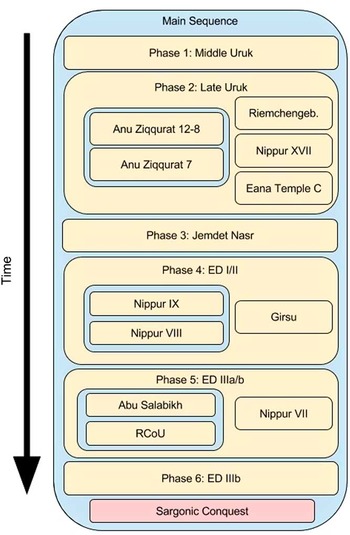
All calibration and Bayesian modeling has been performed using OxCal v 4.2 (Bronk Ramsey Reference Bronk Ramsey2009a; Bronk Ramsey and Lee Reference Bronk Ramsey and Lee2012) and the IntCal13 calibration curve (Reimer et al. Reference Reimer, Bard, Bayliss, Beck, Blackwell, Bronk Ramsey, Grootes, Guilderson, Haflidason, Hajdas, Hatté, Heaton, Hoffmann, Hogg, Hughen, Kaiser, Kromer, Manning, Niu, Reimer, Richards, Scott, Southon, Staff, Turney and van der Plicht2013). See the Appendix (online Supplementary Material) for the full list of 14C dates considered in this study. Dates that could not be securely associated with a well-defined archaeological context were excluded as outliers. After an initial run of the model, dates that did not correspond well with the overall model (Agreement index falling below 60%, see Bronk Ramsey Reference Bronk Ramsey2009b) were excluded from the analysis. Possible reasons for these dates being outliers (highlighted red in the Appendix) are discussed on a case-by-case basis below. Since a large number of the 14C measurements were performed on old wood or charcoal, the Charcoal_Plus Outlier model was used for these samples (see Bronk Ramsey Reference Bronk Ramsey2009b and Dee and Bronk Ramsey Reference Dee and Bronk Ramsey2014 for details). Dee and Bronk Ramsey (Reference Dee and Bronk Ramsey2014) demonstrated using simulations and experiments that this outlier model is extremely useful for correcting dates likely affected by inbuilt age. Since the information about the species of Mesopotamian samples is usually missing, the Charcoal_Plus model was deemed necessary, as it accounts for the possibility of the wood being either medium- or long-lived, as well as younger than the associated archaeological material due to potential context disturbance. The General model was used for short-lived samples to account for possible perturbations in the archaeological contexts. Figure 2 shows a schematic representation of the Bayesian model, described in detail below. The periods were modeled as consecutive phases in a sequence. The transition between Jemdet Nasr and ED I/II was the sole exception, where two boundaries have been defined to represent the end of JN and the start of ED as separate events. This was due to the apparent hiatus of ~200 yr between the two groups of dates. See Bronk Ramsey (Reference Bronk Ramsey2009a) for the details of the modeling process using the CQL language.
A schematic representation of the OxCal Bayesian model used in this study. Blue boxes represent sequences (informative prior), while yellow boxes show phases (uninformative prior). The red box shows the cut-off date (terminus ante quem) model, taken to be 2334 BC. Please refer to the online version of the article to view the figure in color.
Phase 1 - Middle Uruk
Four short-lived plant samples and one charcoal date from the site of Abu Salabikh have been reported and discussed by Wright and Rupley (Reference Wright and Rupley2001). The samples were associated with copious amounts of Middle Uruk ceramic material. This assemblage, characterized especially by the presence of the famous beveled-rim bowls and certain jar types, is spread across a large area, from eastern Anatolia and Syria in the west to eastern Iran in the east. For the purpose of this analysis, the Middle Uruk is treated as the lower boundary of the sequence. The wide geographic spread of the Uruk culture makes the study of its chronology a complex subject beyond the scope of this paper. Only dates from Southern Mesopotamian sites were included in order to avoid possible regional differences affecting the overall model.
Phase 2 - Late Uruk
Phase 2 corresponds to the Late Uruk period, often associated with the building phase IV of the Eana sanctuary at the eponymous site of Uruk, modern Warka. This building phase was associated with the administrative protocuneiform texts that were the immediate predecessor of the first writing systems (Englund and Boehmer Reference Englund and Boehmer1994; Englund Reference Englund1998). A considerable number of 14C dates on material from Uruk were published by van Ess (Reference van Ess2013, Reference van Ess2015); however, only some of them were listed with archaeological contexts that permit reliable modeling. Dates from the Anu Ziqqurat were divided into two consecutive ages: 2a (Bauschichten 12-8) and 2b (Bauschichten 7). One date from these Anu Ziqqurat contexts (UGAMS-12441) was significantly younger than the remainder of the samples, most likely due to the sample having been conserved post-excavation. Out of the seven dates from the Riemchengebäude, three dates (UGAMS-12435, -12137, -20149) were identified as outliers due to them being significantly older than expected. This was not surprising as the original context was a fill containing ceramics characteristic for earlier periods. Though there are a number of 14C dates from Temple C in the Eana district of Uruk, these were not included in the model, as a much more reliable and precise dendrochronological date is available (Heußner in van Ess Reference van Ess2015), which provides the minimum age for the construction of the temple. It was modeled as a date uniformly distributed between 3290 and 3245 cal BC (see model code for coding). Finally, a single Late Uruk date from the site of Nippur came from Level XVII of the Inana Temple (Hansen and Dales Reference Hansen and Dales1962). The unmodeled calibrated date range of the Nippur date corresponds well with the Anu Ziqqurat samples.
Phase 3 - Jemdet Nasr
The Jemdet Nasr period, also referred to as “Terminal Uruk” or “Uruk III,” is usually thought of as a breakdown of the Uruk world system, giving way to a number of regional cultural complexes. In Southern Mesopotamia, this period is often associated with a distinctive type of painted pottery. Protocuneiform texts continued to be used and were found in large numbers both at Uruk and at the eponymous site of Jemdet Nasr. The only available dates that can be linked with some credibility to this period come from Uruk (van Ess Reference van Ess2015). The first pair of samples was collected from the square Md 15-4, where the samples had an indirect connection with Jemdet Nasr pottery. A further four dates on bulk samples of ash from fire installations in the domestic contexts of Archaische Siedlung area turned out to be problematic, as only one sample (UGAMS-20154) produced a date coherent with the rest of the data set. Since the three remaining dates were considerably older than expected, it is probable that the installations were used for a long period of time and contained earlier material.
Phase 4 - ED I/II
The transition to the Early Dynastic period is marked by several innovations in ceramics as well as architecture. Most importantly, the early cuneiform texts are considered to be the first example of language-oriented writing, making the ED the first historical period worldwide. Eight dates from the Inana Temple sounding at Nippur were grouped into two consecutive phases: 4a (Level IX) and 4b (Level VIII). Dates P-799, -801, -806 are considerably older than the rest of the dates, possibly due to inbuilt age. P-809 is excessively young due to the sample being undersized. An additional date from the site of Tello, ancient G̃irsu, from a hearth in a sounding below the Maison des fruits on Tell K, represents an Early Dynastic occupation predating the First Dynasty of Lagash (Forest Reference Forest1999: 4ff.; Huh Reference Huh2008: 105ff.; Hritz et al. Reference Hritz, Pournelle, Smith, Albadran, Issa and Al-Handal2012). Given the incomplete information about the context, it is not possible to determine how this date corresponds to the Nippur sequence.
Phase 5 - ED IIIa/b
Phase 5 represents the earlier stages of the ED III. The most important dates for this period arguably come from Abu Salabikh; these can be linked to the large archives of cuneiform texts, sometimes called “Fara period” or “Fara style” tablets, which contain some of the world’s oldest examples of written literature (Biggs Reference Biggs1974; Biggs and Postgate Reference Biggs and Postgate1978; Postgate and Krebernik Reference Postgate and Krebernik2009). Together with the archives found at Shuruppak, modern Fara, these tablets constitute one of the defining features of ED IIIa. The third date from Abu Salabikh (BM-1366) is younger than expected. It is possible that this date was affected by laboratory contamination reported for some of the other BM dates from Abu Salabikh (Tite et al. Reference Tite, Bowman, Ambers and Matthews1987; Bowman et al. Reference Bowman, Ambers and Leese1990). The other significant context to produce 14C dates is the Royal Cemetery of Ur, by far the most spectacular archaeological discovery of the Early Bronze Age in the region. There has been much scholarly debate about the identity of the individuals interred in the royal tombs and their place in the Early Mesopotamian chronology, as well as the internal chronology of the cemetery itself (Nissen Reference Nissen1966; Pollock Reference Pollock1985; Reade Reference Reade2001: 18; Sürenhagen Reference Sürenhagen2002; Marchetti and Marchesi Reference Marchetti and Marchesi2011: 65). Despite many caveats in our knowledge about the cemetery’s nature and date, most researchers would agree that it was either contemporary with or slightly younger than the rule of King Ur-Nanshe of Lagash, whose reign is conventionally taken as the start of the final stage of the Early Dynastic period in Mesopotamia, ED IIIb. If that is to be believed, the Royal Cemetery (Phase 5b) should postdate the Abu Salabikh contexts (Phase 5a), given the noticeable paleographic differences between the Fara tablets and the ED IIIb texts. The 14C date P-724 from the Royal Cemetery represents the bulk sample of wood from a number of axes and was excluded from the model, as it could not be linked to any specific context (Stuckenrath and Ralph Reference Stuckenrath and Ralph1965). The two dates from the Inana Temple Sounding Level VII from Nippur are more problematic in terms of their archaeological chronology. On the one hand, carved chlorite objects of the “Intercultural Style” (Aruz Reference Aruz2003) would link them with the Royal Cemetery. On the other, the administrative texts from this level bear similarities to those from Fara and Abu Salabikh, suggesting an older date.
Phase 6 - Late ED IIIb
Finally, Phase 6 represents the later ED IIIb period, here assumed to be the time between the rise of Ur-Nanshe and the conquest of Mesopotamia by Sargon of Akkad. The Middle Chronology date of the Akkadian conquest is taken to be 2334 BC (Sallaberger and Schrakamp Reference Sallaberger and Schrakamp2015: 85–104). This date was derived from the SKL chronology and is still being debated. Nonetheless, the Middle Chronology is the general consensus among researchers and the date is unlikely to move by more than a decade, thus providing a useful terminus ante quem for the Early Dynastic sequence (Nissen Reference Nissen1987: 609; Roaf Reference Roaf2012; Sallaberger and Schrakamp Reference Sallaberger and Schrakamp2015: 11). Two 14C dates are available for this phase, both coming from deep soundings at important Southern Mesopotamian sites. OxA-28283 is a measurement on a bone tool from the Ywn sounding at Kish (Zaina Reference Zaina2015). The other measurement comes from Level V of the Inana Sounding, placing it late in the ED III sequence (Hansen Reference Hansen1965: 208).
RESULTS
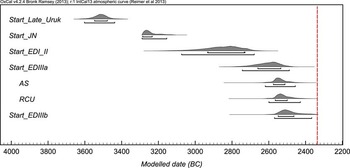
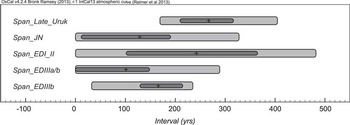
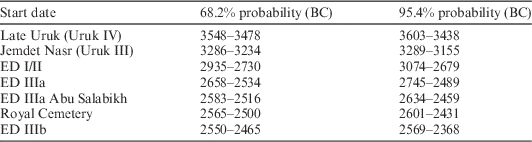
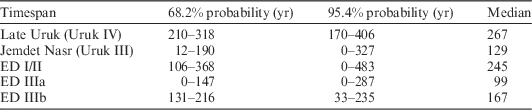
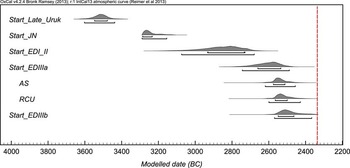
Table 1 and Figure 3 show the modeled ranges for the start dates of the consecutive phases, as well as the averaged dates for the Royal Cemetery and the ED IIIa from Abu Salabikh. Table 2 and Figure 4 give the estimate timespans of these phases, calculated here as the difference between start and end boundaries of each individual phase. Though the uncertainties of these determinations are in most cases larger than 100 yr, some general observations can be made. The implications and interpretations of these observations are described in greater detail in the following section.
-
1. There seems to be a hiatus of at least 100 yr between the end of the Jemdet Nasr and the earliest ED dates available. As a result, it is impossible to determine the transition between protohistoric and historical ages with any precision, making ~2900–2800 BC the most likely option.
-
2. The very earliest parts of the Early Dynastic period (ED I/II) seem considerably longer than the succeeding period (ED IIIa and ED IIIb).
-
3. The ED IIIa contexts of Abu Salabikh, indirectly associated with the “Fara” style tablets, appear to be either contemporary with the Royal Cemetery, or immediately preceding it.
-
4. 2530 BC ± 30 is the most likely date for the construction of the Royal Cemetery.
The estimated posterior Boundary() functions, representing the start dates of the consecutive periods. The red dotted line represents the cut-off date used as the terminus ante quem for the model.
The estimated durations [Interval() functions] of the consecutive phases. The + sign shows the mean of the distributions.

Modeled calibrated ranges for the start dates of individual phases. Average dates for the Abu Salabikh ED IIIa samples and the Royal Cemetery of Ur are also provided.

Modeled timespans of individual phases, calculated as differences between the start and end boundaries of each phase.

CONCLUSIONS AND DISCUSSION
This overview serves to highlight the significant caveats in our understanding of the chronology of Early Mesopotamia. Due to the insufficient number of well-stratified 14C dates, and a reliance on older 14C measurements, our chronologies for this all-important period remain highly speculative. Nonetheless, even the very broad date estimates provide us with insights into the social dynamics during the human transition from prehistory to history, not visible in either archaeological or textual sources.
The long duration of the Late Uruk period (~250 yr) is unsurprising, given the wide geographic reach of the Late Uruk material. It seems safe to assume that the most important feature of the period, the development of a complex system of administrative notation, the protocuneiform script, was a result of a slow and gradual evolution. This system became the immediate predecessor of the cuneiform writing system. The problematic nature of the following period, the Jemdet Nasr, has been well recognized by the archaeological community. Typically, Jemdet Nasr archaeological finds such as painted pottery or distinctive types of cylinder seal designs seem to be prominent on some sites and completely absent from others (Finkbeiner and Röllig Reference Finkbeiner and Röllig1983). The geographically restricted and transitional character of the Jemdet Nasr seems to be reflected in its shorter duration (~150 yr).
Although ED I/II is traditionally referred to as the first historical period, it is important to note that the available cuneiform sources are few, fragmentary, and very poorly understood. This stands in sharp contrast to the apparently long duration of this period (~250 yr). Furthermore, the earliest stratified examples of ED cuneiform texts come from Nippur Inana IX (Buccellati and Biggs Reference Buccellati and Biggs1969, nos. 1 & 2), 14C dated here to ~2750 BC, some 200 yr after the youngest Jemdet Nasr dates. There are three possible explanations for this gap between the end of the Terminal Uruk period and the earliest appearance of Sumerian cuneiform. The first option is that development of fully linguistic ED writing lagged behind the appearance of an Early Dynastic material culture. The alternative is that the largest archive of ED I/II cuneiform tablets, the “Archaic Ur” tablets from layers below the Royal Cemetery (Nissen Reference Nissen1986; Sallaberger Reference Sallaberger2010; Lecompte and Verderame Reference Lecompte and Verderame2013; Lecompte Reference Lecompte2015) are considerably older than those of Nippur. There is no clear archaeological or chronometric evidence that would allow us to make this assumption. A third option is that there is a large body of archaic ED I texts that remains to be discovered.
The 14C dates of the Abu Salabikh texts place them in the immediate antecedence of the Royal Cemetery of Ur. This late date is significant, given the considerable difference in paleography, onomastics, and style between the “Fara style” tablets and the ED IIIb texts (Biggs Reference Biggs1966: 76). It has been suggested that the Fara tablets may precede Ur-Nanshe by two generations (Biggs Reference Biggs1974: 26; Alster Reference Alster1976: 111), or even overlap with his reign (Porada et al. Reference Porada, Hansen, Dunham and Babcock1992: 109). The dates seem to corroborate this view, thus undermining the usefulness of paleographic dating. If the result is confirmed by further chronological research, then the evolution of writing seems to have greatly accelerated during the ED III period. It is possible that these developments mirror the changes in the political organization of Mesopotamia, usually pictured as the original temple-centered economy giving way to a tribal community, climaxing in the appearance of military-focused dynasties, a process which itself is traditionally understood as slow and gradual (e.g. Falkenstein Reference Falkenstein1974: 20; Charvát Reference Charvát1982, Reference Charvát1988, Reference Charvát1998; Pollock 1999: 117ff.; Steinkeller Reference Steinkeller1999). The dating of the Royal Cemetery to ~2530 BC agrees with previous beliefs about the chronology of the period, assuming that the Middle Chronology of the 3rd millennium BC is correct. This corresponds well to the reconstructions of Marchetti and Marchesi (Reference Marchetti and Marchesi2011: 123), who estimated a period ~6–10 generations between the King Meskalamdu of the Royal Cemetery and the Akkadian conquest. It is also important to stress that ED IIIb, the period for which we have the most written sources anywhere in Early Bronze Age Mesopotamia, was comparatively short relative to the lengthy periods before it, probably lasting no more than 150 yr.
The Bayesian modeling of the 14C dates from Southern Mesopotamian contexts presented in this paper serves three purposes. Firstly, it demonstrates some of the uncertainties in our understanding of the early Mesopotamian chronology, which can only be addressed by producing new 14C determinations from well-defined archaeological contexts, contrary to the claims of researchers who see the chronology of the 3rd millennium BC as well established (Sallaberger and Schrakamp Reference Sallaberger and Schrakamp2015: 5). Secondly, the large amount of problematic dates and outliers should serve as a warning against using individual 14C dates for chronological discussion. Statistical modeling of larger bodies of dates should be the preferred methodology. Thirdly, the results show that producing absolute chronologies can inform us about the sociocultural dynamics of past societies, even when historical precision cannot be attained. In this particular example, I argued that the 14C dates raise questions over the view that the development of writing was the effect of a steady, gradual evolution (e.g. Matthews Reference Matthews2003: 131; Marchetti and Marchesi Reference Marchetti and Marchesi2011: 88). Instead, periods of slow development (Late Uruk) seem to have been interrupted by a slow intermediary phase (Jemdet Nasr), followed by a long period of apparent inactivity (ED I/II), culminating in rapid episodes of innovation (ED IIIa and b). This theory, however, requires additional data from well-stratified contexts. Having identified the most problematic parts of the Mesopotamian 14C chronology (the transitions between JN-ED and ED I/II-ED III), my doctoral project will proceed to produce new 14C dates from the important sites of Fara, Abu Salabikh, and Ur. These will allow to test the hypothesis with greater confidence. Additionally, new dates from the Northern Mesopotamian site of Tell Brak, ancient Nagar, in tandem with dates from other important Northern Mesopotamian sites (Tell Leilan, Tell Mozan), will be procured to gain better estimates for the later periods (Akkadian, Post-Akkadian) and thus remove the reliance on historical sources for the upper boundary of the model. Eventually, the new chronological model of Southern Mesopotamia will be compared to those of neighboring regions (Northern Mesopotamia, Syria, and Iran) to study the cultural interaction among the ancient civilizations.
ACKNOWLEDGMENTS
This paper shows the preliminary results of my doctoral project. I would like to thank all Oxford researchers involved in the supervision of my graduate studies, especially Prof Christopher Bronk Ramsey, Dr Michael Dee, Prof Jacob Dahl, and Dr Michael Charles. This project would be impossible without the financial support in the form of the Lorne Thyssen Grant, awarded by the Ancient World Research Cluster, Wolfson College, University of Oxford.
SUPPLEMENTARY MATERIAL
To view supplementary material for this article, please visit http://dx.doi.org/10.1017/RDC.2016.60