Introduction
During the first three-quarters of the twentieth-century, more than eight million African Americans abandoned the South. The first wave of this “Great Migration,” between 1910 and 1940, saw most migrants heading to major urban areas in the Northeast and Midwest. Gradually, western urban areas also became attractive destinations, with their popularity accelerating during and after World War II. By the time the Great Migration concluded in the early 1970s, it had dramatically transformed the demographic profile of the African American population. A historically southern and agricultural population became divided roughly evenly between the South and North and grew much less tied to the rural countryside and far more concentrated in urban areas (Gregory Reference Gregory2005; Price-Spratlen Reference Price-Spratlen2008; Tolnay Reference Tolnay2003; Wilkerson Reference Wilkerson2010).
Throughout the Great Migration, the flow of black migrants was heavily directed to a relatively small number of northern and western destination cities such as Chicago, Detroit, Los Angeles, New York, and Philadelphia (Gregory Reference Gregory2005; Tolnay Reference Tolnay2003). This is, in part, because these were largely the places where the small, preexisting northern black population was located before the Great Migration began (Gregory Reference Gregory2005). As such, these cities were more likely to contain black media outlets and social networks that could inform potential migrants about life outside of the South and sources of assistance such as job and housing opportunities for new arrivals (Gregory Reference Gregory2005; Price-Spratlen Reference Price-Spratlen1998, Reference Price-Spratlen1999a, Reference Price-Spratlen1999b, Reference Price-Spratlen2008). They were also cities conveniently reached by interregional railroad lines and highways (Black et al. Reference Black, Sanders, Taylor and Taylor2015; Gregory Reference Gregory1989; Lemann Reference Lemann1991). Moreover, ample job opportunities in industries such as food processing and manufacturing made large northern cities appealing destinations (Gregory Reference Gregory2005; Tolnay Reference Tolnay2003; Wilkerson Reference Wilkerson2010).
As the Great Migration unfolded, the black populations in these northern gateway cities skyrocketed. The increasing numbers of blacks in northern and western cities frequently led to backlash among the white population, increasing racial hostility, and growing efforts among whites to isolate the black population economically, socially, and residentially (Gregory Reference Gregory2005; Massey and Denton Reference Massey and Denton1993; Muller Reference Muller2012). Using a variety of methods, including racial steering by realtors, redlining by lenders, restrictive covenants, violence, and white flight, whites successfully isolated the growing black population within the inner city (Jackson Reference Jackson1985; Massey and Denton Reference Massey and Denton1993; Spring et al. Reference Spring, Tolnay, Crowder and White2013). As a result of these measures, northern metropolitan areas grew more racially segregated as the Great Migration ran its course (Massey and Denton Reference Massey and Denton1993). Many social scientists (e.g., Bouston Reference Bouston2010, Reference Bouston2016; Cutler et al. Reference Cutler, Glaeser and Vigdor1999; Massey and Denton Reference Massey and Denton1993, Wilson Reference Wilson1978, Reference Wilson1987) identify the Great Migration, and the concomitant growth of the black population, as an important cause of the “rise of segregation” during the first seven decades of the twentieth century.Footnote 1
Despite the potential importance of the Great Migration for shaping the racially segregated environments of the North, relatively little attention has been devoted to the residential patterns of its participants, including their exposure to highly segregated urban areas. Yet, metropolitan-level segregation has been shown to have substantial, negative associations with numerous outcomes for blacks throughout their life course, including their educational, economic, social, and health outcomes (Charles Reference Charles2003; Massey and Denton Reference Massey and Denton1993; Thompson-Miller et al. Reference Thompson-Miller, Feagin and Picca2015). The extent to which the Great Migration shaped the segregation exposure of migrants and their children therefore has potentially profound implications for how we understand the benefits and costs of the Great Migration both in the short and long term. Moreover, heterogeneous segregation experiences across Great Migration migrants and nonmigrants in the North relative to those who remained in the South have important implications for how we understand regional disparities in residential segregation and, as a result, regional disparities in racial stratification. This exploration therefore has important implications for the literatures on the Great Migration, segregation, internal migration, and racial stratification.
In this study we use novel data that links records for individuals from the 1940 complete-count and 2000 long-form US censuses. With these data, we identify first- and second-generation Great Migration migrants, the former being parents who were born in the South and who had migrated out of the South by 1940 and the latter being children who either migrated out of the South with their parents by 1940 or who were born in the North to southern-born parents by 1940. Further, we link second-generation migrants to their 2000 Census household records, allowing us to examine the segregation experiences of the second generation later in life. While our primary focus is on these later-life outcomes among second-generation migrants and their second-generation southern and northern stayer counterparts, the second generation’s coresidence in 1940 with their parents also allows us to investigate the residential experience of first-generation migrant and nonmigrant parents. With these data, we seek answers to the following questions:
Were first-generation black migrant parents and their children located in more highly segregated metropolitan areas in 1940 than their counterparts among northern stayers (native, northern-born blacks) and southern stayers (those who were born in the South and who remained in the South)?
Were second-generation black migrants more successful at obtaining residence in less racially segregated metropolitan areas by 2000 than their counterparts who were the children of northern stayers or southern stayers?
Were second-generation migrants in 2000 more or less successful than northern stayers or southern stayers at translating higher socioeconomic status into less segregated residential locations?
Background
Southern Migrants in the North
Many black Great Migration migrants moved to pursue economic opportunities in the North and to escape the discrimination they faced in the South (Gregory Reference Gregory2005; Tolnay Reference Tolnay2003; Wilkerson Reference Wilkerson2010). However, persistent discrimination existed in the North as well. Indeed, as the Great Migration progressed, the black population in destination metropolitan areas rapidly increased, causing the local white power structure to respond with containment strategies that limited the neighborhoods in which African Americans were permitted to reside. This was accomplished by real-estate agents refusing to show blacks potential residences in nonblack sections of the metropolitan area (Massey and Denton Reference Massey and Denton1993) and was augmented by the practice of redlining in which lenders denied mortgages to blacks outside of traditionally “black areas” (ibid.). Furthermore, restrictive covenants adopted by many neighborhoods prevented homeowners or landlords from marketing their properties to blacks (Jackson Reference Jackson1985; Massey and Denton Reference Massey and Denton1993; Sharkey Reference Sharkey2013). These discriminatory practices were sometimes buttressed by bombings and other violence (Massey and Denton Reference Massey and Denton1993; Meyer Reference Meyer2001).
Eventually, the restricted “black areas” of the city could no longer contain their growing African American populations. Black residents gradually diffused into adjacent neighborhoods that had not been part of the traditional inner-city ghetto. Through a process of residential “invasion” and “turnover,” blacks moved in and whites moved out of these transitional zones (Bouston Reference Bouston2010, Reference Bouston2016; Freedman Reference Freedman1950; Jackson Reference Jackson1985; Taeuber and Taeuber Reference Taeuber and Taeuber1965a). Newly developed suburbs, augmented highway systems, and easily available, low-cost mortgages facilitated “white flight” from the inner city, as the ghetto grew but remained relatively concentrated within the larger urban area (Jackson Reference Jackson1985).
With their white populations increasingly located in the developing suburbs and their black populations remaining concentrated in the inner city, northern metropolitan areas experienced decades of increasing racial residential segregation (Cutler et al. Reference Cutler, Glaeser and Vigdor1999; Glaeser and Vigdor Reference Glaeser and Vigdor2012; Massey and Denton Reference Massey and Denton1993). This increasing segregation profoundly shaped the economic and social opportunities available to blacks in the North and continues to do so today. Indeed, metropolitan-level segregation differentially allocates opportunities throughout metropolitan areas so that blacks are often isolated in the most disadvantaged areas, while whites live in areas with higher proportions of social and economic opportunities (Massey and Denton Reference Massey and Denton1993). Supporting this conclusion, numerous studies have found that metropolitan-level segregation has been associated with a variety of negative consequences for blacks in recent decades, including greater exposure to crime (Baumer et al. Reference Baumer, Wolff and Arnio2012; Hipp Reference Hipp2011; Peterson and Krivo Reference Peterson and Krivo2010; Sampson Reference Sampson2012) and environmental hazards (Crowder and Downey Reference Crowder and Downey2010; Morello-Frosch and Lopez Reference Morello-Frosch and Lopez2006), worse health outcomes (LaVeist et al. Reference LaVeist, Gaskin and Trujillo2011), reduced wealth (Oliver and Shapiro Reference Oliver and Shapiro2006; Shapiro et al. Reference Shapiro, Meschede and Osoro2013), a lower likelihood of homeownership (Logan and Parman Reference Logan and Parman2017b), and poorer life chances for children (Ananat Reference Ananat2011; Andrews et al. Reference Andrews, Casey, Hardy and Logan2017; Card and Rothstein Reference Card and Rothstein2007; Condron et al. Reference Condron, Tope, Steidl and Freeman2013; Massey and Fischer Reference Massey and Fischer2006; Quillian Reference Quillian2014).
Very little research examines the association between segregation and blacks’ outcomes prior to 1980. However, Collins and Margo (Reference Collins and Margo2000) show that segregation’s negative influences may have started only around 1980. Specifically, they find that, prior to 1970, segregation was associated with lower probabilities of idleness among blacks and was not associated with single-motherhood status (ibid.).Footnote 2 Segregation could therefore have had some beneficial associations with blacks’ outcomes in earlier periods by, for example, promoting the growth of black businesses and decreasing educational segregation among the black population. The early potential benefits of segregation for black employment outcomes are also reflective of the extent to which white hostility limited white patronage of black businesses and the hiring of blacks in predominantly white firms. These benefits would have declined with the advent of civil rights legislation and the resulting increase in opportunities for middle-class blacks to move out of the ghetto, translating into a rise in the negative consequences of segregation for blacks (ibid.). While the argument that segregation’s harmfulness has intensified over time is compelling, for almost all decades, Collins and Margo find that segregation is associated with lower earnings for blacks relative to whites. This study also did not attend to other potentially negative associations between segregation and blacks’ outcomes, such as individuals’ health or the quality of their schools. Exposure to segregation prior to 1980 was therefore also likely still harmful in important ways for blacks, though its harmfulness may have been subtler in the context of limited economic opportunities outside of black areas during the Jim Crow era.
An additional change that has potentially shifted the meaning of segregation is the increasing dispersal of blacks out of central cities and to suburban areas in recent decades.Footnote 3 While suburbs differ from central cities in many important respects, considerable research has shown that the suburbs minorities move to tend to exhibit levels of segregation, impoverishment, and disadvantage that are similar to many central cities (Charles Reference Charles2003; Kneebone and Berube Reference Kneebone and Berube2014; Kneebone and Holmes Reference Kneebone and Holmes2015; Massey and Denton Reference Massey and Denton1993; Pattillo Reference Pattillo2005). Thus, the increasing suburbanization of blacks has largely not translated into increasing racial equality in residential attainment and segregation is still expected to be associated with worse outcomes for blacks in both central cities and suburbs.
Thus, while the nature and potential impact of segregation has changed over time, metropolitan-level segregation has consistently been shown to profoundly disadvantage blacks in almost all facets of life and to substantially widen racial disparities in outcomes, particularly after 1980. Because Great Migration migrants and their children tended to be drawn to cities such as Chicago, Detroit, and New York City that were, and remain, particularly segregated, it is possible that neglecting the relationship between northward migration and segregation outcomes may therefore cause us to overestimate the benefits of the Great Migration for migrants and their children. Indeed, while the Great Migration was motivated by a desire to improve life chances, its correspondence with a rise in segregation suggests that, over time, it may have limited the benefits of migrating north.
The Rise of Segregation
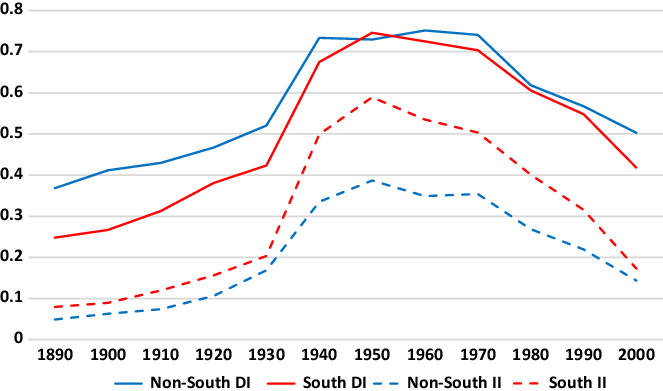
As shown in figure 1, the level of residential segregation in the North increased significantly during the Great Migration. To summarize the history of residential segregation we rely on two common measures. The Dissimilarity Index (DI) refers to the unevenness with which two populations (in our case, blacks and nonblacks) are distributed throughout a metropolitan area. It can take on values ranging from 0.0 to 1.0 and can be interpreted roughly as the proportion of the metropolitan population that would need to change neighborhoods (usually defined as census tracts) for the two groups to be distributed evenly throughout the urban area. The Isolation Index (II), which can also range from 0.0 to 1.0 and is also calculated at the metropolitan level, measures “the extent to which minority members are exposed only to one another” (Massey and Denton Reference Massey and Denton1988: 288). As a rule of thumb, values between 0.0 and 0.3 for both indices are considered low, values between 0.3 and 0.6 are moderate, while values greater than 0.6 represent extreme levels of residential segregation. Both indices are presented for metropolitan areas in the South and non-SouthFootnote 4 from 1890 through 2000.Footnote 5
Dissimilarity and isolation indices for metropolitan areas in the South and non-South, 1890–2000.

At the turn of the twentieth century, before the Great Migration commenced, the average DI stood at 0.411 in the non-South, while the II averaged only 0.063.Footnote 6 By 1940, after the first wave of the Great Migration, both indices had soared to 0.734 and 0.335, respectively. Although the intensity of the Great Migration strengthened during and after World War II, the major urban areas in the North and South had already largely achieved their segregation apexes. Indeed, between 1940 and the culmination of the Great Migration in 1970, residential segregation stabilized at these relatively high levels, then began a protracted decline, reaching 0.502 and 0.144, for dissimilarity and isolation, respectively, in 2000. The temporal and spatial (i.e., variation across northern metropolitan areas) correspondence between the Great Migration and levels of racial residential segregation has supported claims by many scholars that the two phenomena are causally related (Bouston Reference Bouston2010, Reference Bouston2016).
The overall similarity in segregation trends for the non-South and South from 1900 to 1970 shown in figure 1 might seem to contradict the existence of a linkage between black migration and residential segregation. However, the interregional mobility that characterized the Great Migration was also accompanied by significant rural-to-urban relocation within the South. For example, the percentage of southern African Americans living in urban areas soared from 17 percent in 1900 to 67 percent in 1970.Footnote 7 The processes that led to the increasing residential concentration of blacks in northern inner cities and the exodus of whites from central cities to suburbs also transpired in southern urban areas.Footnote 8 While the structure and organization of southern and northern cities and suburbs differed in many respects (Gregory Reference Gregory2005; Grigoryeva and Ruef Reference Grigoryeva and Ruef2015; Grossman Reference Grossman1989), and these differences likely influenced their respective “rise in segregation,” it is not surprising that metropolitan areas in both regions experienced increasing racial residential segregation during the era of the Great Migration.
As the Great Migration subsided after 1970, levels of racial residential segregation in both the South and non-South began to decline. This decline was partially fueled by increasing migration among blacks to metropolitan areas with relatively small existing black populations, a migration trend in marked contrast to that which occurred during the Great Migration (Sander et al. Reference Sander, Kucheva and Zasloff2018). However, the improvement was not equally distributed throughout the nation. Southern, western, and smaller metropolitan areas experienced the largest improvements (Charles Reference Charles2003; Glaeser and Vigdor Reference Glaeser and Vigdor2012; Logan Reference Logan2013; Logan et al. Reference Logan, Alba, McNulty and Fisher2004; Reibel and Regelson Reference Reibel and Regelson2011; Rugh and Massey Reference Rugh and Massey2010). In contrast, some major urban areas in the Northeast and Midwest maintained very high levels of segregation between their black and nonblack populations at the close of the twentieth century. For example, in 2000 the DI in Chicago, Detroit, Philadelphia, and New York remained at 0.779, 0.842, 0.670, and 0.687, respectively—all squarely within the range of “high” segregation levels and all popular destinations during the Great Migration.
Southern Migrants and Residential Segregation in the North
Despite the connections that scholars have drawn between the Great Migration and trends in racial residential segregation, we still know relatively little about the experiences of the participants in the Great Migration. Were the migrants and their children more likely than northern-born or sedentary southern blacks to reside in highly segregated metropolitan areas? While the segregation outcomes of migrants and their children have not been explored empirically, research on the neighborhood attainment of Great Migration migrants offers mixed evidence on what we may expect to find. Specifically, using data for a subset of nonsouthern cities from the 1960 US Census, Taeuber and Taeuber (Reference Taeuber and Taeuber1965b) concluded that African American migrants were more likely than northern stayers to reside in “newly invaded areas” that were becoming more racially diverse. However, Taeuber and Taeuber did not restrict their analysis of residential patterns to blacks migrating from the South versus blacks migrating from other non-South states. Additionally, Tolnay et al. (Reference Tolnay, Crowder and Adelman2000) found that while recent migrants to the North (i.e., those who moved between 1965 and 1970) lived in more integrated and prosperous neighborhoods than the neighborhoods of their northern-born counterparts, migrants who had left the South in the more distant past (i.e., prior to 1965) resided in less desirable neighborhoods than recent southern migrants and the northern born. Given that it is not entirely clear whether migrants lived in better neighborhoods than northern stayers, it is similarly unclear whether they would live in less segregated metropolitan areas. Moreover, the higher levels of segregation exhibited by northern urban areas suggest that it is probable that migrants in the North and their children would live in more segregated metropolitan areas relative to southern stayers. However, no research that we know of explores the segregation outcomes of southern-born Great Migration migrants and/or their children relative to southern stayers. We therefore have little guidance regarding the extent to which migrants and their children live in more or less segregated metropolitan areas than southern stayers.
Prior studies of the relative economic standing of southern-born migrants in the North also offer somewhat conflicting guidance regarding their corresponding relative exposure to residentially segregated environments. For example, compared to northern stayers, black southern migrants were more likely to be employed (Tolnay Reference Tolnay2001), spent more of their working lives in full-time jobs (Lieberson and Wilkinson Reference Lieberson and Wilkinson1976), earned higher incomes (Lieberson Reference Lieberson1978; Long and Heltman Reference Long and Heltman1975; Masters Reference Masters1972), and exhibited lower rates of separation and divorce (Tolnay Reference Tolnay1997, Reference Tolnay1998; Tolnay and Crowder Reference Tolnay and Crowder1999). First-generation migrants may have been able to harness these socioeconomic resources to reside in less segregated metropolitan areas than native northerners. However, the limited research on second-generation migrants suggests that their levels of education, earnings, and likelihood of living in poverty were virtually identical to those of equivalent black northern stayers and only modestly better than equivalent southern stayers (Alexander et al. Reference Alexander, Leibbrand, Massey and Tolnay2017).
These findings suggest that, when assessing the exposure of southern migrants to conditions of residential segregation in the North, it is advisable to distinguish between the experiences of first- and second-generation movers. On this point, prior research has drawn parallels between the Great Migration of African Americans to international migration (ibid.; Restifo et al. Reference Restifo, Roscigno and Qian2013). That is, differences in social, economic, and cultural conditions that prevailed in the American South and non-South, particularly during the early stages of the Great Migration, were akin to parallel differences that often exist between less developed and more developed nations that typically mark the origins and destinations of international migrants. Many studies of the adaptation experiences of international migrants have revealed that the second generation fares better than the first generation, largely because of their greater accumulation of human and social capital such as education, language skills, friendship networks, and work experience that are more suitable for success in the destination area (Boyd Reference Boyd2009; Boyd and Grieco Reference Boyd and Grieco1998; Chiswick and Debburman Reference Chiswick and Debburman2004; Farley and Alba Reference Farley and Alba2002; Kalmijn Reference Kalmijn1996; Park and Myers Reference Park and Myers2010; Reitz et al. Reference Reitz, Zhang and Hawkins2011; Sakamoto et al. Reference Sakamoto, Woo and Kim2010; Thomas Reference Thomas2012; Trejo Reference Trejo2003). Yet, such generational differences found among international migrants do not necessarily mean that second-generation Great Migration migrants enjoyed residential locations that were superior to those of northern-born blacks. In fact, as noted in the preceding text, recent research indicates that the children of participants in the Great Migration had educations and incomes in later life that were statistically indistinguishable from those of children of northern-born parents, and only modestly superior to those of sedentary southerners (Alexander et al. Reference Alexander, Leibbrand, Massey and Tolnay2017). Nevertheless, we have no knowledge about whether these relationships would hold for segregation outcomes and our expectations about these relationships are also hampered by the lack of research on the segregation outcomes of first-generation Great Migration migrants. As such, we have very little information about how Great Migration experiences may have shaped the short- and long-term segregation experiences of migrants and their children, which limits our ability to understand the broader benefits and costs of the Great Migration in important and underappreciated ways.
Theory and Hypotheses
Theoretical guidance for anticipating differences by migration status in the likelihood of residing in more highly segregated urban areas can be gleaned from the “Big Three” perspectives that have been widely used in research on locational attainment, residential mobility, and residential segregation (see e.g., Krysan and Crowder Reference Krysan and Crowder2017). The “spatial assimilation model” argues that group differences in socioeconomic status are often reflected in residential outcomes—with less desirable neighborhoods, lower mobility from poor to nonpoor neighborhoods, concentration in central cities, and greater exposure to racial residential segregation observed for lower status individuals and families. The “place stratification model” acknowledges the important role of socioeconomic status but also points to the separate influence of discrimination and institutional barriers that deny some groups access to better neighborhoods and opportunities for upward residential mobility. A third perspective identifies the influence of group differences in preferences for residing near members of one’s own racial or ethnic group versus members of a different racial or ethnic group. We agree with Krysan and Crowder (Reference Krysan and Crowder2017) that the elements of the “Big Three” are (1) not quite as distinct from each other as prior research has often assumed and (2) not necessarily an exhaustive set of explanatory factors. And, we acknowledge that these theoretical perspectives are more applicable to variation in exposure to different neighborhood environments than to the distribution of population groups into more or less segregated metropolitan areas. However, they remain useful for framing our hypotheses about the relative exposure of southern migrants, northern stayers, and southern stayers to segregated communities.
The overarching question to be interrogated is the extent to which individuals with different migration histories varied in the level of racial residential segregation that characterized the metropolitan areas in which they lived, both in 1940 and 2000. We begin by investigating the relative exposure to residential segregation experienced by first-generation southern-born migrants in the North and their children—that is, those who were born in the South but resided in the North in 1940 with their children—as compared to northern-born blacks residing in the North in 1940 (“northern stayers”) and southern-born blacks residing in the South in 1940 (“southern stayers”).
We then examine whether second-generation migrants (the children of parents who migrated from the South to the North by 1940) live in more or less segregated metropolitan areas relative to second-generation northern and southern stayers during their later adulthood in 2000. This analysis provides a sense of the long-term association between migration and segregation outcomes as well as an indication of how the Great Migration has shaped individuals’ segregation outcomes over the course of the twentieth century.
Despite the limitations of the “Big Three” as a conceptual framework for understanding group variation in locational attainment, residential mobility, and segregation, we draw from them to anticipate differences in exposure to racial residential segregation among the first and second generation, as defined in the preceding text. More specifically, we draw from the Spatial Assimilation Perspective to hypothesize about the extent to which individual-level sociodemographic characteristics account for any differences in exposure to segregation by migration history. Further, we borrow from the Place Stratification Perspective to examine whether the residential returns to socioeconomic status (i.e., whether higher status individuals live in less segregated neighborhoods) differ by migration status.Footnote 9 Our general expectations are as follows:
Hypothesis 1: We expect first- and second-generation southern migrants to live in less segregated metropolitan areas than northern stayers.
Hypothesis 1a: These differences by migration status will, however, be largely explained by corresponding differences in the socioeconomic characteristics of migrants and, for the second generation, the characteristics of second-generation migrants and their parents, consistent with the Spatial Assimilation Perspective.
Hypothesis 2: We expect first- and second-generation southern migrants to live in more segregated metropolitan areas than southern stayers because of the lower average levels of segregation exhibited by southern metropolitan areas.
Hypothesis 2a: These differences will be partially explained by metropolitan-level characteristics such as population size and the size of the black population.
Hypothesis 2b: The gaps between migrants and southern stayers will be larger for the first-generation parents of second-generation migrants than for the second-generation migrants, given the higher prevalence of living in urban areas during the period of the Great Migration and given the wider variety of destination locations in which second-generation migrants are expected to live when compared to first-generation migrants.
Hypothesis 3: Second-generation migrants will be more successful than southern stayers in translating higher socioeconomic status into less segregated residential environments because of generally weaker de jure racial discrimination in the North during much of the twentieth century, consistent with the strong version of the Place Stratification Perspective.
Data and Methods
To test our research hypotheses, we utilize newly available census data linking individuals from the 1940 complete-count census to the 2000 long-form census.Footnote 10 We link the 1940 Census to the 2000 Census by utilizing Protected Identification Keys (PIKs), which were produced by the Census Bureau and which uniquely identify individuals in the census. Individual PIK values are created by using probabilistic record linkage techniques to link census respondents to a larger “reference file” comprised of a composite of records from the Social Security Administration and other federal agencies. For a variety of reasons, some census respondents do not receive a PIK (as is detailed in our discussion of the limitations of our findings in the following text). For more information on the linkage procedures, see Massey et al. (Reference Massey, Genadek, Alexander, Gardner and O’Hara2018).
These linked data allow us to identify individuals who were under 18 years old and living in their parental households in 1940, as well as to examine these same individuals in 2000,Footnote 11 when they are about 65–70 years old. Moreover, because we follow children who were living in their parental households in 1940, we can identify their parents in 1940. Because of this, we examine both first- and second-generation Great Migration migrants in 1940 and follow the second generation into their late adulthood in 2000. Our ability to examine individuals in 1940 and 2000 also provides us with a unique opportunity to partially account for the early- and later-life characteristics of individuals, and to thereby help address the potential selectivity of migrants and their children. Consequently, this linked data set is uniquely powerful for examining first- and second-generation migrants’ experiences of segregation and for comparing those experiences to individuals who remained in the South or the North.
We limit our second-generation sample to children 18 years old or younger who lived with one or both parents in the 1940 Census and who could be linked to the 2000 Census. Our first-generation sample solely includes the parents of these second-generation migrants; we therefore do not include first-generation migrants who were not parents. Consequently, our results cannot be generalized to Great Migration migrants who did not have children who had been born by 1940 and who had survived until 2000. We also limit our sample to individuals who were enumerated as black, who were born in the United States, who have reported income and education in 2000, and whose reported race is consistent between 1940 and 2000.Footnote 12 Additionally, we restrict our analyses for both 1940 and 2000 to households located in metropolitan areas. Individuals may be included if they were born in nonmetropolitan areas, as long as they reside in a metropolitan area in 1940 for the first-generation analyses and in 2000 for the second-generation analyses. This restriction is necessary for our use of the dissimilarity and isolation indices that are calculated at the metropolitan level.
Second-generation individuals in our sample are grouped into four migration history categories based on the birthplace of their parents, their own birthplace, and their residence in 1940. Specifically, we examine:

The first generation is similarly identified as the parents of (1) southern stayers, (2) southern-born second-generation migrants, (3) northern-born second-generation migrants, and (4) northern stayers.Footnote 13 The distinction between these two groups of first-generation migrants (as parents of second-generation migrants born in the South or parents of second-generation migrants born in the North by 1940) allows us to be consistent with our analyses for the second generation, and allows us to compare first-generation individuals who may have spent more time in the North (those whose children were born in the North) to those who may have spent less time in the North (those whose children were born in the South).
Variables of Interest
We examine levels of racial residential segregation between blacks and nonblacks as measured by the metropolitan-level dissimilarity and isolation indices in 1940 and 2000. As mentioned in the preceding text, both measures are fundamental to the study of segregation, though they measure segregation in different ways. Recent research has called into question the value of these measures because their use of the population composition of census tracts to capture metropolitan-level segregation does not necessarily capture individuals’ social environments (Grigoryeva and Ruef Reference Grigoryeva and Ruef2015; Lee et al. Reference Lee, Reardon, Firebaugh, Farrell, Matthews and O’Sullivan2008; Logan and Parman Reference Logan and Parman2017a; Reardon and O’Sullivan Reference Reardon and O’Sullivan2004). While the development of new segregation measures is unquestionably valuable for understanding the complexity of segregation and, in particular, for understanding how segregation influences microlevel interactions, the dissimilarity and isolation indices offer important benefits for this analysis. Specifically, both measures have been used by numerous segregation scholars, allowing us to build upon and inform this previous work by filling in gaps in our understanding of the segregation outcomes of first- and second-generation Great Migration migrants. Additionally, these more macrolevel measures of segregation have been found to have important and enduring associations with individuals’ and families’ short- and long-term educational (Charles Reference Charles2003; Massey and Denton Reference Massey and Denton1993; Massey et al. Reference Massey, Condran and Denton1987), economic (Flippen Reference Flippen2010; Logan and Parman Reference Logan and Parman2017b; Massey et al. Reference Massey, Condran and Denton1987; Oliver and Shapiro Reference Oliver and Shapiro2006; Shapiro et al. Reference Shapiro, Meschede and Osoro2013; Wagmiller Reference Wagmiller2007), and health (LaVeist et al. Reference LaVeist, Gaskin and Trujillo2011; Williams and Collins Reference Williams and Collins2001) outcomes, to name a few. Our use of these segregation indices is motivated by our desire to understand how the Great Migration shaped opportunities for migrants and to contextualize these relationships within the narrative of the Great Migration as an important mechanism behind the dramatic increase in metropolitan-level segregation in the twentieth century.
The dissimilarity and isolation indices for 1940 and 2000 have been provided by Cutler et al. (Reference Cutler, Glaeser and Vigdor1999) and Glaeser and Vigdor (Reference Glaeser and Vigdor2001), respectively. We specifically utilize metropolitan-level segregation measures from 1940 (Cutler et al. Reference Cutler, Glaeser and Vigdor1999) and 2000 (Glaeser and Vigdor Reference Glaeser and Vigdor2001), which are constructed from tract-level data concerning black and nonblack population sizes. Cutler et al. construct these indices only for metropolitan statistical areas (MSAs) with at least 1,000 black residents because dissimilarity indices are not particularly meaningful for metropolitan areas with very small black populations. We solely include MSAs for which segregation data are available from Cutler et al. Additionally, the set of metropolitan areas included in our first-generation 1940 analyses differs from the set of metropolitan areas included in our second-generation 2000 analyses. We do not restrict our analyses to metropolitan areas that were consistent from 1940 to 2000 because we prefer to separately analyze the relationship between migration and segregation for the first generation in 1940 and engage in a separate analysis of the relationship between migration and segregation for the second generation in 2000. This is in recognition of the fact that many metropolitan areas have changed dramatically over this period. We therefore believe it is more meaningful to study the generations and their residential contexts separately. This choice also allows us to capture a more representative group of individuals in 2000 than would be the case if we restricted our analyses to a small subset of metropolitan areas. Further information about the construction of these measures is provided in Cutler et al. (Reference Cutler, Glaeser and Vigdor1999) and in Glaeser and Vigdor (Reference Glaeser and Vigdor2001).
For the analyses of first-generation migrants in 1940, we only include control variables that are measured in 1940, including the educational attainment and occupational status of the first-generation respondent. For the analyses for second-generation migrants in 2000, we include controls from 1940, when the second generation resided in their parental homes. These controls include the highest grade achieved by either parent, the highest occupational status exhibited by either parent, whether the family owned their own home, and whether the family resided in a metropolitan area in 1940.Footnote 14 We also include covariates that are measured in 2000 to account for the individual’s later-life characteristics. These controls include the respondents’ age and age-squared, their gender, marital status, educational attainment (in years), logged individual income for 1999, and whether they have moved to a different state between 1940 and 2000 (to account for the influence of additional migratory events). Because the level of segregation is likely influenced by the population size of the metropolitan area and of the black population, we also include controls for the total metropolitan population size and the black metropolitan population size in 1940 for the first-generation analyses and in 2000 for the second-generation analyses; these measures are also provided by Cutler et al. (Reference Cutler, Glaeser and Vigdor1999) and by Glaeser and Vigdor (Reference Glaeser and Vigdor2001).
To examine our third question, whether second-generation migrants were more successful at translating higher socioeconomic status into less segregated residential locations, we include interactions between the second generation’s migration status and socioeconomic status, as measured by the individuals’ educational attainment and logged individual income.
Findings
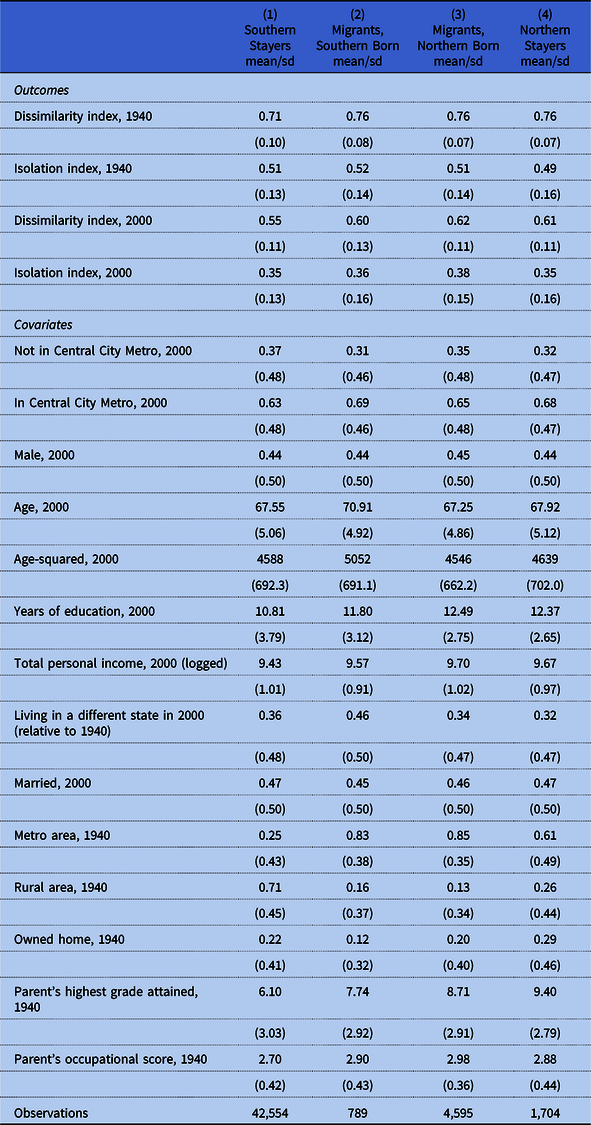
We first consider the descriptive results to provide an indication of whether second-generation migrants live in more or less segregated metropolitan areas than their southern and northern stayer counterparts in 1940 and 2000. Toward that end, table 1 depicts the means and standard deviations for our outcomes and covariates by second-generation migration status.
Descriptive statistics for segregation measures and covariates by migration category

Note: Income in unadjusted, nominal values.
The first four rows of the descriptive table highlight the segregation levels experienced by second-generation migrants and their first-generation parents in 1940 and by the second-generation migrants in 2000. These results suggest that the second-generation migrants live in metropolitan areas with higher levels of segregation (as measured by the DI) relative to their southern stayer counterparts in both 1940 and 2000, as expected. However, second-generation migrants live in metropolitan areas with similar levels of segregation (as measured by the DI) relative to northern stayers. Surprisingly, all groups, including southern stayers, live in similarly isolated metropolitan areas in both 1940 and 2000, contrasting with the finding of lower average dissimilarity indices for southern stayers. Moreover, second-generation migrants and northern stayers tend to exhibit slightly higher socioeconomic statuses and to have had parents with higher socioeconomic statuses than southern stayers. As a result, the observed variation in levels of segregation may be shaped by the characteristics of the second generation and their parents.
Segregation in 1940
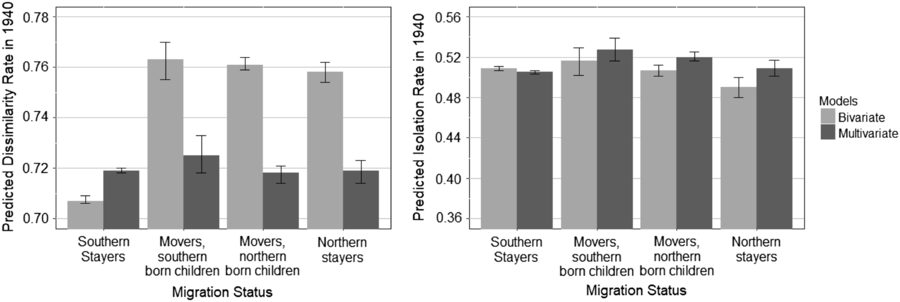
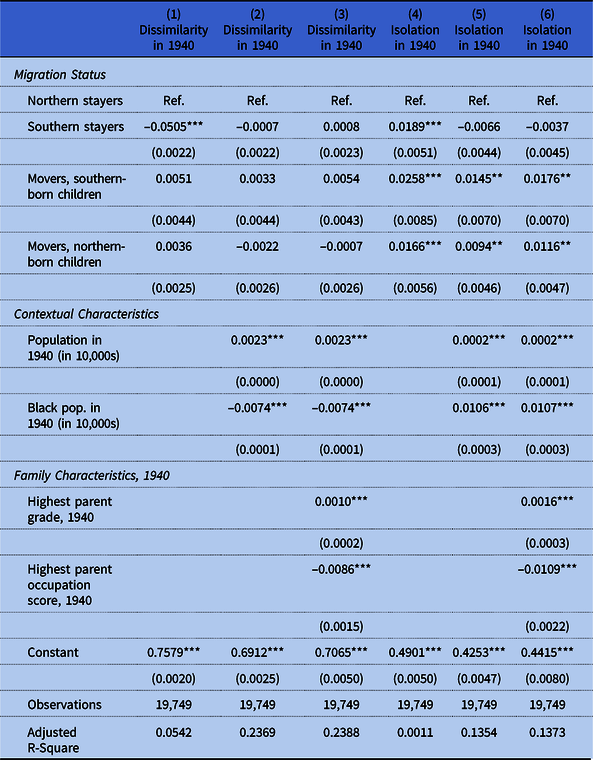
To explore these possibilities, we turn to figure 2, which presents the predicted levels of residential segregation from our OLS models examining the level of dissimilarity (left panel) and isolation (right panel) experienced by first-generation respondents (and their second-generation children) in 1940. Each panel contains a lighter set of bars that we refer to as the “bivariate” model and a darker set of bars that we refer to as the “multivariate” model. The bivariate model shows how the dissimilarity and isolation indices vary by migration status absent any controls; the multivariate model shows how the indices vary when individual and contextual controls are introduced. Detailed model results are presented in table 2; the bivariate results are presented in columns 1 and 4, and the multivariate results are presented in columns 3 and 6. The figures for the multivariate results hold all covariates constant at their means.
The predicted 1940 segregation outcomes of first-generation Great Migration migrants as measured by the dissimilarity index (left panel) and isolation index (right panel) relative to southern and northern stayers (bivariate predicted values were calculated from results in columns 1 and 3 of table 2; multivariate predicted values were calculated from results in columns 3 and 6 of table 2).

Metropolitan-level dissimilarity index and isolation index in 1940 by first-generation migration status (OLS regressions)

Source: 1940 Census data linked to 2000 Census data.
Note: Robust standard errors in parentheses.
*** p < 0.01; ** p < 0.05.
As can be seen in the left panel of figure 2, the bivariate results for the DI suggest that black southern stayers live in the least segregated metropolitan areas and that only trivial differences in segregation distinguish blacks residing in the North (i.e., northern stayers and migrants). However, the multivariate results displayed in the left panel of figure 2 show that, after the introduction of contextual characteristics—including the total and black population size in the metropolitan area, as well as individual-level socioeconomic characteristics—no statistically significant group differences in the metropolitan-level DI remain. It is therefore largely because of the widely different metropolitan contexts in the South and the North and, to a considerably lesser extent, the varying socioeconomic profiles of migrants and nonmigrants, that southern stayers lived in less segregated metropolitan areas in 1940, as measured by the DI, relative to first-generation migrants and northern stayers.Footnote 15
In contrast to the findings for the DI, the bivariate results for the II shown in the right panel of figure 2 suggest that northern stayers enjoyed the lowest levels of residential isolation, though the variation by migration history is quite small. When contextual and individual-level controls are introduced, the multivariate results show that southern migrants in the North are found to be exposed to the highest levels of isolation. Though, again, the group differences in residential segregation, as measured by the II, are very modest in magnitude ranging only from 0.505 for southern stayers to 0.527 for second-generation migrants who were born in the South. These findings are relatively consistent with those of other studies that tend to find that regional variation in segregation is lower when measured using the II relative to the DI (Massey and Denton Reference Massey and Denton1993).
Two findings stand out from our analysis of segregation patterns in 1940. First, all blacks in our analytic sample, regardless of migration history, were exposed to very high levels of residential segregation, whether measured with the DI or the II.Footnote 16 Second, although the multivariate evidence for the II suggests somewhat higher levels of segregation for first-generation southern migrants (and their second-generation children) residing in the North, the group differences are minuscule in magnitude, particularly once contextual characteristics including the total population and black population sizes of the metropolitan area are considered.
Segregation in 2000
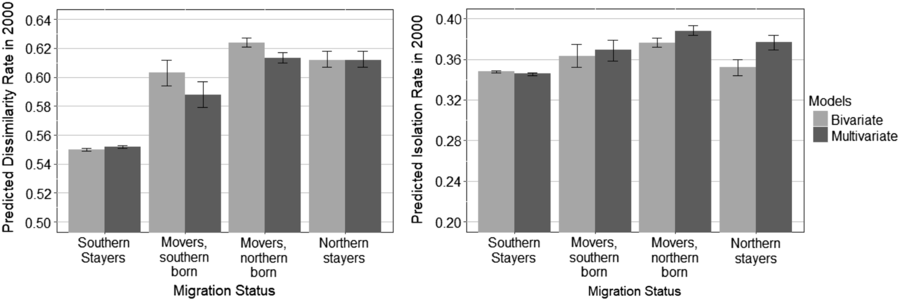
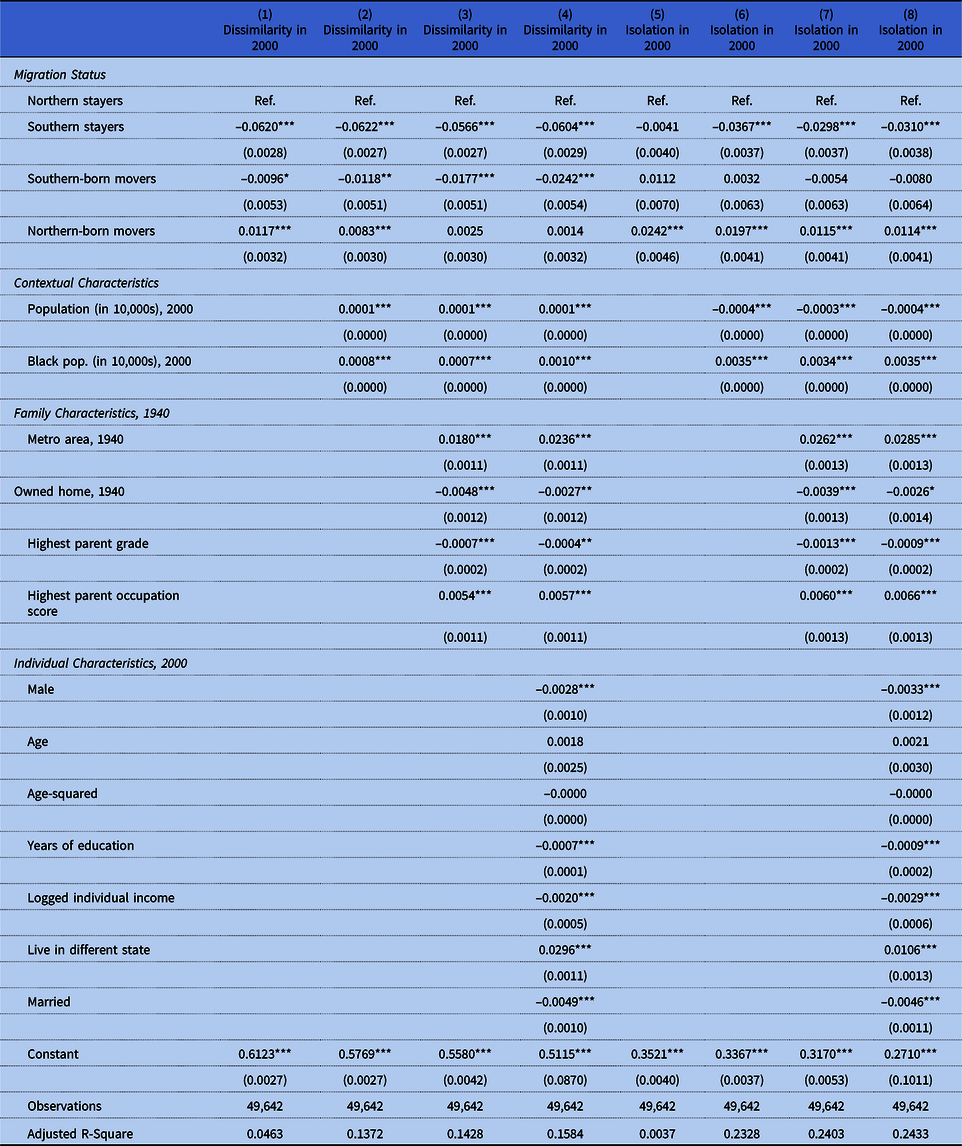
We next consider whether the relative exposure to segregation for second-generation migrants changed during the twentieth century. As before, we first consider the DI as an indicator of racial residential segregation in the year 2000. These results are summarized in the left panel of figure 3 (as before, with detailed bivariate results presented in column 1 of table 3 and detailed multivariate results presented in column 4 of table 3).
The predicted segregation outcomes of second-generation Great Migration migrants in 2000 as measured by the dissimilarity index (left panel) and isolation index (right panel) relative to southern and northern stayers (bivariate predicted values were calculated from results in columns 1 and 4 of table 3; multivariate predicted values were calculated from results in columns 5 and 8 of table 3).

Metropolitan-level dissimilarity index and isolation index in 2000 by second-generation migration status (OLS regressions)

Source: 1940 Census data linked to 2000 Census data.
Note: Robust standard errors in parentheses.
*** p < 0.01; ** p < 0.05.
Compared with the average levels of the DI in 1940 presented in figure 2, the level of segregation experienced by our sample in 2000 was considerably lower, consistent with research showing declines in segregation over time (Glaeser and Vigdor Reference Glaeser and Vigdor2012). Turning to differences by migration status, the bivariate results reveal that southern stayers (DI = 0.550) and southern-born second-generation migrants (DI = 0.603) live in significantly less segregated metropolitan areas than northern stayers (DI = 0.612), though these relationships are quite modest, particularly for southern-born second-generation migrants. Northern-born second-generation migrants (DI = 0.624), in contrast, live in more segregated metropolitan areas, although again the difference is minimal. These differentials remain relatively stable in the multivariate models. Southern stayers remain the least segregated (DI = 0.552) and northern-born second generation migrants the most segregated (DI = 0.613). However, the level of segregation experienced by the latter group is no longer significantly different from that observed for northern stayers (DI = 0.612) when control variables are included and, as was the case in bivariate models, group differences in exposure to segregation are quite small.Footnote 17
The results for the II in 2000 (right panel of figure 3) show, once again, that overall levels of residential segregation for our sample declined significantly between 1940 and 2000. Turning to differences in segregation by migration status, the bivariate patterns reveal very little variation by migration status in the level of segregation as measured by the II, varying only from a low value of 0.348 for southern stayers to a high of 0.376 for northern-born, second-generation migrants. While the difference between northern-born second-generation migrants and northern stayers (II = 0.352) is statistically significant, it is trivial in magnitude. The results from the multivariate models are substantively consistent with those from the bivariate models, revealing, again, little overall variation by migration status in exposure to segregated urban environments—ranging only from a low of 0.346 for southern stayers to a high of 0.388 for northern-born movers. The differences between those two groups and northern stayers (the reference, II = 0.377) are statistically significant, but not substantively meaningful. As was the case for the bivariate models, southern-born second-generation migrants do not exhibit significantly different IIs relative to northern stayers.
The evidence from 1940 and 2000 using both the dissimilarity and isolation indices, yields two major conclusions. First, second-generation Great Migration migrants were exposed to substantially lower levels of residential segregation in 2000 than in 1940 when they resided with their parents. Second, once relevant control variables are taken into account, variation by migration status in the level of exposure to racial residential segregation is minimal. While some intergroup contrasts were large enough to attain statistical significance, the differences were small enough as to be considered not particularly meaningful. In sum, we find little evidence that, by moving north, second-generation migrants gained an advantage over their counterparts who remained in the South, with respect to exposure to racial residential segregation—either in the short or the long term. However, neither were first- or second-generation migrants substantially disadvantaged by their moves North, a finding that is somewhat surprising in light of the consistently higher levels of segregation documented in the North versus the South (Massey and Denton Reference Massey and Denton1993). Additionally, migrants and their children suffered no meaningful residential disadvantage when compared to African Americans with longer histories in the North.
Differing Returns to Socioeconomic Status
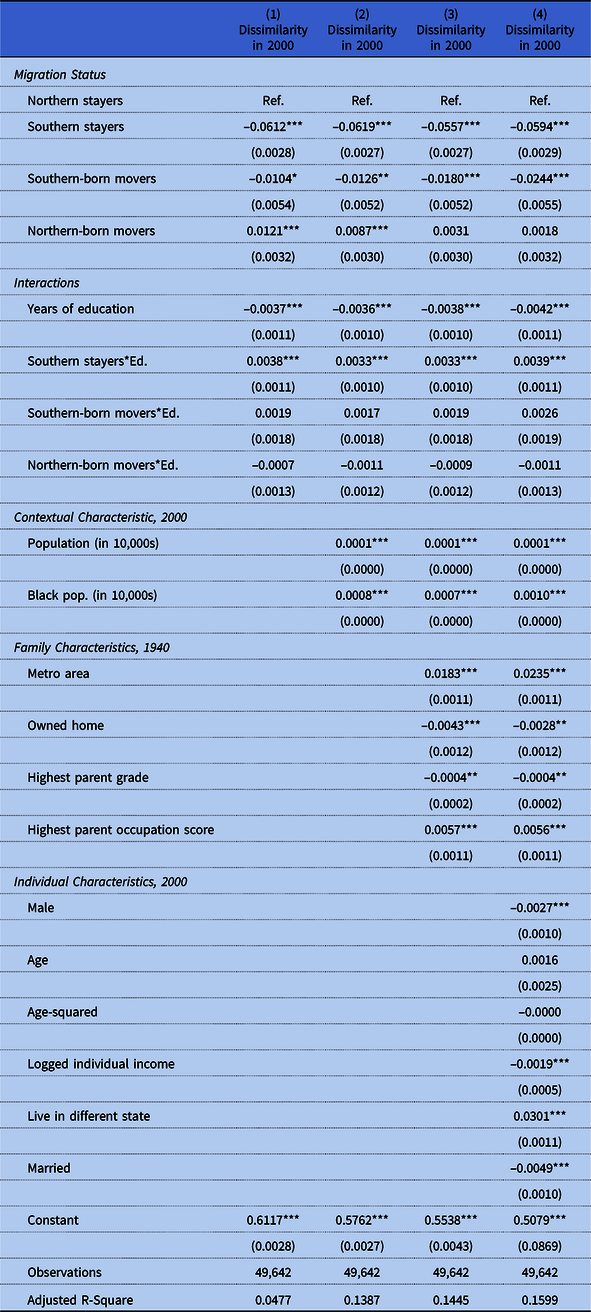
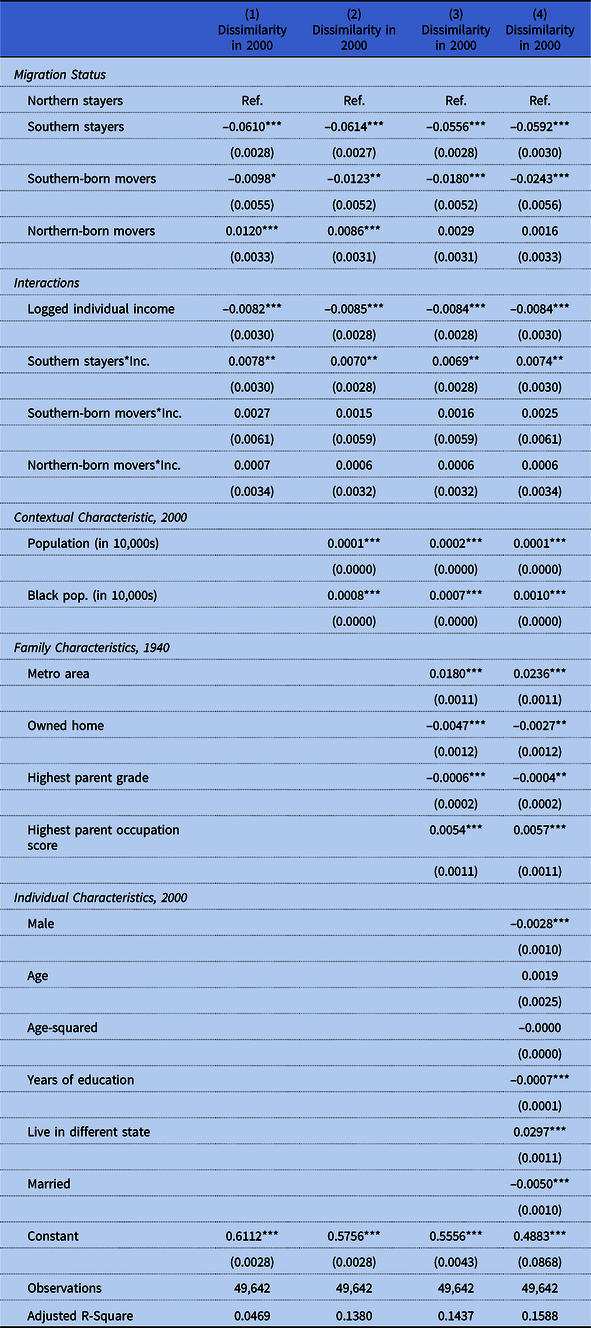
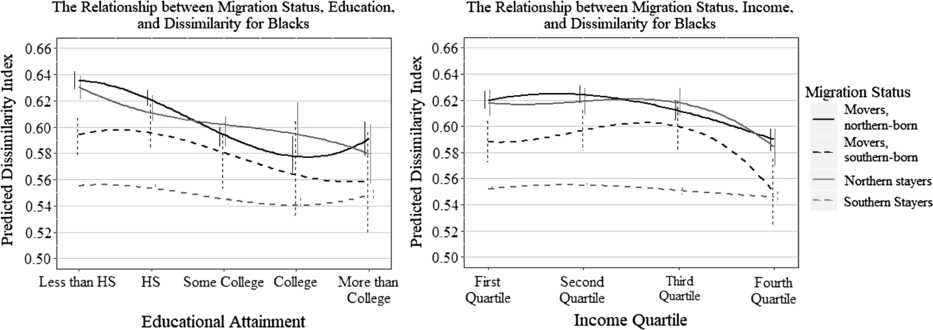
While the Great Migration does not seem to be associated with beneficial improvements (nor considerable deterioration) in black first- and second-generation migrants’ exposure to segregation, it remains possible that first- and second-generation migrants did experience larger returns than northern or southern stayers to their socioeconomic status in terms of greater declines in segregation as their educations and/or incomes increased. Indeed, many individuals migrated North because they felt they could not adequately capitalize on their educational attainment and other socioeconomic resources in the South, in part because of a lack of economic opportunities during the Great Migration and because of discrimination. We therefore consider the possibility of such differential returns to socioeconomic status in the attainment of residence in less segregated metropolitan areas in 2000 by separately including two sets of multiplicative interaction terms—one set for migration status and educational attainment (table 4) and a second set for migration status and income (table 5).Footnote 18 For ease of interpretation and discussion, we have used the multivariate model results from column 4 of tables 4 and 5 to generate predicted levels of residential segregation by migration status and socioeconomic status. The predicted values of the DI by level of education are presented in the left-hand panel of figure 4, those by income level are highlighted in the right-hand panel. The respective 95 percent confidence intervals for each predicted value are also included in figure 4. The graphs in figure 4 hold all covariates, other than migration status, education, and income, constant at their mean values. While educational attainment is measured as a continuous years of education variable, we calculate our predicted values in figure 4 by holding educational attainment at meaningful levels (i.e., less than a high school degree, high school degree, some college, and a college degree or more) given that this is a more meaningful comparison than comparing incremental increases by single years of education.
Metropolitan-level dissimilarity index in 2000 by second-generation migration status interacted with educational attainment (OLS regressions)

Source: 1940 Census data linked to 2000 Census data.
Note: Robust standard errors in parentheses.
*** p < 0.01; ** p < 0.05.
Metropolitan-level dissimilarity index in 2000 by second-generation migration status interacted with individual income (OLS regressions)

Source: 1940 Census data linked to 2000 Census data.
Note: Robust standard errors in parentheses.
*** p < 0.01; ** p < 0.05.

Figure 4. (left panel) illustrates that, with respect to residing in less residentially segregated metropolitan areas, southern stayers experienced the weakest returns to educational attainment, with virtually no variation in their DIs by years of schooling. Second-generation migrants, in contrast, receive somewhat greater residential benefits associated with increases in their educational attainment. Specifically, the DIs of northern-born second-generation migrants decline as they proceed from less than a high school degree to a high school degree (a decline of 2.05 percent), from a high school degree to some college (a decline of 4.82 percent), and from some college to a college degree (a decline of 2.20 percent), with a small rebound for individuals with more than a college degree. Southern-born second-generation migrants also experience declines in their segregation indices as their educational attainment increases, though these declines are more modest than they are for either northern-born second-generation migrants or northern stayers.
Turning to the evidence regarding differential returns to income (figure 4, right panel) we find further evidence that socioeconomic status is unrelated to levels of residential segregation for southern stayers. For all other groups, the association between earnings and residential segregation is stronger than for southern stayers. However, the findings reveal that it is only the highest income blacks (those with incomes in the upper 75th percentile) that experience lower levels of residential segregation relative to blacks with lower income levels. Across all other income levels, blacks do not experience declining segregation as their incomes increase. In general, these patterns of differential returns to education and income are similar when residential segregation is measured using the II, rather than the DI (results available upon request).
Two final points regarding our investigation of the differential returns to socioeconomic status by migration history deserve emphasis. First, and consistent with the general evidence regarding the overall levels of residential segregation experienced by all members of our sample, the range of residential segregation across all gradients of education and income falls within a very narrow band. For instance, the predicted DI for the most and least educated northern stayers is 0.579 and 0.630, respectively. Similarly, the predicted DI for northern-born second-generation migrants with the highest and lowest incomes is 0.590 and 0.620, respectively. Thus, the quite modest differential returns to socioeconomic status that we have described must be situated within a national context of high levels of residential segregation for all African Americans, regardless of education or income. Second, within that national context, southern stayers were exposed to the lowest levels of residential segregation. Even the least educated (DI = 0.555) and lowest earners (DI = 0.552) among southern stayers reside in less segregated metropolitan areas than the most educated and highest earners among northern stayers (DI = 0.579 and DI = 0.584, respectively) and northern-born second-generation migrants (DI = 0.596 and DI = 0.590), respectively.
Discussion
Our study is motivated by an interest in how participants in the Great Migration fared throughout the twentieth century with respect to their relative exposure to racially segregated residential environments. Given the dramatic increase in segregation as the Great Migration unfolded, the concentration of Great Migration migrants and their children in particularly segregated metropolitan areas such as Chicago and Detroit, and the powerful associations between segregation and life course outcomes, this investigation is important for understanding the potential short- and long-term benefits and costs of the Great Migration for migrants and their children. It also provides valuable insights into how this transformative migration event may have shaped individuals’ exposures to segregation into the twenty-first century. Our primary focus was on second-generation migrants in their later life, though their coresidence in 1940 with their migrant parents also permitted insights into the residential experience of first-generation migrants.
Contrary to our expectations (and first hypothesis) that first- and second-generation migrants would live in metropolitan areas with lower levels of segregation than northern stayers, we found no meaningful variation in exposure to segregation for migrants and nonmigrants residing in the North. Newcomers from the South therefore neither appeared to benefit from, nor were they disadvantaged by, their migration experiences and shallower roots in the North relative to northern stayers.
In contrast, we found that first- and second- generation migrants resided in more segregated metropolitan areas than southern stayers in both 1940 and 2000 (as posited by Hypothesis 2). However, for first-generation migrants this differential was almost entirely explained by differences in the metropolitan contexts of the South and the North (supporting Hypothesis 2a, that these differentials would be explained by the metropolitan context). For second-generation migrants, contextual, individual, and familial characteristics played little role in explaining these differentials, contrasting with Hypothesis 2a as well as with Hypothesis 2b where we expected that the gaps between migrants and southern-stayers would be larger for the first generation. The somewhat larger gaps in segregation outcomes for the second generation is potentially important and could reflect the fact that segregation is declining less in urban areas in the Northeast and North Central regions of the United States relative to urban areas in the West and South (Logan et al. Reference Logan, Alba, McNulty and Fisher2004). Those living in the North may therefore continue to see their segregation outcomes deteriorate relative to individuals living elsewhere in the United States.
Thus, despite the long history of de jure racial discrimination in the South, and a generally hostile cultural context at least through the end of the Great Migration, those African Americans who remained in the South’s metropolitan areas and their children were exposed to somewhat less segregated urban environments than those who left the region prior to 1940, and this was particularly the case for the second generation in their adulthood. This has important implications for how we understand the long-term benefits and costs of the Great Migration, given that segregation structures numerous outcomes throughout the life course. The finding that segregation outcomes were more equitable for the first generation relative to the second generation also suggests the importance of examining the returns to the Great Migration over the long term and indicates that the persistently high levels of segregation in many northern urban areas could progressively erode the intergenerational benefits of moving North.
That being said, scholars have argued that the lower levels of segregation exhibited by the South are due, in part, to the South’s historic reliance on social rather than residential segregation, as exemplified by the Jim Crow laws (Grigoryeva and Ruef Reference Grigoryeva and Ruef2015; Massey Reference Massey, Smelser, Wilson and Mitchell2001; Massey and Denton Reference Massey and Denton1993). The lower levels of segregation in the South are also partially reflective of traditional residential patterns in which southern blacks lived in the alleys or side streets adjoining white streets, patterns that often became entrenched during slavery and that later enabled black servants to live near white employers (Demerath and Gilmore Reference Demerath, Gilmore, Bruce and Demerath1954; Grigoryeva and Ruef Reference Grigoryeva and Ruef2015; Logan and Martinez Reference Logan and Martinez2018; Massey and Denton Reference Massey and Denton1993). Indeed, Logan and Martinez (Reference Logan and Martinez2018) find that the South exhibited high levels of segregation in the 1880s when segregation is measured at a small geographic scale, such as at the street segment, alley, or block level (see also Logan and Parman Reference Logan and Parman2017a). Consequently, while southern stayers were exposed to slightly lower metropolitan levels of segregation, particularly in 2000, this does not necessarily mean they resided in a more equitable residential context. Future investigations of North-South differences in the residential experience of Great Migration participants might benefit from the exploration of alternative, more microlevel orientations to measuring racial residential segregation. In this study we have opted for the more conventional measures of dissimilarity and isolation to maintain greater consistency with the vast majority of past research on racial residential segregation and because these measures have been found to have important associations with a wide variety of life outcomes, as discussed in the preceding text.
Finally, we found that second-generation migrants enjoyed greater residential returns to their socioeconomic status than southern stayers, a finding that supports Hypothesis 3 (that black southern stayers would be the least able to utilize their socioeconomic resources to move into less segregated metropolitan areas). Thus, despite residing in less segregated communities overall, African Americans who remained in the South were less successful than those who left the region at translating higher educations or larger incomes into progressively more integrated residential environments. This finding offers support for many Great Migration migrants’ expectations that they would be better able to capitalize on their socioeconomic resources in the North, in part, because of the expectation that the North had less overt discriminatory barriers to success (Wilkerson Reference Wilkerson2010). As such, this finding may also offer support for the Place Stratification Perspective and its emphasis on the role of discrimination in shaping racial disparities in outcomes.
Beyond these tests of specific hypotheses, what general conclusions can we glean from our study of the residential experience of Great Migration participants? First, if we use as a basis of comparison the levels of segregation experienced by those who remained in the South, our findings suggest little residential benefit from moving north. This conclusion is generally consistent with recent research that has inferred relatively modest, or no, economic benefits associated with leaving the South, as measured by employment status, income, or occupational prestige (e.g., Alexander et al. Reference Alexander, Leibbrand, Massey and Tolnay2017; Eichenlaub et al. Reference Eichenlaub, Tolnay and Alexander2010; see, however, Boustan 2016).
The finding of no benefits in terms of the segregation outcomes of first- and second-generation Great Migration migrants yields two different interpretations. On the one hand, given the higher levels of segregation documented for northern urban areas relative to southern urban areas (Iceland Reference Iceland2004; Massey and Denton Reference Massey and Denton1993), it is surprising and perhaps encouraging that first- and second-generation migrants do not appear to be substantively disadvantaged by their parents’ decisions to migrate North. On the other hand, the minimal variation in levels of segregation by migration status revealed by our analyses could be seen as a discouraging treatise on the entrenched nature of segregation in the United States. Indeed, our findings agree with the general literature on racial residential segregation that shows that residence in segregated urban areas remains a highly prevalent experience for African Americans (Logan Reference Logan2013; Massey and Rugh Reference Massey and Rugh2014), though our analysis is unique in showing that black southerners are only slightly less segregated at the metropolitan level relative to comparable northerners. Moreover, the very modest differences in exposure to segregated environments between those with the most education and highest incomes, versus those with the least education and lowest incomes, is reflective of the difficulty that even high socioeconomic status African Americans have escaping segregated communities (Adelman Reference Adelman2004; Charles Reference Charles2003; Iceland and Wilkes Reference Iceland and Wilkes2006; Massey and Denton Reference Massey and Denton1993; Massey et al. Reference Massey, Condran and Denton1987; Pattillo Reference Pattillo2005). Similarly, our covariates, including contextual, parental, and individual characteristics, play a very small role in explaining the relationships we observe among second-generation migrants in 2000. It is also largely only contextual characteristics, and not parental socioeconomic status, that explain the disparities in exposure to segregation among first-generation migrants and nonmigrants. We therefore find little evidence that the Spatial Assimilation Perspective explains our relationships, a finding that is consistent with a variety of studies showing that socioeconomic status explains only a small portion of blacks’ exposure to segregation (Charles Reference Charles2003; Iceland and Wilkes Reference Iceland and Wilkes2006; Pais et al. Reference Pais, Crowder and South2012; Sander et al. Reference Sander, Kucheva and Zasloff2018). The small segregation differentials across migration and socioeconomic statuses are therefore perhaps more reflective of the virtual inescapability of segregation for many blacks and the highly stratified nature of the US urban context. This has important implications for blacks’ outcomes in a wide variety of areas of life, as outlined in the preceding text.
Our study is subject to certain limitations that deserve to be noted. Our analyses for second-generation migrants in the year 2000 focus on individuals who were typically between 60–70 years old. We are unable to examine the residential experiences of our sample of second-generation migrants at any time point between 1940 and 2000. Second, our investigation does not include the second generation of migrants who were part of the heavy outmigration of southerners after World War II. Therefore, we are not able to generalize our results to second-generation migrants participating in this later wave of the Great Migration. This is a consequence of data availability. Forward linkage of individuals enumerated in the 1950 US Census to subsequent long-form census samples will be possible after 2022, when the 72-year embargo period for the 1950 Census expires. Our focus on this cohort means that our results may be subject to period effects such as the potentially unique housing and socioeconomic trajectories of a cohort that were largely young adults during the civil rights period and whose decisions of where to live were shaped in important ways by the events occurring during this period. Indeed, Wagmiller et al. (Reference Wagmiller, Gage-Bouchard and Karraker2017) demonstrate that individuals who came of age prior to the 1960s were more consistently residentially segregated than subsequent cohorts. The decreasing consistency of exposure to segregation we observe between parents in 1940 and their children in 2000 suggests that this trend may have been occurring over an even longer term. The importance of period effects for influencing our results should therefore be acknowledged. Additionally, our analysis almost certainly includes some unmeasured error due to failed record linkage. We are unable to assign PIKs for approximately 30 percent of children in the 1940 Census. Among those assigned a PIK in 1940, we were unable to link 30 percent of that total forward to the 2000 Census long form. Our results might be biased by this linkage procedure if, for example, survival to 2000 is related to early-life conditions, education, and income, causing our analysis to focus on a sample with a somewhat more advantaged socioeconomic profile and affecting the validity and generalizability of our results. However, our sample of linked cases from the 1940 Census is highly comparable to the original sample of individuals for whom matches were sought, suggesting this bias is likely minimal (results available upon request). Our analyses of segregation outcomes in 1940 are also reflective of a relatively selective subset of metropolitan areas that had been tracted by 1940. As a result, these analyses may capture a more select group of migrants and nonmigrants. Finally, because of our focus on second-generation migrants, we do not include first-generation migrants who were not parents and whose children could not be linked between the 1940 and 2000 censuses. As such, our first-generation analyses cannot be generalized to the wider population of southerners who moved to the North prior to 1940.
Despite these limitations, ours is the first study to investigate how individual participants in the Great Migration fared with respect to escaping racially segregated urban areas compared to their counterparts in the North and South who had not engaged in interregional migration. Therefore, our findings, and the conclusions they support, represent an important contribution to our understanding of the long-term consequences of one of the most important demographic events in US history. Combined with Boustan’s (2016) conclusion that the Great Migration contributed to “white flight” from northern central cities, our findings offer little reason to believe that the migrants’ decision to leave the South had significant, salutary consequences for their exposure to racial residential segregation. Rather, blacks experience similar levels of segregation regardless of their migration status, region of residence, and socioeconomic status. Despite enormous changes between 1940 and 2000, and despite the dramatic demographic transformations brought on by the Great Migration, the African American experience across the United States therefore has been and remains one of entrenched inequality and systematic residential separation.
Acknowledgments
This research was conducted as a part of the Census Longitudinal Infrastructure Project (CLIP). Any opinions and conclusions expressed herein are those of the authors and do not necessarily represent the views of the US Census Bureau. Partial support for this research came from a Shanahan Endowment Fellowship and a Eunice Kennedy Shriver National Institute of Child Health and Human Development training grant, T32 HD007543, as well as a Eunice Kennedy Shriver National Institute of Child Health and Human Development research infrastructure grant, P2C HD042828 to the Center for Studies in Demography & Ecology at the University of Washington. Support for this research also came from the University of Colorado Population Center (2P2CHD066613). We would like to thank the two anonymous reviewers for their valuable feedback and suggestions.