1. Introduction
Oceanic plates with normal mid-ocean ridge basalt (N-MORB) geochemical affinities and large abyssal plains are generally subducted smoothly without leaving a trace, whereas those with large seamounts, oceanic plateaus and rugged seafloor bathymetry, which form major asperities on downgoing slabs, commonly disrupt the subduction processes, causing upper plate deformation, mega-earthquakes and punctuation in magmatism (Cloos, Reference Cloos1993; Tankut et al. Reference Tankut, Dilek and Önen1998; Dominguez et al. Reference Dominguez, Malavieille and Lallemand2000; Dilek, Reference Dilek, Dilek and Robinson2003; Furnes et al. Reference Furnes, De Wit and Dilek2014). While parts of such asperities become entirely subducted, large portions of them may become accreted as thrust sheets into subduction–accretion complexes contributing significantly to continental growth (Dilek, Reference Dilek, Dilek and Robinson2003; Sarifakioglu et al. Reference Sarifakioglu, Dilek, Sevin and Sorkhabi2017; Wakita et al. Reference Wakita, Nakagawa, Tanaka and Oyama2019). Considering the fact that much of the modern western Pacific Ocean floor is covered with seamounts, seamount chains and oceanic plateaus, the arrival of these bathymetric highs and structures at the western Pacific Rim trenches in the geological future should affect the continental margin tectonics there, as has already been demonstrated by seismic investigations along the Central and South American continental margins (Kopp et al. Reference Kopp, Flueh, Papenberg and Klaeschen2004; Watts et al. Reference Watts, Koppers and Robinson2016; Morrell, Reference Morrell2016). Volcanic edifices of oceanic plateaus are several orders of magnitude larger than most seamounts on the ocean floor, and therefore their accretion into active continental margins may result in significant changes in slab dynamics and even in subduction jump and polarity changes (i.e. Kimura et al. Reference Kimura, Sakakibara and Okamura1994; Petterson et al. Reference Petterson, Neal, Mahoney, Kroenke, Saunders, Babbs, Duncan, Tolia and McGrail1997). Collision, subduction and accretion of seamounts and oceanic plateaus thus leave distinctive tectonic footprints in the geological records of modern and fossil convergent margins.
Most of Japan, once a part of the Eurasian active continental margin in the Jurassic through the Palaeogene, and then as an island arc chain after the opening of the Sea of Japan around the Miocene (Maruyama et al. Reference Maruyama, Isozazki, Kimura and Terabayashi1997), has been situated in the upper plate of various subduction zones since the latest Permian – early Triassic; hence, its continental growth has been shaped predominantly by continental margin tectonics and accretionary prism construction, as well as subduction-related magmatism. Not surprisingly then, the geology of Japan also displays a rich history of repeated events of seamount and oceanic plateau collision and accretion. The most salient examples include the seamounts or oceanic plateaus in the late Permian Akiyoshi accretionary complex (Sano & Kanmera, Reference Sano and Kanmera1991 a, b), a Permian oceanic plateau in the late Jurassic Mino–Tanba accretionary wedge (Koizumi & Ishiwatari, Reference Koizumi and Ishiwatari2006; Ichiyama et al. Reference Ichiyama, Ishiwatari and Koizumi2008), the Jurassic – Early Cretaceous Mikabu seamounts or oceanic plateau in the Middle–Late Cretaceous Sambagawa metamorphic belt (Kugimiya & Takasu, Reference Kugimiya and Takasu2002; Terabayashi et al. Reference Terabayashi, Okamoto, Yamamoto, Kaneko, Ota, Maruyama, Katayama, Komiya, Ishikawa, Anma, Ozawa, Windley and Liou2005), and the Kinan–Muroto and palaeo-Zenisu seamounts on the Philippine Sea plate in the Plio–Pleistocene Nankai accretionary wedge (Maruyama et al. Reference Maruyama, Isozazki, Kimura and Terabayashi1997; Park et al. Reference Park, Tsuru, Kaneda and Kon1999; Kawamura et al. Reference Kawamura, Ogawa, Anma, Yokoyama, Kawakami, Dilek, Moores, Hirano, Yamaguchi and Sasaki2009; Anma et al. Reference Anma, Ogawa, Moore, Kawamura, Sasaki, Kawamaki, Dilek, Michiguchi, Endo, Akaiwa, Ogawa, Anma and Dilek2011). Large fragments of all these accreted seamounts and oceanic plateaus occur mainly in the central to southwestern parts of Japan.
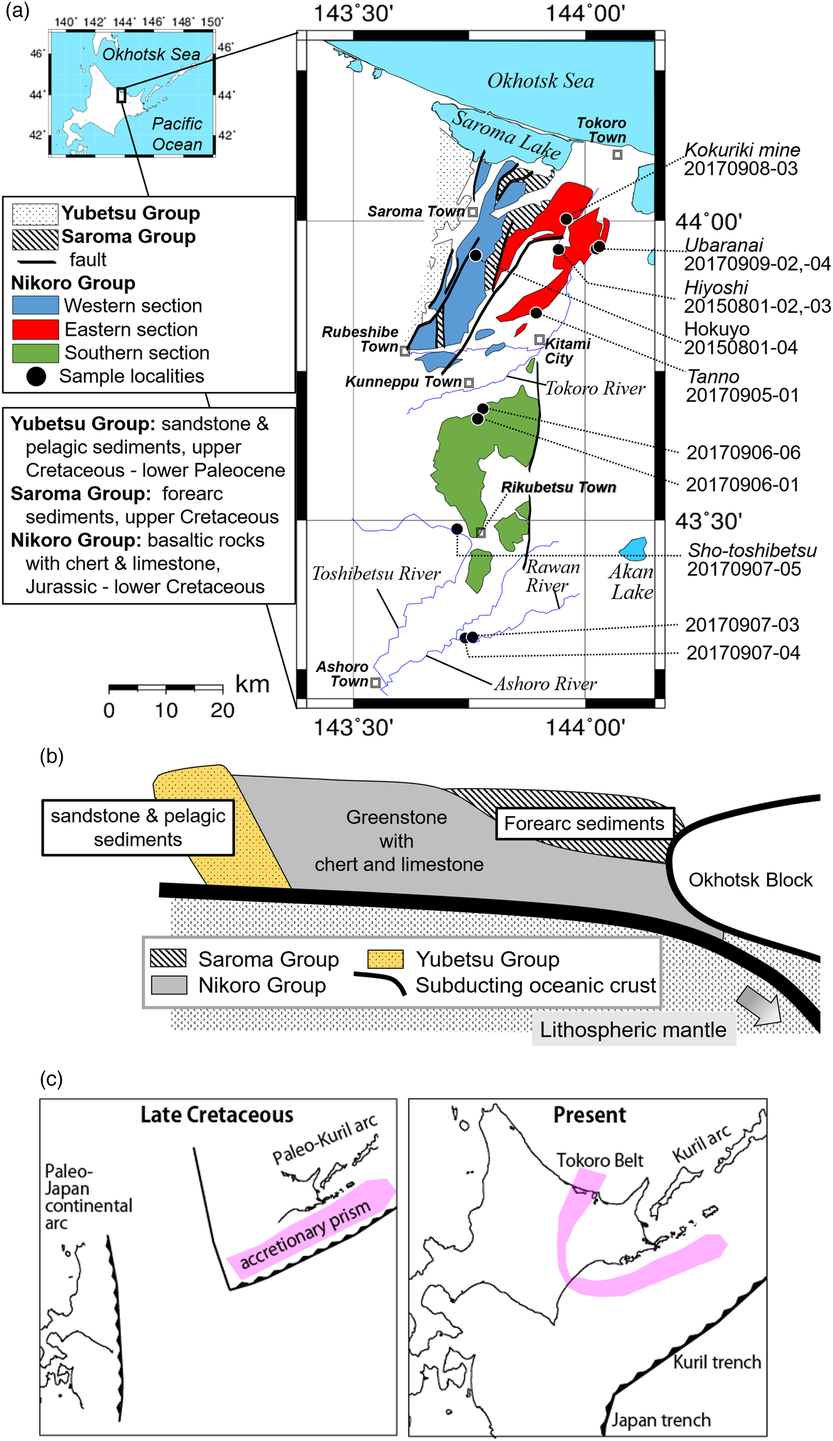
The occurrence of Jurassic mafic volcanic rocks within a Late Cretaceous accretionary complex has been also reported from NE Hokkaido (Sakakibara et al. Reference Sakakibara, Isozaki, Nanayama and Narui1993) and from the SE part of the Sakhalin Peninsula to the north in Far East Russia (Zharov, Reference Zharov2005). Upper Cretaceous oceanic basalt and seamount fragments occur in thrust sheets within the Late Cretaceous and younger subduction–accretion complexes in the Hidaka and Tokoro tectonic belts of central to eastern Hokkaido, the Shimanto Complex of SW Japan and the Franciscan Complex of California, USA (Bamba, Reference Bamba1984; Kimura et al. Reference Kimura, Maruyama, Isozaki and Terabayashi1996, Reference Kimura, Hashimoto, Yamaguchi, Kitamura, Ujiie, Moreno, Wallis, Kojima and Gibbons2016; Ogawa et al. Reference Ogawa, Mori, Tsunogae, Dilek and Harris2015; Ueda, Reference Ueda, Moreno, Wallis, Kojima and Gibbons2016). Basaltic rocks in the Tokoro Belt occupy an area larger than 80 km in width (Fig. 1), making it one of the biggest on-land exposures of non-ophiolitic, allochthonous mafic lava occurrences in subduction–accretion complexes around the northern Pacific Rim, since most other examples are 10 km or smaller in size. Thus, the Tokoro Belt in Hokkaido presents a unique case to examine the geochemical and tectonic make-up of an unusually large, Late Cretaceous seamount, which was accreted to the late Mesozoic active margin of Japan. Yet field-based geochemical data and observations from the Upper Cretaceous basalts of the Tokoro Belt have been limited to several restricted localities in its eastern and western sections (Bamba, Reference Bamba1984; Sakakibara, Reference Sakakibara1991; Yamasaki & Nanayama, Reference Yamasaki and Nanayama2017).
(a) Geological map of the Tokoro Belt and sample localities (after Sakakibara, Reference Sakakibara1991). (b) Interpretive cross-section of the Tokoro Belt (after Ueda, Reference Ueda, Moreno, Wallis, Kojima and Gibbons2016). (c) Inferred tectonic reconstruction of the palaeo-Kuril island arc with the Tokoro Belt as its accretionary complex during the Late Cretaceous (Zharov, Reference Zharov2005; Yang, Reference Yang2013; Domeier et al. Reference Domeier, Shephard, Jakob, Gaina, Doubrovine and Torsvik2017). Palaeo-latitudes of the original position of this Kuril island arc are still poorly constrained (Nanayama et al. Reference Nanayama, Kanamatsu and Fujiwara1993; Bazhenov & Burtman, Reference Bazhenov and Burtman1994).

In this paper, we report on the distribution of mafic volcanic and volcaniclastic rock units, and the spatially associated chert and limestone layers in the Tokoro Belt in NE Hokkaido, and present new geochemical data from the most representative extrusive rock suites. We show that these volcanic rock units are composed mainly of ocean island basalts (OIB), and represent thrust slices of a Hawaiian-style, large shield volcano on a subducting palaeo-oceanic plate (Izanagi or Palaeo-Pacific plate). Incorporation of a large seamount of this size into the Late Cretaceous continental margin of NE Japan must have affected the structural dynamics and architecture of the accretionary prism and the magmatic arc system in the upper plate. The results of this study should stimulate further field-based structural, geochemical and geochronological studies of this Late Cretaceous seamount accretion event in northern Hokkaido and its geographic extension in the SE Sakhalin Peninsula.
2. Regional geology and summary of the accretion tectonics of NE Hokkaido
Extensive outcrops of a Late Cretaceous – Palaeogene fore-arc magmatic sequence (Nemuro Group) of the Palaeo-Kuril arc–trench system (Naruse, Reference Naruse2003; Ikeda & Goto, Reference Ikeda and Goto2018) and Cretaceous mafic volcanic, volcaniclastic and sedimentary rock sequences of the Tokoro Belt in NE Hokkaido collectively represent a late Meosoic intraoceanic arc terrane and its subduction–accretion complex (Fig. 1c; Zharov, Reference Zharov2005; Yang, Reference Yang2013; Domeier et al. Reference Domeier, Shephard, Jakob, Gaina, Doubrovine and Torsvik2017; Ikeda & Goto, Reference Ikeda and Goto2018). The palaeo-latitudinal origin of this exotic arc is still poorly constrained (Nanayama et al. Reference Nanayama, Kanamatsu and Fujiwara1993; Bazhenov & Burtman, Reference Bazhenov and Burtman1994). The Tokoro Belt has been recognized as a Late Cretaceous accretionary complex developed adjacent to the palaeo-Kuril arc, which collided with the palaeo Japan arc (continental margin) in the Palaeogene (Fig. 1c; Nanayama et al. Reference Nanayama, Kanamatsu and Fujiwara1993). The Tokoro Belt has been subdivided into three groups, the Nikoro, Saroma and Yubetsu Groups. The Nikoro Group is characterized mainly by the occurrence of abundant metabasalts (Ueda, Reference Ueda, Moreno, Wallis, Kojima and Gibbons2016) (Fig. 1a). The Saroma Group that is composed of fore-arc basin sedimentary sequences unconformably overlies the Nikoro Group (Kiminami & Kontani, Reference Kiminami, Kontani, Hashimoto and Uyeda1983; Kiminami et al. Reference Kiminami, Kito and Tajika1985 a, b) (Fig. 1b), and includes Upper Cretaceous radiolarian chert clasts (Kanamatsu et al. Reference Kanamatsu, Nanayama, Iwata and Fujiwara1992). Timing of the accretion of the Tokoro Belt has been constrained by the age of the oldest sedimentary units of the overlying Saroma Group and the youngest biostratigraphic ages of radiolarian chert units in the Nikoro Group (Sakakibara et al. Reference Sakakibara, Isozaki, Nanayama and Narui1993). Geochemical compositions of detrital clinopyroxenes from the Saroma Group are similar to those of typical island arc pyroxenes (e.g. lower contents of Ti and Cr than those from non-orogenic tholeiites) (Leterrier et al. Reference Leterrier, Maury, Thonon, Girard and Marchal1982); these detrital pyroxenes and their host rocks are interpreted to have been derived from the palaeo-Kuril island arc (Kanamatsu et al. Reference Kanamatsu, Nanayama, Iwata and Fujiwara1992; Ikeda & Goto, Reference Ikeda and Goto2018). The Yubetsu Group has been interpreted as an early Palaeocene accretionary prism, which constitutes part of the west-vergent Hidaka collision zone (Iwata & Kato, Reference Iwata and Kato1986; Iwata & Tajika, Reference Iwata and Tajika1986, Reference Iwata and Tajika1992; Tajika, Reference Tajika1988; Nanayama, Reference Nanayama1992 a, b; Nanayama et al. Reference Nanayama, Kanamatsu and Fujiwara1993; Arita et al. Reference Arita, Ikawa, Ito, Yamamoto, Saito, Nishida, Satoh, Kimura, Watanabe, Ikawa and Kuroda1998).
The Nikoro Group consists of green-coloured sedimentary rocks and metabasaltic volcanic units locally associated with hypabyssal dolerite and gabbro intrusions, and minor trachyte and tonalite. Clastic rocks in the Nikoro Group are composed of sandstone and conglomerate, made mainly of basaltic material and less abundant clasts of granite and crystalline schist (e.g. Research Group of the Tokoro Belt, 1984). Metavolcanic rocks are spatially associated with radiolarian chert and limestone (micritic limestone and chalk deposits made of cocoliths), representing pelagic deposits (Bamba, Reference Bamba1984). Hashimoto (Reference Hashimoto1960) reported the occurrence of reef-building stromatoporoids from the Upper Jurassic Ainonai limestone in the western section of the Nikoro Group. Jurassic – Lower Cretaceous radiolarians in chert interlayers (Iwata et al. Reference Iwata, Watabe, Nakamura and Uozumi1983; Kiminami et al. Reference Kiminami, Suizu and Kontani1983) have been used to constrain the youngest eruption age of the Nikoro basalts (Sakakibara et al. Reference Sakakibara, Isozaki, Nanayama and Narui1993).
The Nikoro Group is geographically subdivided into western, eastern and southern sections (e.g. Bamba, Reference Bamba1984; Sakakibara et al. Reference Sakakibara, Isozaki, Nanayama and Narui1993; Ueda, Reference Ueda, Moreno, Wallis, Kojima and Gibbons2016). Volcaniclastic rocks in the western section consist mainly of hyaloclastites with a common occurrence of limestone and Lower Cretaceous radiolarian chert (Sakakibara et al. Reference Sakakibara, Isozaki, Nanayama and Narui1993). Pillow lavas, on the other hand, are dominant in the eastern section, where chert is the most abundant pelagic sedimentary rock type with minor occurrences of limestone. Chert units occur without any limestone interlayers in the NE part of the group.
Bamba (Reference Bamba1984) divided the northern Nikoro Group into an OIB-dominant western section and MORB-dominant eastern section based on the major and rare earth element compositions of a limited number of rock samples. Although a majority of the Nikoro Group volcanic rocks underwent low-grade metamorphism of zeolite or prehnite–pumpellyite phase (150–250 °C at 0.1–0.25 GPa), higher-pressure – low-temperature metamorphic assemblages, containing lawsonite–sodic pyroxene, epidote–sodic pyroxene or epidote–actinolite (200–300 °C at 0.5–0.6 GPa) have been reported from volcanic rock occurrences in the NE part. Here, the middle Jurassic – Upper Cretaceous radiolarian ages of the chert interlayers are older than those chert outcrops in the western section (Sakakibara, Reference Sakakibara1991; Sakakibara et al. Reference Sakakibara, Isozaki, Nanayama and Narui1993). Trachyte and gabbro exposures are also reported from the eastern section of the Nikoro Group (Bamba, Reference Bamba1980, Reference Bamba1981). Both hyaloclastites and pillow lavas with chert and limestone intercalations occur in the southern section (Mitani et al. Reference Mitani, Osanai and Haahimoto1958,Reference Mitani, Fujiwara and Ishiyama1960, Reference Mitani, Fujiwara and Ishiyama1964; Suzuki & Asai, Reference Suzuki and Asai1963), although there are no geochemical data available from these volcanic rocks. Kanamatsu et al. (Reference Kanamatsu, Nanayama, Iwata and Fujiwara1992) reported Upper Jurassic radiolarian ages from red chert layers in the southernmost portion of the southern Nikoro Group.
3. Petrography
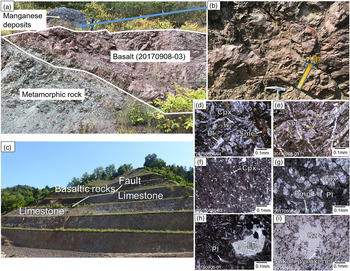
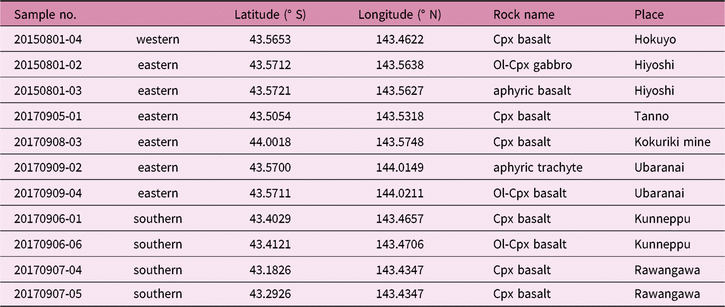
Localities of 10 basaltic rock samples analysed in this study are shown in Figure 1a, and a summary of the analysed samples is presented in Table 1. Outcrop photos of some of these samples and the photo-micrographs of representative rock samples are presented in Figure 2. Samples (20170906-01, 20170907-04 and 20170909-04) display sub-circular vesicles, filled with low-temperature, secondary minerals such as calcite. Most samples are composed mainly of euhedral plagioclase, secondary minerals (e.g. chlorite, smectite and/or epidote) and minor opaque minerals in the groundmass. Sample 20150801-04 from the western section contains plagioclase, clinopyroxene and secondary minerals, and shows interstitial to intergranular textures.
Representative petrography and outcrop exposures of Tokoro greenstones. (a) Outcrop at the Kokuriki Mine in the eastern section of the Nikoro Group. Sample 20170908-03 9 (basalt) occurs between manganiferous hematite ore (Bamba, Reference Bamba1984) and a metamorphic rock. (b) Pillow lavas under manganese deposits. (c) Outcrop at the Kunneppu limestone mine in the southern section of the Nikoro Group (Kunneppu Lime Industry Co., Ltd), where sample 20170906-01 was collected. (d–i) Photo-micrographs of samples (open nicol). Scale bar is 0.1 mm across. Abbreviations for key minerals: Pl – plagioclase; Sme – smectite; Cpx – clinopyroxene; Pmp – pumpellyite; Ep – epidote; Qz – quartz. (d) Basalt samples (20150801-04) showing an interserstial to intergranular texture. (e) Basalt sample (20170905-01). (f) Aphyric basalt (20150801-03 from Hiyoshi) showing a dendritic texture with micro-clinopyroxene and opaque minerals. (g) Basalt sample (20170908-03) showing an ophitic texture. (h) Basalt sample (20170906-01) showing an interserstial to intergranular texture. (i) Trachyte sample (20170909-02) showing a trachytic texture.

Summary of sample information

Cpx: clinopyroxene. Ol: Olivine.
We have obtained five samples from various mines in the eastern section that are now closed. The sample localities are shown in Figure 1a and Table 1. Sample 20170905-01 from Tanno is a basalt composed of altered plagioclase with secondary minerals replacing clinopyroxene. Sample 20150801-02 from Hiyoshi is a gabbro composed of altered plagioclase, fresh olivine, fresh clinopyroxene, and chlorite. Sample 20150801-03, also from Hiyoshi, is an aphyric basalt, composed mainly of altered plagioclase with a dendritic texture containing calcite and some quartz veins. Sample 20170908-03 from Kokuriki mine is a basaltic lava composed of clinopyroxene and altered plagioclase, displaying an ophitic texture. Sample 20170909-04 from Ubaranai consists of altered plagioclase, clinopyroxene, olivine and secondary minerals in a groundmass with an intergranular texture. Pillow lava sample 20170909-02 from Ubaranai is an aphyric trachyte composed of plagioclase, chlorite and pumpellyite (probably altered from clinopyroxene or olivine), and is notably characterized by the presence of probably higher metamorphic grade minerals in a trachytic groundmass (e.g. alkali pyroxene). Sakakibara (Reference Sakakibara1991) reported the occurrence of sodic pyroxene in higher-grade metamorphic rocks from the NE part of the Nikoro Group.
We collected one sample from the eastern and four samples from the southern section of the Nikoro Group in this study. Sample 20150801-04, a Cpx-bearing basalt, is obtained from Hokuyo in a central location of the eastern section of the Tokoro Belt. Samples 20170906-01 (Fig. 2c) and 20170906-06 came from Kunneppu, sample 20170907-05 from Shotoshibetsu, and sample 20170907-04 from the Rawangawa River (Fig. 1a). Most samples from the southern section show intergranular textures. Sample 20170906-06 consists of olivine and clinopyroxene with secondary minerals. Sample 20170907-04 contains pumpellyite phenocrysts.
4. Sample preparation and analytical methods
All samples were split and pulverized after excluding the altered parts and some secondary veins in the rocks. We analysed whole-rock major elements of sample by X-ray fluorescence (XRF) spectrometer (Rigaku RIX2100, Department of Earth Sciences, Graduate School of Science, Tohoku University). We used glass discs formed by fused mixtures of 1 g of powdered samples and 5 g of anhydrous lithium tetraborate (Li2B4O7) flux. The trace elements were analysed by inductively coupled plasma – mass spectrometry (ICP-MS) (Thermo Fisher Scientific iCAP Q, Department of Systems Innovation, School of Engineering, the University of Tokyo). The method for preparing our samples followed Machida et al. (Reference Machida, Ishii, Kimura, Awaji and Kato2008, Reference Machida, Hirano, Sumino, Hirata, Yoneda and Kato2015). The powdered sample of 0.05 g was completely dissolved in mixed acid (1 mL HNO3, 2.5 mL HClO4 and 2.5 mL HF). The solution was heated for 10 hours at 100–110 °C, for a day at 180–200 °C, and for 12 hours at 180–210 °C until full evaporation. The residue was then re-dissolved in 1 mL of mixed acid (HNO3:HCl:HF = 20:5:1). After heating at 80 °C for 20 min and at 110 °C for 2 hours, the solution was diluted by Milli-Q water to mass ratio of 1:5000. Spectral overlaps from oxides and hydroxides (44Ca16O on 60Ni, 47Ti16O on 63Cu, 50Ti16O on 66Zn, 135Ba16O on 151Eu, 137Ba16O on 153Eu, 141Pr16O on 157Gd, 143Nd16O on 159Tb, 147Sm16O and 146Nd16O1H on 163Dy, 149Sm16O on 165Ho, 150Nd16O and 150Sm16O on 166Er, and 165Ho16O on 181Ta) were corrected following the method described by Aries et al. (Reference Aries, Valladon, Polvé and Dupré2000). Differences between our analytical results and the accepted values for the geochemical standards JB-2 (basalt from the Oshima Volcano) and JB-3 (basalt from Fuji Volcano), issued by the Geological Survey of Japan, were typically within 5 %.
5. Geochemistry and tectonic discrimination of the Nikoro Group lavas
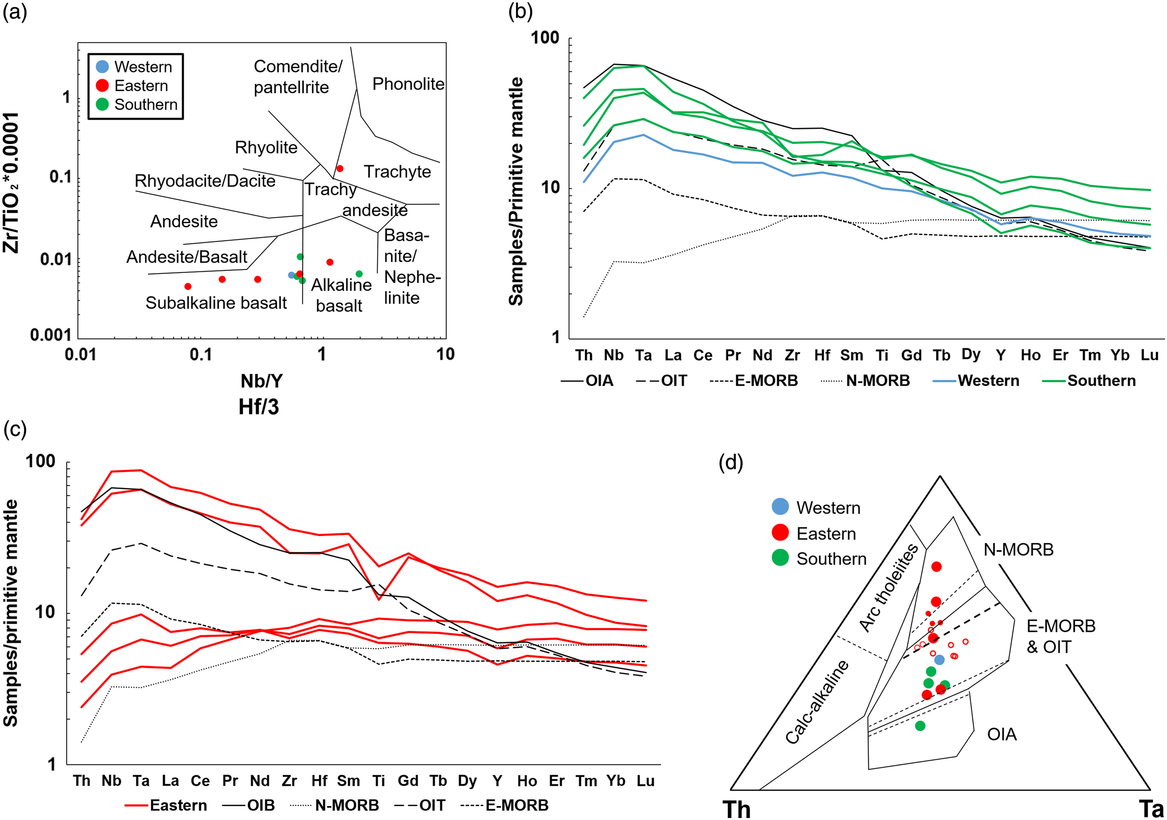
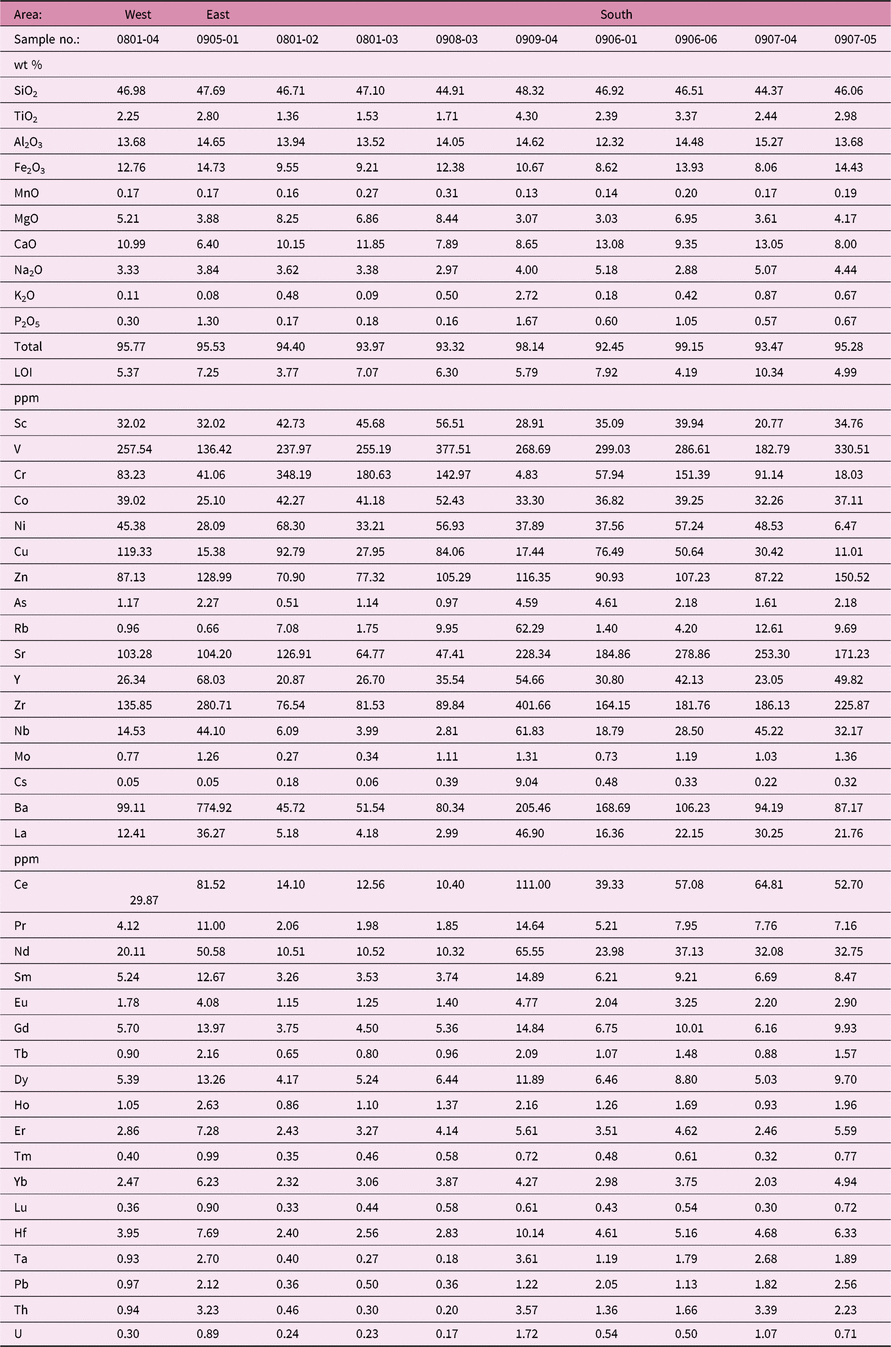
Major and trace element compositions of the analysed samples are given in Table 2. SiO2 concentrations of the samples range between 44.3 and 48.5 wt %, except for sample 20170909-02 (66.9 wt %). All samples are made of subalkaline and alkaline basalts, except for the trachyte sample 20170909-02. We used the Nb/Y vs Zr/TiO2 discriminant diagram (Winchester & Floyd, Reference Winchester and Floyd1977; Fig. 3a) using immobile elements in order to distinguish the rock types because of the alteration effects (occurrences of secondary minerals) observed in some of the samples.
Geochemical discrimination diagrams. (a) Zr/TiO2 vs Nb/Y plot after Winchester & Floyd (Reference Winchester and Floyd1977). (b) Primitive mantle-normalized spidergram for the samples from the western and southern sections of the Nikoro Group (values of OIA, N-MORB and E-MORB are referenced from Sun & McDonough, Reference Sun, McDonough, Sanders and Norry1989 and OIT from Verma et al. Reference Verma, Rosales-Rivera, Díaz-González and Quiroz-Ruiz2017). (c) Primitive mantle-normalized spidergram for the samples from the eastern section of the Nikoro Group. (d) Hf/3–Th–Ta diagram (Wood, Reference Wood1980). Small open and filled circles show previous data of gabbros and basalts at Hiyoshi located in the eastern section, respectively (Yamasaki & Nanayama, Reference Yamasaki and Nanayama2017).

Geochemical composition of greenstones

LOI: loss-on-ignition
Primitive mantle-normalized spider diagrams for trace element distributions are shown in Figure 3b, c (Sun & McDonough, Reference Sun, McDonough, Sanders and Norry1989; Verma et al. Reference Verma, Rosales-Rivera, Díaz-González and Quiroz-Ruiz2017). Trace element patterns of the analysed samples are predominantly similar to those of OIBs (Fig. 3b, c). Only three samples from the eastern section (20170801-2, 20170801-03, 20170908-03) display patterns similar to those of N-MORB or E-MORB (enriched-MORB) lavas. These data are consistent with the previous reports from the eastern section (Bamba, Reference Bamba1984; Yamasaki & Nanayama, Reference Yamasaki and Nanayama2017). However, the occurrence of OIBs in the eastern and southern sections has not been reported before (Fig. 3c).
All the rock samples from both the southern and western sections of the Nikoro Group exhibit characteristic trace element patterns of OIT (oceanic island tholeiite) or OIA (ocean island alkaline basalt) (Fig. 3b). Most of the OIBs in this study show enrichment in heavy rare earth elements (HREE), excluding sample 20170907-04 that shows patterns similar to those of OIA (Sun & McDonough, Reference Sun, McDonough, Sanders and Norry1989). The HREE enrichments of OIBs result from partial melting of a mantle source without residual garnet beneath a thinner than normal lithosphere near a mid-ocean ridge (Ellam, Reference Ellam1992). The transitional patterns between N-MORB and OIA geochemical affinities we have observed in our samples may reflect thickness variations in the oceanic lithosphere. The Hf/3–Th–Ta diagram (Wood, Reference Wood1980) also shows variations among the OIA, E-MORB and OIT affinities in the southern and western sections of the Nikoro Group, and among the N-MORB, E-MORB and OIT affinities in the eastern section, respectively (Fig. 3d).
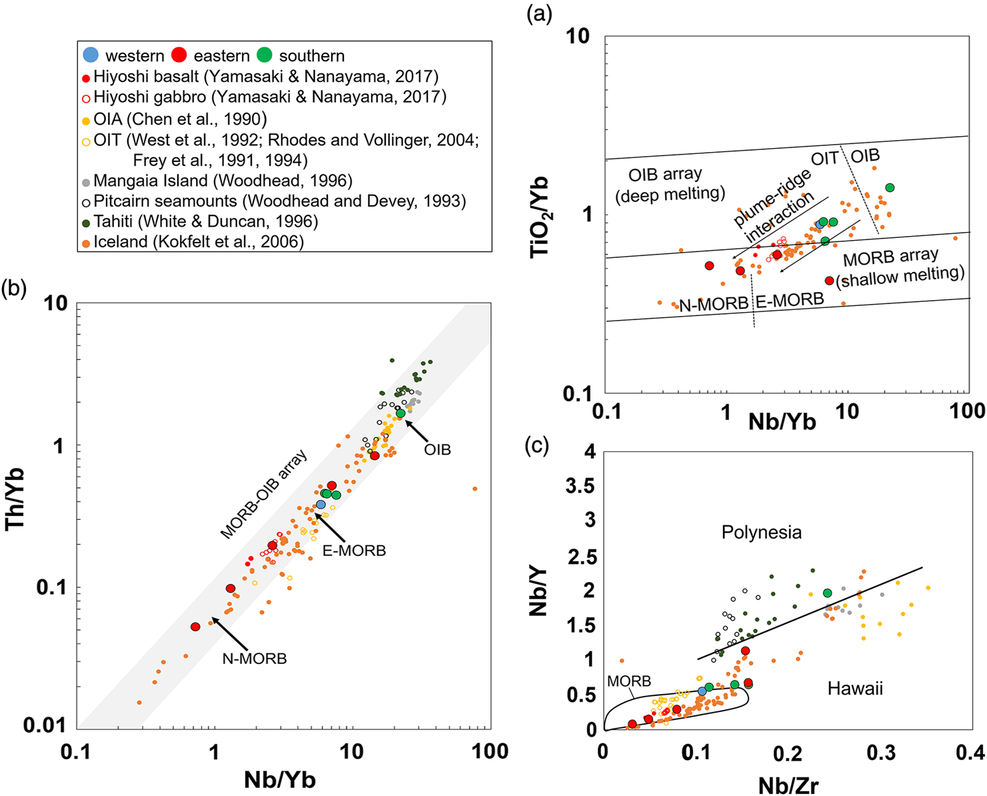
We have also used the TiO2/Yb vs Nb/Yb diagram to estimate the influence of plume–ridge interaction in the melt evolution of the Nikoro basalts (Fig. 4a) (Pearce, Reference Pearce2008). A plume–ridge interaction trend is recognizable, as Yamasaki & Nanayama (Reference Yamasaki and Nanayama2017) also reported from E-MORB-type gabbros and basalts in the Hiyoshi area, in contrast to samples 20150801-02 and 20150801-03 in this study.
Comparative geochemistry of representative basaltic rocks from hotspot volcanic centres on the modern Pacific plate. (a) TiO2/Yb vs Nb/Yb diagram (Pearce, Reference Pearce2008). Two arrows show plume–ridge interaction. (b) Th/Nb vs Nb/Yb diagram (Pearce, Reference Pearce2008). Oceanic basalts of MORB and OIB plot within MORB–OIB array. (c) Nb/Zr vs Nb/Y diagram (after Tatsumi et al. Reference Tatsumi, Shinjoe, Ishizuka, Sager and Klaus1998).

On a Nb/Yb vs Th/Yb diagram (Fig. 4b) all analysed samples plot within the mantle array extending from MORB to OIB (Pearce & Peate, Reference Pearce and Peate1995), but do not show any displacement into the island arc field above the mantle array (Pearce, Reference Pearce2008). We have also plotted in Figure 4 the data available from basalt and gabbro outcrops in Hiyoshi town in the eastern section, as previously reported by Yamasaki & Nanayama (Reference Yamasaki and Nanayama2017). All the basaltic rocks in the western and southern sections have clear E-MORB or OIB affinities, whereas those in the eastern section display N-MORB, E-MORB and OIB affinities.
6. Tectonic setting of Nikoro volcanic suites
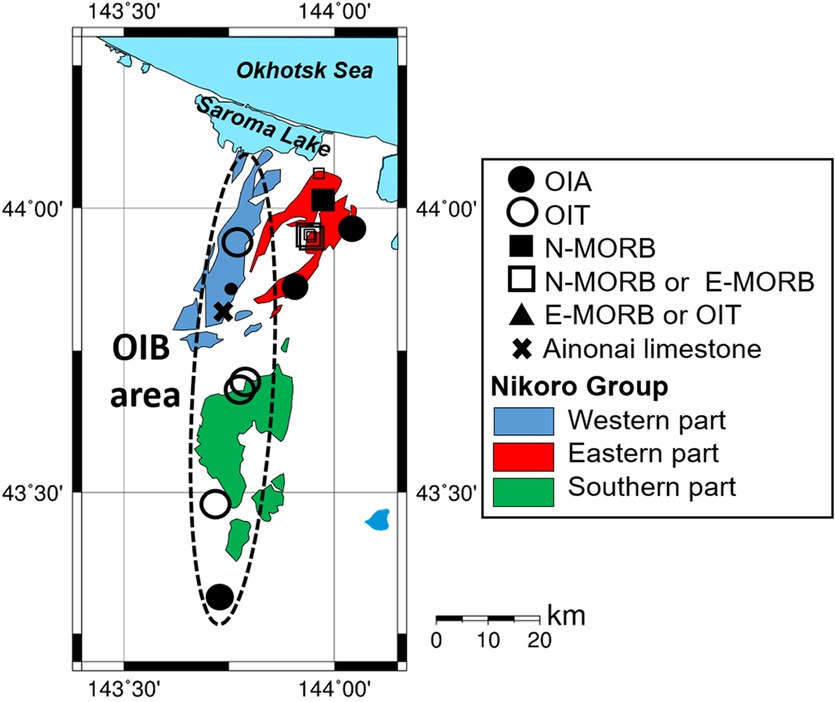
Combined geochemical affinities and geological features of the volcanic rock suites from the Nikoro Group provide important information about their tectonic environment of eruption. The results of our study confirm that the geochemical characteristics of the Nikoro volcanic assemblages rule out any subduction zone influence in their melt evolution. All basaltic rocks in the western, eastern and southern sections of the Nikoro Group are spatially and temporally associated with limestones, mainly pelagic in nature. Global examination of some of the best-documented occurrences of basalt–limestone sequences in accretionary prism complexes in different orogenic belts has shown that these two lithologies generally coexist as part of the stratigraphy of accreted ocean islands (Ankara mélange: Tankut et al. Reference Tankut, Dilek and Önen1998; Sarifakioglu et al. Reference Sarifakioglu, Dilek and Sevin2014, Reference Sarifakioglu, Dilek, Sevin and Sorkhabi2017; Japanese accretionary prism: Safonova et al. Reference Safonova, Maruyama, Kojima, Komiya, Krivonogov and Koshida2016; southern Tibet suture zone: Liu et al. Reference Liu, Yang, Dilek, Xu, Xu, Liang, Chen and Lian2015). Therefore, we infer that the E-MORB- and OIT-type basaltic rock and limestone exposures in the western section represent accreted slices of a fossil oceanic island or seamount, instead of basalt-sediment accumulations in abyssal depths. We posit that limestone occurrences in the western and southern sections (Mitani et al. Reference Mitani, Osanai and Haahimoto1958, Reference Mitani, Fujiwara and Ishiyama1960, Reference Mitani, Fujiwara and Ishiyama1964; Suzuki & Asai, Reference Suzuki and Asai1963) and reefal limestones with stromatoporoids, reported by Hashimoto (Reference Hashimoto1960) from the Ainonai area in the western section, were also part of this accreted seamount. This Jurassic – Early Cretaceous seamount was incorporated into the accretionary prism of a Late Cretaceous convergent margin near the latitudes of modern Far East Asia. The occurrences of limestone and chert interlayers in the eastern section of the Nikoro Group are, on the other hand, limited in their areal extent. They have been reported only from the Ubaranai region in the eastern section (Sakakibara et al. Reference Sakakibara, Isozaki, Nanayama and Narui1993) where we collected sample 20170909-04, which shows an OIA geochemical affinity.
Sakakibara (Reference Sakakibara1991) reported the occurrence of high-pressure metamorphic rocks in the northern part of the eastern section in the Nikoro Group where MORB-type basalts exist (Bamba, Reference Bamba1984). However, OIB-type basalts in the western and southern sections display very low-grade metamorphic overprint (zeolite phase). These observations suggest that MORB-type basalts in the eastern section were subducted to deeper structural levels, where they underwent high-pressure metamorphism. These high-pressure metamorphic and highly deformed rocks were subsequently exhumed and incorporated into an accretionary prism complex now exposed in eastern Hokkaido.
Although the Nikoro Group consists predominantly of basaltic lavas and volcaniclastic rocks with OIB affinities, its sandstone and conglomerate units locally contain boulders and clasts of granite and greenschist (Research Group of the Tokoro Belt, 1984). These rocks were likely originating from an island arc system, which was in close proximity to the eruptive setting of the OIBs in the Tokoro Group prior to its accretion to the convergent margin of Japan.
We have compared the geochemical compositions of the Nikoro Group OIBs to modern OIB occurrences, such as the Hawaiian and French Polynesian hotspot-generated volcanic rocks. Trace element ratios (Nb/Zr–Nb/Y) of the analysed OIB-type basaltic rocks in the Nikoro Group are highly similar to those of Hawaiian lavas, rather than those of French Polynesian lavas (Fig. 4c; Tatsumi et al. Reference Tatsumi, Shinjoe, Ishizuka, Sager and Klaus1998). The Hawaiian hotspot magmatism has produced volcanoes with larger edifices in comparison to the French Polynesian hotspots, which have produced small volcanoes composed mainly of alkaline magmas (Devey et al. Reference Devey, Lackschewitz, Mertz, Bourdon, Cheminee, Dubois, Guivel, Hekinian and Stoffers2003). The Hawaiian tholeiitic lavas at Haleakala, for example, are recognized as a product of higher degrees of melting than the intercalated alkaline lavas, due to varying degrees of melting of a compositionally homogeneous source (Chen et al. Reference Chen, Frey, Garcia, Dalrymple and Hart1991). The OIBs in the Nikoro Group are composed of both tholeiitic and alkaline basalts and occupy a nearly 80 km wide area in the western and southern sections (Fig. 5). Yamasaki & Nanayama (Reference Yamasaki and Nanayama2017) have proposed that E-MORB-type basalts and gabbros in the eastern section of the Nikoro Group formed at a plume-influenced ridge–ridge–ridge triple junction based on their geochemical analysis. Although there is no structural and tectonic evidence for the existence of a ridge–ridge–ridge triple junction in the geological record of northern Hokkaido, our geochemical data from basaltic rocks from this region show HREE enrichments and a transitional variation from N-MORB to OIA affinities and support a plume–ridge interaction model for the origin of basaltic rocks in the Nikoro Group.
Tectonic interpretations of greenstones estimated by the geochemical composition and the mode of occurrence on the sample localities. Small circle and squares show data from previous studies (Bamba, Reference Bamba1984; Yamasaki & Nanayama, Reference Yamasaki and Nanayama2017). Cross symbol shows a fossil locality (Hashimoto, Reference Hashimoto1960).

The occurrence of voluminous OIBs and turbiditic rocks in the Nikoro Group in NE Hokkaido continues northwards into the Tonino–Aniva Peninsula in southern Sakhalin (Russia), where the coeval (Campanian) Ozerskii accretionary prism containing MORB-type tholeiites is exposed (Zharov, Reference Zharov2005). We interpret the OIB-type Nikoro Group and its northern extension in southern Sakhalin as a Hawaii-type seamount, composed of large shield volcano(es) that were constructed near a near mid-ocean ridge environment on the downgoing Palaeo-Pacific (or Izanagi) oceanic plate. The collision and accretion of this large seamount with a trench off the coast of Asia took place in the latest Cretaceous. The subsequent collision of the Kuril island arc and its fore-arc lithospheric sliver with the Japan island arc system in the middle Miocene (~12 Ma; Kusunoki & Kimura, Reference Kusunoki and Kimura1998; De Grave et al. Reference De Grave, Zhimulev, Glorie, Kuznetsov, Evans, Vanhaecke and Mcinnes2016) resulted in rapid exhumation of the buried fossil accretionary prism and its greenstones.
We present this model as a testable working hypothesis, which requires further systematic and extensive field-based structural, geochronological and geochemical–isotopic studies of the basaltic rocks distributed in the Nikoro Group in northern Hokkaido and in southern Sakhalin. Delineation of different lava sequences with different geochemical fingerprints and the associated sedimentary units both in the field and through geochemical and isotopic studies will be crucial for identifying possible fossil eruptive centers in the fossil seamount and the time-progressive melt evolution of its volcanic edifice. Structural, metamorphic and geochronological analyses of deformed greenstones and metasedimentary rocks in the accretionary complex will shed light on the kinematics, timing and tectonic evolution of both subduction–accretion and collision events, which took place in northernmost Japan in the latest Cretaceous through Palaeogene.
7. Conclusions
The Late Cretaceous accretionary complex in NE Hokkaido includes extensive mafic volcanic rocks (Nikoro group in the Tokoro Belt) with OIB and MORB compositions that are intercalated with radiolarian chert and pelagic limestone units. These MORB and OIB lavas show transitional compositions of trace elements and HREE enrichments, implying a plume–ridge interaction tectonic setting for their magmatic construction. OIBs in the eastern part of Hokkaido display high-pressure metamorphic overprint, indicating that they were partially subducted and then subsequently exhumed. The geochemical affinities, the lithological make-up and the areal extent of the mafic rocks in the Nikoro Group are comparable to those of the Hawaiian-type, large edifice seamount shield volcanoes. Basaltic lavas may thus represent an on-land exposure of a large Jurassic – Early Cretaceous seamount formed at a near-ridge environment, which collided with and became accreted to continental margin of Far East Asia in the Late Cretaceous. Collision and accretion of such large seamounts may be responsible for short-term punctuation in steady-state subduction of oceanic plates at active continental margins.
Author ORCIDs
Shunta Sakai 0000-0001-6454-3168; Yildirim Dilek 0000-0003-2387-9575; Naoto Hirano 0000-0003-0980-3929
Acknowledgements
We greatly appreciate the help of Dr K. Nakamura (The University of Tokyo) with the ICP-MS geochemical analyses, and of Dr T. Miyamoto (Tohoku University) with the XRF geochemical analyses. We acknowledge our insightful discussions with Prof. T. Tsujimori on the geology of metamorphic rocks in Hokkaido. Dr D. Paster-Galán, Mr T. Yutani, Mr K. Azami, Mr Y. Katsuragi, and the Kunneppu Lime Industry Co., Ltd. are also acknowledged for their help with obtaining some of the rock samples used in this study. This research was financially supported by the Yamada Science Foundation and the JSPS Japanese–German Graduate Externship. Y. Dilek acknowledges the research funding for his fieldwork in Hokkaido by the Center for Northeast Asian Studies in Tohoku University (Sendai, Japan). Critical and thorough reviews for the Geological Magazine by two referees are gratefully acknowledged.