Introduction
Understanding the dynamics of clay dispersive behavior is essential to the determination of soil properties such as permeability, aggregate stability, crusting, and erosion (Frenkel et al. Reference Frenkel, Goertzen and Rhoades1978; Agassi et al. Reference Agassi, Shainberg and Morin1981; Curtin et al. Reference Curtin, Steppuhn and Selles1994a; Quirk Reference Quirk2001; Mitchell and Soga Reference Mitchell and Soga2005; Shainberg and Levy Reference Shainberg and Levy2005; Hu et al. Reference Hu, Liu, Xu, Du, Yang, Liu, Liu and Zhao2018a). These properties have significant influence on crop production in cultivated areas and geotechnical behavior under infrastructure. Recent investigations of soil structural stability have demonstrated that the dispersed clay (indicated as turbidity) is very influenced by the degree of ionicity of clay–cation bonds (Marchuk and Rengasamy Reference Marchuk and Rengasamy2011; Marchuk et al. Reference Marchuk, Rengasamy, McNeill and Kumar2013b). Therefore, further understanding the dynamics of dispersive clay systems and how the ionicity concept relates to these is of value in moving toward prediction of dispersive behavior on a soil-specific basis.
Since the 1940s, the classical DLVO (Derjaguin, Landau, Verwey, and Overbeek) theory has been used in explaining the dispersion or flocculation behavior of clay particles; such behavior relied on the net effect of attraction of van der Waals forces and repulsion of electrical double layer forces (Derjaguin Reference Derjaguin1941; Verwey and Overbeek Reference Verwey and Overbeek1948). The DLVO theory mainly takes the valence of the electrolyte ions into account, however, regardless of the difference in size and ability to be polarized between electrolytes, etc. The ionicity concept depicts the interactions between the cations and charged clay particles, by considering: (1) the fact that small, higher-charged cations have greater potential to polarize anions than lower-charged and larger cations (Huheey et al. Reference Huheey, Keiter and Keiter1993); (2) the Misono softness parameter as an important factor in cation polarizability (Misono et al. Reference Misono, Ochiai, Saito and Yoneda1967; Sposito Reference Sposito1994, Reference Sposito2008); (3) the assumption of clays as anions, with both charge and size being several times greater than the cations (Marchuk and Rengasamy Reference Marchuk and Rengasamy2011); and (4) any heteronuclear bond (clay–cation bond) showing a mixture of ionic and covalent character (Huheey et al. Reference Huheey, Keiter and Keiter1993), where an ionic bond signifies that the attractive interaction between one ion and another of opposite charge is strong enough to form a chemical bond, and covalent bonds involve a significant distortion of the electron configurations of the bonding atoms that results in the sharing of electrons (Pauling Reference Pauling1960). Therefore, the degree of ionicity (or covalency) of clay–cation bonds depends on the nature of cations and clays. In essence, increasing the charge and/or the size of the clay anion results in greater polarizability by the cation, at which point cations with greater charge, size, and ionic potential have greater capacity to form covalent bonds. In calculating the degree of ionic and covalent bonding, Marchuk and Rengasamy (Reference Marchuk and Rengasamy2011) combined ionic potential and Misono softness parameters by multiplication into the covalency index, and then subtracted this from 1 to obtain the ionicity index. The ionicity indices of the cations decrease in the order Na(0.89) > K(0.86) > Mg(0.73) > Ca(0.67); Ca, thus, has the greatest potential to form covalent bonds in the clay–cation system. The turbidity and mean particle sizes (d g) of Na, K, Mg, and Ca homoionic clay suspensions were found by Marchuk and Rengasamy (Reference Marchuk and Rengasamy2011) to be strongly correlated with the ionicity index. In contrast, the correlation between clay dispersive behavior with either ionic potential or the Misono softness parameter was poor. Thus, the ionicity index is a better indicator than either the ionic potential or Misono softness parameter in explaining clay dispersive behavior (Marchuk and Rengasamy Reference Marchuk and Rengasamy2011).
Sodium has traditionally been considered the major contributor to the deterioration of soil structural stability, which is reflected in the sodium adsorption ratio (SAR) and exchangeable sodium percentage (ESP) as indices in assessing and predicting soil structural decline (US Salinity Laboratory Staff 1954; Rengasamy and Olsson Reference Rengasamy and Olsson1991; Amezketa Reference Amezketa1999). Research has suggested, however, that Mg and K also affect soil structural stability (Emerson and Chi Reference Emerson and Chi1977; Levy and Van Der Watt Reference Levy and Van Der Watt1990; Keren Reference Keren1991; Zhang and Norton Reference Zhang and Norton2002; Smiles Reference Smiles2006; Arienzo et al. Reference Arienzo, Christen, Quayle and Kumar2009), which has led to the incorporation of Mg and K into new indices to replace SAR and ESP. The new indices included the cation ratio of soil stability (CROSS) (Rengasamy and Marchuk Reference Rengasamy and Marchuk2011) and the exchangeable dispersive percentage (EDP) (Bennett et al. Reference Bennett, Marchuk and Marchuk2016).
The dispersive behaviors of Na and Ca clays at various values of pH have been studied extensively (Williams and Williams Reference Williams and Williams1978; Delgado et al. Reference Delgado, Gonzalez-Caballero and Bruque1986; Chorom and Rengasamy Reference Chorom and Rengasamy1995). Chorom and Rengasamy (Reference Chorom and Rengasamy1995) studied the impacts of changing pH on dispersed clay and on the zeta potentials (ζ) of Na- and Ca-saturated pure clay minerals, including kaolinite, smectite, and illite, and they found that pH affects clay dispersion primarily by changing the net negative charge on clay particles. The critical coagulation concentration of Na- and Ca-saturated pure clay minerals is also pH dependent (Goldberg et al. Reference Goldberg, Forster and Heick1991). A strong linear relationship was found between soil pH with both the dispersed clay (as determined by turbidity) and ζ-potential when soils were treated with CROSS solutions (Marchuk et al. Reference Marchuk, Rengasamy and McNeill2013a). Therefore, the effects of K and Mg on soil stability are expected to be influenced by ζ-potential, or the net negative charge on clays. However, only limited research exists on the net negative charge behavior of K and Mg clays with different clay mineralogies at different pH values. The role of Mg is particularly contentious (US Salinity Laboratory Staff 1954; Keren Reference Keren1991; Curtin et al. Reference Curtin, Steppuhn and Selles1994b; Zhang and Norton Reference Zhang and Norton2002), and has been demonstrated to both improve and worsen the predictive capability of soil dispersion (Bennett et al. Reference Bennett, Marchuk and Marchuk2016). Smith et al. (Reference Smith, Oster and Sposito2015) reported that the flocculating ability of Mg, as compared to Ca, and the deleterious effect of K, as compared to Na, were optimizable. The authors explained this phenomenon as a soil-specific effect, but the reasoning for soil specificity was not investigated. On the basis of these differences, further investigation of the role of pH in the net negative charge of K and Mg clays is required as these factors are likely to partially explain the soil-specific effect.
The aim of the current study was to investigate the effect of different pH levels on the dispersive behavior of Mg and K homoionic clays with different mineralogies, and to compare these dynamics with the behavior of Na and Ca clays under equivalent pH conditions. The following hypotheses were tested: (1) the dispersive behavior of Na, K, Mg, and Ca homoionic clays is correlated to the ionicity indices of clay–cation bonds at equivalent pH; and (2) the degree of clay dispersion is explained by the pH, electrical conductivity (EC), ionicity, ζ-potential, and mean particle size of the clay–cation system.
Materials and Methods
Soil Used
Three soils, a Ferrosol from Toowoomba (S1), a Vertisol from the Dalby region (S2), and a Chromosol from Adelaide (S3), all in Australia, were used in this study. The < 2 μm clay fractions were acquired without any chemical treatments, using the method described by Zhu et al. (Reference Zhu, Marchuk and Bennett2016). 40 g of each soil was mixed with 200 mL of deionized water, and shaken overnight using an end-over-end shaker. The suspension was transferred into a measuring cylinder and topped up to 1 L with deionized water. The top 800 mL of clay colloidal suspension was collected after 24 h. A 53 μm sieve was used to remove visible organic matter from the colloidal suspension. Selected properties of these clays are presented in Table 1. The pH and EC were measured at 1:10 clay/deionized water ratio. The organic carbon (OC) was determined according to Walkley and Black (Reference Walkley and Black1934). The exchangeable cations were determined according to method 15A2 (Rayment and Lyons Reference Rayment and Lyons2011) and analyzed using a NexION 300 inductively coupled plasma-mass spectrometer (ICP-MS) (PerkinElmer, Inc., Shelton, Connecticut, USA). The effective cation exchange capacity (CECeff) was calculated as the sum of the exchangeable Na, K, Mg, and Ca.
Selected properties of soil clays, including soil pH, electrical conductivity (EC), organic carbon (OC), and cation exchange capacity (CEC)

Preparation of Homoionic Clays
Homoionic clays were prepared by equilibrating with a 1 M NaCl, KCl, MgCl2, or CaCl2 solution. All the chemicals used in this study were analytical reagent (AR) grade, from Chem-supply Pty Ltd, Australia. The volume of solutions and the repetition time of the treatments were adjusted according to the clay mineralogy and type of salt (Bergaya et al. Reference Bergaya, Lagaly, Vayer, Bergaya, Theng and Lagaly2006; Steudel and Emmerich Reference Steudel and Emmerich2013). Excess electrolytes were removed using a modified dialysis method described by Churchman and Weissmann (Reference Churchman and Weissmann1995) so that the EC of each homoionic clay was <0.05 dS/m. The extent to which the clay was homo-cationically saturated was investigated by measuring the exchangeable cations via ICP-MS. The clay samples prepared by this method were subjected to hydrolysis resulting in the clay being 91–97% homoionic.
pH Adjustment
Clay samples (0.25 g of clay in 25 mL of deionized water) were titrated manually to adjust the pH to 3, 4, 5, 6, 7, 8, 9, 10, and 11 for all clays, using HCl to reduce the pH, or the corresponding hydroxide solutions — i.e. NaOH for Na-clays, KOH for K-clays, Mg(OH)2 for Mg-clays, Ca(OH)2 for Ca-clays — to increase the pH (Chorom and Rengasamy Reference Chorom and Rengasamy1995). Due to the low solubility of Mg(OH)2, the highest attainable pH for Mg clays was 7 for S1 and S3 soil clays and 8 for S2 soil clays. The pH was adjusted until the stable desired values were obtained.
Clay Mineralogical Analysis Using X-ray Diffraction
To confirm the mineralogy of the three soil clays used, X-ray diffraction (XRD) analysis was performed on a Thermo Scientific ARL 9900 X-ray workstation. CuKα radiation (λ = 0.15406 nm) was generated at 40 kV and 40 mA. The scanning range was from 5 to 80°2θ at a speed of 5°2θ min–1, with step size of 0.02°2θ. Soil clay S1 was separated from a Ferrosol, where kaolinite and a crystalline form of ferric oxide were present (Fig. 1a). In addition, the XRD pattern had a high background between 5 and 20°2θ indicating the existence of amorphous material in S1, which was likely to be poorly crystalline Fe oxyhydroxides, organic matter, and/or other amorphous material. Soil clay S2, derived from a Vertisol, consisted mainly of montmorillonite and quartz (Fig. 1b). Soil clay S3, from a Chromosol, contained mostly illite with traces of kaolinite and quartz (Fig. 1c). The measured CECeff of each soil clay reflected the dominant clay mineralogy and clay content (Chorom and Rengasamy Reference Chorom and Rengasamy1995).
Comparison of XRD patterns between clays: a Kaolinite-dominated soil clay S1, b Montmorillonite-dominated soil clay S2, and c Illite-dominated soil clay S3

Measurements of Dispersed Clay Percentage, ζ-potential, and Mean Particle Size
The percentage of dispersed clay was calculated following the measurements of clay dispersion as turbidity (τ) in nephelometric turbidity units (NTU) on each clay sample, as described by Zhu et al. (Reference Zhu, Marchuk and Bennett2016), using a Hach Turbidimeter 2100N.
Three separate ζ-potential measurements were performed on each clay sample using zeta cells on a Malvern Zetasizer Nano-ZS analyzer. The ζ-potential was calculated automatically for each clay sample as a mean of 100 runs by Zetasizer Software v7.11.
The same Malvern Zetasizer Nano-ZS analyzer and software were used to measure mean particle size (d g) of clay suspensions at 25°C by dynamic light scattering spectroscopy using particle size cells. The d g was calculated after three measurements, and each measurement was averaged over 13 individual runs.
Statistical Analyses
Descriptive statistics were utilized to investigate all data. The average value of the percentage of dispersed clay, ζ-potential, and d g was plotted with standard deviation as the error bar. A one-way analysis of variance was performed to determine if the dispersed clay, ζ-potential, and d g varied significantly among the Na, K, Mg, and Ca clays at the same pH. To explore the relationships for dispersed clay against ionicity index, ζ-potential, d g, and pH, stepwise regression analyses with both forward and backward propagation were conducted. The regression equations were given at 95% confidence limits, with the coefficient of determination (R 2), adjusted R 2, predicted R 2, and Mallow C p provided to assess the variation explained, potential over parameterization, capability to predict new data, and precision of the model, respectively.
RESULTS AND DISCUSSION
Behavior of Homoionic Clays prior to pH Adjustment
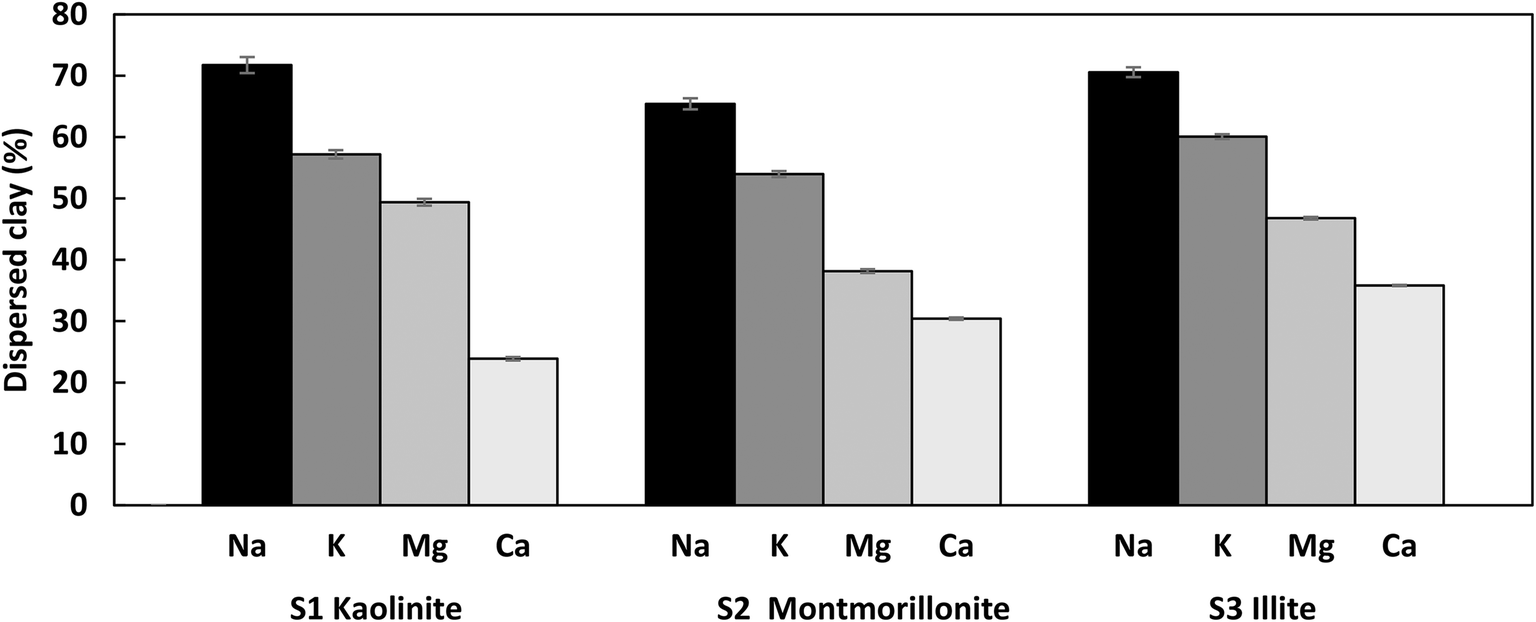
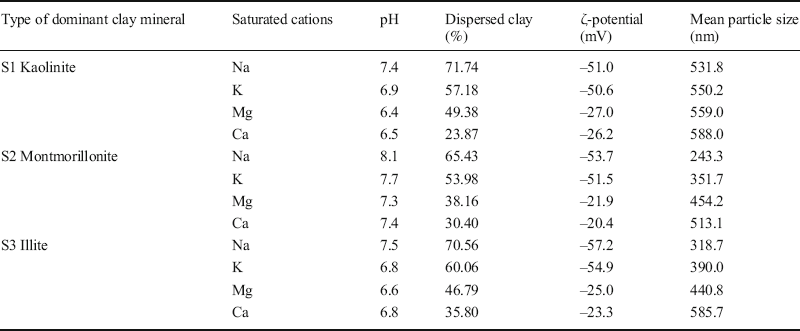
Before any pH adjustment, the dispersed clay percentages of the homoionic clays were in the order Na > K > Mg > Ca (Fig. 2), regardless of dominant mineralogy. Mg clays had 7.8–25.5% more dispersed clay than Ca clays, and K clays were 17.5–20.3% less dispersed than Na clays, depending on clay mineralogy. The results (Table 2) showed that the ζ-potential and mean particle size (d g) of homoionic clay were in the order Na < K < Mg < Ca at pH control.
Comparison between the percentages of dispersed clay of the treated clays prior to pH manipulation. Bars indicate the standard error with all comparisons among the Na, K, Mg, and Ca clays within S1, S2, and S3

Original pH, ζ-potential, dispersed clay percentage, and particle size of clays before altering pH

The Effect of Mg and K on Clay Dispersion Behavior at Various pH Levels
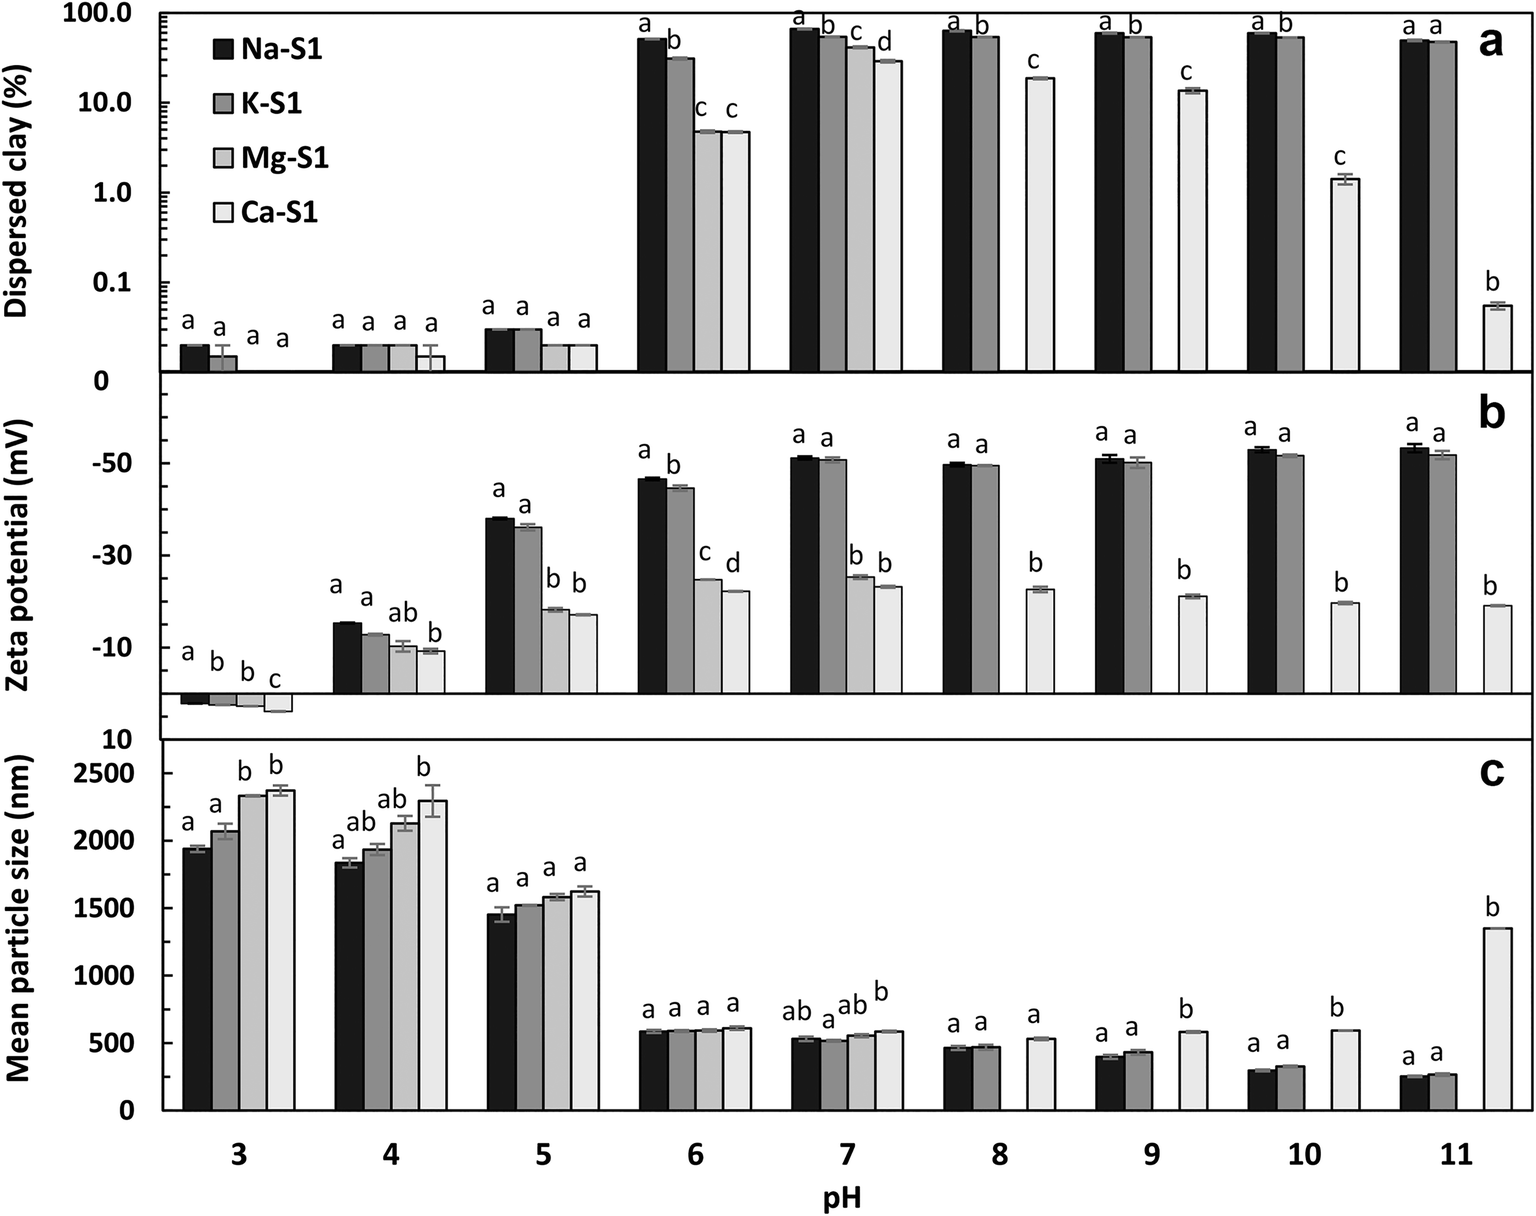
The changes in behavior of the homoionic clays noted with change of pH are discussed in terms of the dominant mineralogy in the following section. General trends in terms of the dispersive behavior of homoionic clays can be observed from Figs 3, 4, and 5:
(1) The amount of dispersed clay (%) was in the order: Ca < Mg < K < Na;
(2) The ζ-potential of homoionic clays was in the order: Ca > Mg > K > Na; and
(3) The d g of homoionic clays was in the order: Ca > Mg > K > Na.
a The dispersed clay in log scale, b ζ-potential, and c mean particle size of Na, K, Mg, and Ca homoionic kaolinite-dominant soil clay (S1) at varying pH. The bars represent the standard error and the lowercase letters represent significant differences between Na, K, Mg, and Ca clays at the same pH

a dispersed clay (log scale), b ζ-potential, and c mean particle size of Na, K, Mg, and Ca homoionic montmorillonite-dominant soil clay (S2) at various pH values. Partial flocculation was observed in Na montmorillonite clays at pH 3 and pH 4 without dispersed clay (%) data. The bars represent the standard error and the lowercase letters represent significant differences among Na, K, Mg, and, Ca clays at the same pH

a dispersed clay (log scale), b ζ-potential, and c mean particle size of Na, K, Mg, and Ca homoionic illite-dominant soil clay (S3) at various pH values. The bars represent the standard error and the lowercase letters represent significant differences among the Na, K, Mg, and Ca clays at the same pH.

These sequences occurred at the equivalent pH observation, irrespective of clay type, and showed equivalent trends to those samples without pH adjustment. The visual changes in dispersive behavior of Na, K, Mg, and Ca soil clays at pH 3 to pH 11 are presented in Appendix A as useful supporting information for confirmation of flocculation at a given pH.
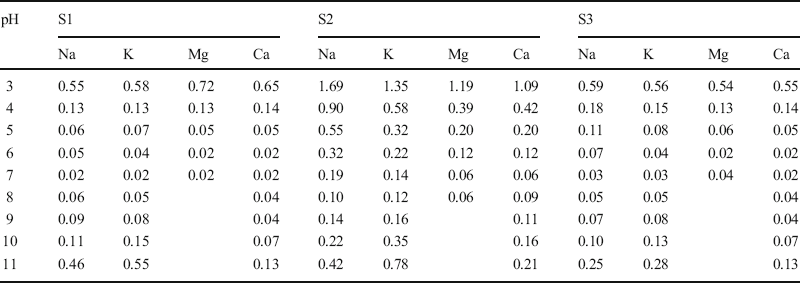
The results showed that the behavior of Mg clays was in close agreement with that of Ca clay. For the same clay mineralogy, Mg and Ca clays had the same critical pH value that distinguished flocculation and dispersion at low pH: Mg- and Ca-S1 (kaolinite dominant) clays flocculated between pH 3 and 6 (Fig. 3); Mg- and Ca-S2 (montmorillonite dominant) clays flocculated at pH 3–6 (Fig. 4); and for Mg- and Ca-S3 (illite dominant) clay, flocculation took place at pH 3 to 4 (Fig. 5). In the present study, the clay suspension system was considered as flocculated when the percentage of dispersed clay was <5 (Zhu et al. Reference Zhu, Bennett and Marchuk2019). At neutral pH, Mg clays had slightly more dispersed clay (%) than Ca clays but the difference was insignificant under similar conditions. The greatest pH values for magnesic clay reported in this study were pH 7, 8, and 7 for S1, S2, and S3, respectively, due to the low solubility of Mg(OH)2. At high pH, Ca clays tended to flocculate regardless of clay types with increasing ζ-potential and d g. The flocculation tendency of Ca clays at high pH is related to the increased electrolyte concentration (Table 3) in suspension from the addition of alkali solution and/or mineral dissolution. Furthermore, the flocculation could be related to the charge reduction due to cementation or coating by the formation of CaCO3 in Ca-clay suspensions with exposure to atmospheric CO2 (Chorom and Rengasamy Reference Chorom and Rengasamy1995). When Mg cations were initially present in soil/soil water, an increase in pH upon alkalization could result in the precipitation of Mg(OH)2, beginning at approximately pH 9.5, becoming significant above 10.5, and essentially completed at pH = 11–11.5 (Semerjian and Ayoub Reference Semerjian and Ayoub2003). The resulting Mg(OH)2 was a gelatinous precipitate with a large adsorptive surface area and a positive superficial charge, which was found to serve as an efficient coagulant and flocculation aid (Semerjian and Ayoub Reference Semerjian and Ayoub2003). Therefore, under high pH conditions, one assumes that Mg should behave in a similar fashion to Ca, and tend to flocculate clay suspensions.
The measured EC (dS/m) of soil clays at the corresponding pH

Results from the present study further showed that Mg clays were in close agreement with Ca clay behavior, albeit with a net negative charge consistently more negative than Ca (greater electrophoretic mobility). The electrophoretic mobility of dispersed clay, which depends on ζ-potential, indicated the changes in net charge. The Ca system was conducive to flocculation conditions with ζ-potential >–30 mV (Molina Reference Molina2014). Results from the present study demonstrated that, while Mg-clay < Ca-clay in terms of ζ-potential, conditions for an unstable clay dispersion (prone to flocculation) were always obtained with ζ-potential of <–30 mV in the Mg system. This clearly suggests that the role of Mg is similar to the role of Ca, irrespective of clay type, and that Mg has a flocculative effect rather than a dispersive effect.
K-S1 and K-S3 clays flocculated completely within the same pH ranges as Na-saturated clay. K-S2 clay flocculated at pH ≤ 4, while partial flocculation was observed in the Na system over the same pH range. The ζ-potential of K clays was similar to but slightly greater than Na clays at each pH reading, regardless of clay mineralogy, which was consistent with less dispersion in K clays. Where the Na-clay system had ζ-potential <–30 mV (stable clay dispersion), the K-clay also had ζ-potential <–30 mV, indicating that the K clay behavior was largely in line with Na clay. Additionally, the d g of K clays had a similar but slightly larger mean particle size than Na clays under equivalent conditions. The general results confirmed that K had similar dynamics with pH to those of Na, but induced less dispersion, which is consistent with the results of Marchuk and Rengasamy (Reference Marchuk and Rengasamy2011).
Monovalent clays behave differently from divalent clays. At pH 3, each homoinic S1 and S3 clay reached full flocculation. The volume of Na floccules was clearly larger than that of Ca, however. Na-S2 clay flocculated partially, while Ca-S2 reached full flocculation at pH 3. This observation is in line with findings from Greene et al. (Reference Greene, Posner and Quirk1973) that only Ca montmorillonite could form a quasi-crystal with a fixed distance of 10 Å between the particles, while Na montmorillonite floccules cannot condense into a primary minimum, resulting in a large volume of floccules. As noted at high pH, Ca clays tended to flocculate, while monovalent clays maintained a high degree of dispersion, e.g. K-S3 52.1%, 49.6%, and 45.7% at pH 9, 10, and 11. The monovalent clays were highly dispersive because of the strong negative charge, as the addition of OH– in solution led to more OH– ions being adsorbed on clay surfaces (Chorom and Rengasamy Reference Chorom and Rengasamy1995; Ibanez et al. Reference Ibanez, Wijdeveld and Chassagne2014; Parameswaran and Sivapullaiah Reference Parameswaran and Sivapullaiah2017). In support of this, a comparable ζ-potential was found in monovalent clays at neutral pH, in spite of the increased EC due to the addition of electrolyte at high pH (Table 3). Ibanez et al. (Reference Ibanez, Wijdeveld and Chassagne2014) found that when K cations were adsorbed on a kaolinite surface, its surface charge would be insensitive to the addition of extra K ions in suspension, but the addition of extra K ions helped to reduce the size of the diffuse double layer around the particles. Moreover, when pH ≥ 9, the d g of monovalent saturated soil clays decreased. As pH increased, the bonding between organic matter and clay particles decayed, resulting in decreased d g (Marchuk et al. Reference Marchuk, Rengasamy and McNeill2013a). In summary, the effects of Mg on clay dispersion will be similar but have less flocculative effect than those of Ca, while the effects of K will be close to those of Na, but inducing less dispersion, under similar pH conditions.
Application of the Ionicity Concept in Explaining Specific Clay Dispersive Behavior
In dilute electrolytes, the separation distance of clay particles often follows DLVO theoretical prediction (Hartley et al. Reference Hartley, Larson and Scales1997; Quirk and Marcelja Reference Quirk and Marcelja1997). The DLVO theory has its limitations, however, whereby it predicts that the double layer interactions depend on the valence of the electrolyte ions, regardless of their differences in size and ability to be polarized, etc. (Pashley and Quirk Reference Pashley and Quirk1984; Boström et al. Reference Boström, Williams and Ninham2001; Karraker and Radke Reference Karraker and Radke2002; Manciu and Ruckenstein Reference Manciu and Ruckenstein2003; Liu et al. Reference Liu, Li, Li, Xie, Ni and Wu2014; Hu et al. Reference Hu, Liu, Xu, Wang, Liu, Li and Zhao2018b). The different behavior of Mg and Ca clays, and of K and Na clays, apparently cannot be fully explained by DLVO theory. Strong correlations (0.86 < R 2 < 0.99) were observed between the ionicity indices of the four cations and the percentage of dispersed clay at the control (without pH adjustment), pH 6, pH 7, and pH 8 (Table 4). Hence, the difference between Mg and Ca clays, and between K and Na clays can be explained by the differences in their degrees of ionicity of clay–cation bonds. The results further confirmed that clay–cation bonds are a mixture of covalent and ionic bonds, where the net ionicity of a clay–cation bond determined how water reacted with clays and the degree of hydration (Marchuk and Rengasamy Reference Marchuk and Rengasamy2011; Rengasamy et al. Reference Rengasamy, Tavakkoli and McDonald2016). Though this work was conducted in clay suspensions (i.e. not directly equivalent to an aggregated soil system), the mechanism of increasing covalency of clay–cation bonds will lead to enhanced potential for aggregation of clay particles, and/or retention of aggregation under some adverse conditions. This was reflected by the d g of homoionic clays at each pH value being in the sequence of Na < K < Mg < Ca. Therefore, the ionicity approach demonstrates that soil stability under dynamic conditions will be useful in informing predictive models.
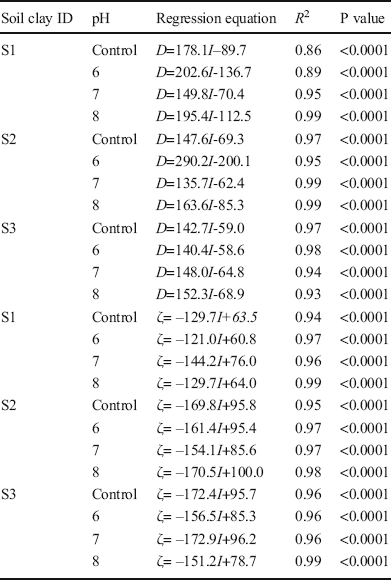
Relationship between the ionicity index (I) and zeta potential (ζ) as well as the dispersed clay percentage (D) of homoionic clays at pH control (without pH adjustment), pH 6, pH 7, and pH 8

Even though the ionicity index had a significant correlation with clay dispersive behavior, the gradient of the relationship between ionicity and clay dispersion parameters varied substantially (Table 4). The variability in coefficients suggested potential for other factors, or a specific effect. Firstly, while the clay suspensions were considered homoionic, removing all other ions from the system was impossible. This, and the fact that homoionic systems would not be expected in a natural soil environment, highlights the merit of developing an ionicity index approximation for mixed-ion systems. Secondly, the deviation in gradient may be partly related to the existence of iron oxide and organic matter within the colloidal system (Goldberg and Glaubig Reference Goldberg and Glaubig1987; Goldberg et al. Reference Goldberg, Kapoor and Rhoades1990; Marchuk et al. Reference Marchuk, Rengasamy and McNeill2013a), and the fact that clay structure varies in terms of mineralogy (Brigatti et al. Reference Brigatti, Galan and Theng2006), with natural soils not having a consistent mineralogy, but rather a possible dominant mineral and mixed mineral suite. As the mineral suite changes, the charge density and its distribution will also vary, even within the same dominant mineralogy (Lagaly Reference Lagaly1981; Saka and Güler Reference Saka and Güler2006). The suggestion is, therefore, that organic matter, sesquioxides, and clay source are also important factors explaining specific clay dispersive behavior. On such a basis, two key investigations are required: (1) the effect of variations within clays to establish the application of the ionicity concept; and (2) an ionicity index approximation for a mixed ionic system in order to determine the specific effect. Despite these variations, results from the current study confirm the first hypothesis that at equivalent pH the dispersive behavior of Na, K, Mg, and Ca homoionic clays is correlated with the ionicity indices of clay–cation bonds.
Predicting Dispersive Behavior of Clay Suspensions
The role of ionicity of clay–cation bonds in explaining dispersed clay (%) and ζ-potential for homoionic clay suspensions was investigated with the results presented in Table 4. No significant correlation was found for the data when treated as a single data set, or by soil, meaning that both the mineralogy and the pH affected the relationship between dispersed clay and the ionicity index. Dispersed clay was highly correlated with ionicity index at a given pH for a given clay, explaining >86% of variation, and was highly significant (p < 0.0001) in all instances. Strong relationships (R 2 >0.94) were also found between ζ-potential and ionicity index for a given pH and clay mineralogy.
In order to explore generalized relationships for dispersed clay (%) against soil characteristics, step-wise regression was undertaken using the pH (explanatory variable) and EC (varied by necessity of treatment), as well as the ionicity index, given the results in Table 4, resulting in Eq. 1. In testing the hypothesis that dispersed clay is related to the ionicity index, the d g was added as a factor, with the net negative charge (ζ-potential) also added, resulting in Eq. 2.
Dispersed clay (%), D, was explained by the pH, EC (C), and the ionicity index (I) as follows:

while net negative charge (ζ), mean particle size (d g), and EC were shown to explain dispersed clay (%) as:

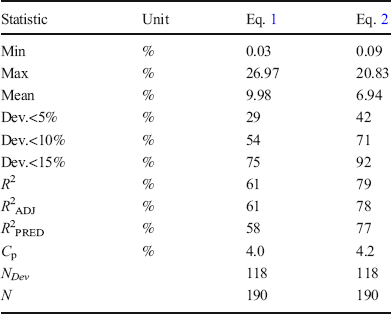
The statistics for Eqs 1 and 2 are given in Table 5. Both equations explain the majority of variation in dispersed clay as a function of their factors. However, Eq. 2 is clearly superior to Eq. 1. That said, the efficacy of Eq. 2 can only be considered as reasonable. While neither model is over parameterized (R 2 ≈ R 2ADJ), with both models having reasonable predictive capacity (R 2PRED) and precision (C p ≈ the number of model parameters), substantial deviation of predicted results from observed results occurred (Table 5). Equation 2 resulted in 92% of data being within ±15% dispersed clay, as compared to the true value, and 42% of data varying by less than ±5% dispersed clay; for Eq. 1, these values were 75% and 29% of data being within the ±15% and ±5%, respectively (Table 5). This indicates that neither equation provides exceptional predictive capacity, but that Eq. 2 is reasonable. Both equations also provided low confidence in predicting suspension conditions where the dispersed clay percentage was <12%. Below this concentration, the suspension system was unstable (i.e. clay flocs formed rapidly), indicating that the system was actually better explained by a two-phase model (flocculated and unstable suspension; dispersed and stable suspension), which should not be considered surprising. Separating the data into these phases did not improve predictive capacity, but <12% dispersed clay was clearly delineated as the boundary condition in terms of all regression models explored, with the caveat that this applies only for the data observed in this work. One is cautioned not to use these equations for aggregated soil systems, as these results are based on clay suspensions; the intention of the results is to facilitate mechanistic investigation.

Dev. Refers to deviation of the predicted results from the true result observed; R 2 explains the variation described by the model; R 2ADJ is the adjusted R 2; R 2PRED is the predicted R 2; C p is Mallow’s measure of precision; N Dev is the number of observation pertaining to the deviation data; and N is the total number of observations used in the construction and subsequent statistical assessment of model efficacy.
The present study demonstrates that the degree of clay dispersion is explained by the pH, EC, ionicity, ζ-potential, and mean particle size of the clay–cation system. Chorom and Rengasamy (Reference Chorom and Rengasamy1995) demonstrated that solution pH and EC had distinct effects on the level of stability within a clay suspension, while Marchuk and Rengasamy (Reference Marchuk and Rengasamy2011) showed that clay suspension dispersion was related to ionicity. Hence, the existence of a generalized relationship would be expected between pH, EC, and ionicity in explaining clay suspension dispersion, as found in Eq. 1. The subsequent incorporation of net negative charge and particle size resulted in pH being dropped from the model and substantial improvement in the predictability of new results. The removal of pH with the introduction of net negative charge is explained by the fact that net negative charge varies as a result of change in pH, as described by Chorom and Rengasamy (Reference Chorom and Rengasamy1995), meaning that net negative charge inclusion makes the pH term redundant. Interestingly, note that EC is not dropped, despite the relationship to net negative charge; when the EC increased, the double layer was compressed, resulting in a smaller net negative charge (Chorom and Rengasamy Reference Chorom and Rengasamy1995; Brown et al. Reference Brown, Goel and Abbas2016). This is probably because the more dominant mechanism of EC effect is via osmotic potential, as described by Quirk (Reference Quirk2001). Hence, the osmotic effect of EC on clay particle dispersion appears to be more important than the effect of EC on net negative charge.
Mineralogical Observations
For dispersed clay suspensions, the ζ-potential at each pH reading changed in response to clay mineralogy and was integral in explaining the actual dispersive extent. Distinct differences between kaolinite (S1) and montmorillonite (S2) clays were observed at low pH, due to different clay structures and charge changing when interacting with acid solutions. The alumina octahedral sheet of kaolinite was positively charged at pH < 6 (Gupta and Miller Reference Gupta and Miller2010), while the silica tetrahedral sheet was always negatively charged; its magnitude was pH-dependent, however, possibly due to broken bonds on the basal planes and/or hydrolysis of siloxane bonds (Zhou and Gunter Reference Zhou and Gunter1992). The surface charge of the kaolinite crystal edge was positive at pH < 4.5. Unlike kaolinite, montmorillonite possesses a large permanent negative charge and a small amount of variable charge (Tombácz and Szekeres Reference Tombácz and Szekeres2004; Weil and Brady Reference Weil and Brady2016). Thus, at low pH, the positively charged surface of the aluminum sheet of kaolinite and its highly exposed edge surface area with positive charge yielded less net negative charge than that of montmorillonite. This was supported in this work whereby the ζ-potential of each homoionic montmorillonite was more negative than kaolinite at pH ≤ 5.
Before any pH adjustment, each homoionic S1 clay had the largest d g as compared to S2 and S3 for the same dominant cation (Table 4). This is related to the existence of amorphous material in S1 as indicated by its XRD pattern. Clay particles were attached firmly and consequently had a large mean particle size (Tisdall and Oades Reference Tisdall and Oades1982).
Homoionic illite (S3) clays were more dispersive than kaolinite (S1) and montmorillonite (S2) clays, with each treated illite clay having a greater percentage of dispersed clay than the corresponding montmorillonite and kaolinite clays at equivalent treatment. In addition, the treated illite clay showed notable dispersion over a wider pH range than those of montmorillonite and kaolinite. For example, Ca-illite had notable dispersion from pH 5 to pH 10, whereas Ca-kaolinite and Ca-montmorillonite showed visible dispersion only within the range of pH 7 to pH 9. The results in this study are in line with reports that illitic red-brown earths are susceptible to dispersion even at SAR < 3 and under weak mechanical forces (Rengasamy Reference Rengasamy1983; Rengasamy et al. Reference Rengasamy, Greene, Ford and Mehanni1984). Oster et al. (Reference Oster, Shainberg and Wood1980) and Greene et al. (Reference Greene, Posner, Quirk, Emerson, Bond and Dexter1978) suggested that the high dispersivity of illite was due to "bad" contact between the terraced planar surfaces of illite and its edges. Results from the present study also showed that each homoionic illite clay had lower comparative ζ-potential at equivalent conditions than kaolinite and montmorillonite. These results lend further weight to the requirement of incorporating a clay suite within predictive models, which will require some quantitative measure of mineralogy, or a probabilistic modeling approach.
Dispersed Suspension vs Aggregated System
Both the degree of ionicity of clay–cation bonds and the net negative charge have clear effects on the dynamics of clay particle dispersion. Note, however, that in the present study, the dynamics of flocculation conditions of clay suspensions were investigated under various solutions. Clearly, in soil structural science, clay flocculation is not equivalent to soil aggregation (Bradfield Reference Bradfield1936; Quirk Reference Quirk2001; Dang et al. Reference Dang, Bennett, Marchuk, Biggs and Raine2018). Clay suspensions were used in the current investigation to infer relative differences in fundamental particle dynamics as driven by solute conditions. These mechanisms will be valid within aggregated systems, but the predictive model derived in this work is not suitable for application in an aggregated system. Still, using this work in such an approach will be important in the prediction of soil-specific dispersive thresholds.
Conclusions
The present study investigated the effect of pH on the dispersive behavior of Mg and K homoionic clays of three contrasting dominant mineralogies, and compared the dispersive behavior of Ca and Na clays under equivalent pH conditions. The effect of Mg on clay dispersion was similar, but had less flocculative effect than that of Ca, while the effect of K was also similar but caused less dispersion than Na, at equivalent pH. The dispersive behaviors of Na, K, Mg, and Ca homoionic clays was well correlated to the ionicity indices of clay–cation bonds, with the degree of clay dispersion explained by the pH, EC, ionicity, ζ-potential, and mean particle size of the clay–cation system. pH as a predictive factor was dropped with the introduction of net negative charge on the basis that pH dynamics are captured within the net negative charge dynamics. The large variation of the gradient of the relationship between ionicity and clay dispersion parameters suggested other factors need to be considered, with the soil-clay-mineral suite the most likely explanatory variable. Further research is required into soil-mineral suites in terms of their control of the extent of dispersion.
ACKNOWLEDGMENTS
This work was supported by an Australian Postgraduate Award.
Funding
Funding sources are as stated in the Acknowledgments.
Compliance with Ethical Statements
Conflict of Interest
The authors declare that they have no conflict of interest.
APPENDIX A
Visual changes in dispersive behavior of Na, K, Mg, and Ca kaolinite soil clays at pH 3 to pH 11

Visual changes in dispersive behavior of Na, K, Mg, and Ca montmorillonite soil clays at pH 3 to pH 11

Visual changes in dispersive behavior of Na, K, Mg, and Ca illite soil clays at pH 3 to pH 11