I. Introduction
Since the 1990s, economists have applied hedonic estimation methods to study factors driving wine prices. Today, the hedonic wine literature has grown into a substantial and diversified body of work (e.g., Orrego, Defrancesco, and Gennari, Reference Orrego, Defrancesco and Gennari2012; Oczkowski and Doucouliagos, Reference Oczkowski and Doucouliagos2015, Ashenfelter, Reference Ashenfelter2017; Niklas, Reference Niklas2017). For a review, see Storchmann (Reference Storchmann2012).
Hedonic estimation is a two-step methodology (see, e.g., Boyle and Kiel, Reference Boyle and Kiel2001). Assuming a competitive market of heterogeneous goods (with various attributes) and heterogeneous buyers (with various revenue levels and preferences), the first step computes the implicit price of each attribute. The second step regresses these implicit prices on buyers’ characteristics to estimate buyers’ willingness to pay (Zabel and Kiel, Reference Zabel and Kiel2000; Brasington and Hite, Reference Brasington and Hite2005).
While the application of hedonic estimations to the wine market has been criticized (Unwin, Reference Unwin1999; Thrane, Reference Thrane2004), the findings are deemed relevant in wine marketing (pricing strategy, quality differentiation) and wine finance (hedonic indices for computing returns on wine investment).
Estimates of implicit prices (or price elasticities) are heterogeneous across the literature, and not always directly comparable.Footnote 1 In most cases, implicit prices (or price elasticities) are computed over very short timeframes. However, short-time hedonic estimations only convey a snapshot. Long-term studies may pick up additional trend-driven confounding time effects (e.g., Wood and Anderson, Reference Wood and Anderson2006; Bicknell, Friesen, and MacDonald, Reference Bicknell, Friesen and MacDonald2005; Cardebat et al., Reference Cardebat, Faye, Le Fur and Storchmann2017). While some papers deal with the limitations of hedonic estimation in the wine market (e.g., Thrane, Reference Thrane2004), no papers have examined the stability of hedonic coefficients over time.
The objective of this article is to test the stability of the main hedonic coefficients over time and to explore possible sources of variability. We examine expert scores, age, liquidity, quantity of bottles sold, and packaging (we further present some findings related to winery and vintages in an Online Appendix 1, Figures A1.1, A1.2).
For each attribute, we will test three broad hypotheses: (1) hedonic coefficients are stable over time (H0), (2) coefficients are subject to structural changes (H1a), and (3) coefficients are subject to cyclical changes (H1b).
The first hypothesis (H0) implies that consumers exhibit constant preference structures or that market segments with differentiated preferences apply constant weights to wine attributes.
The implicit prices (p i) of each attribute i are the mathematical expectation of the p ij distribution computed by the multivariate regression (for j buyers). Without distinguishing different buyers,Footnote 2 a change in implicit prices may describe either a change in buyers’ preference structure, that is, a simple translation of the p ij distribution, or a change in the weighting of market segments with differentiated but constant preferences, that is, a change in mode frequencies of a multimodal distribution of p ij. Consequently, a change in implicit prices describes a change in the market preference structure as well as in the buyers’ preference structure.
The second hypothesis (H1), that is, hedonic coefficients change over time, is split into two (joint) hypotheses.
Under H1a, an attribute is subject to long-term or structural changes in market preferences. This implies that the price sensitivity with respect to the attribute has changed. For instance, buyers may become increasingly sensitive to the rating of a particular wine expert.
Under H1b, an attribute is subject to short-run or cyclical changes in market preferences. This may occur when price movements (or price cycles) generate changes in the evaluation of attributes. For instance, are we as mindful of expert opinions in a boom period as we are in a bust period? Consequently, valuation of attributes may differ between boom and bust periods. If the last two hypotheses (H1a, H1b) are not rejected, estimated hedonic coefficients are either just one-off short-term information or a long-term mean abstraction.
In order to test the stability of hedonic coefficients over time, we generate in a first step these coefficients. Using regression analysis, we estimate one coefficient for each month. For this purpose, we draw on the hedonic wine literature review to select the most frequently used attributes and functional forms. The estimated coefficients constitute a new time series, our dependent variables in the second step. We then regress these estimated coefficients on their own lagged value and a wine price index using a multivariate autoregressive model (MAR).
Studying the elasticity movements over time contributes to the existing literature in three ways. First, we examine the evolution of buyer sensitivities to fine wine attributes over time. Second, we investigate the assumption of a long-term evolution of preference structure of the market demand and a short-term evolution of these preferences, derived from cyclical behavioral biases. Third, this article is set out to control for short- and long-term biases in the estimation of hedonic coefficients.
The remainder of this article is organized as follows. Section II presents a review of the hedonic literature and defines the specifications of the standard model used in our analysis. Section III presents the data and some descriptive statistics. Section IV describes the methodology, the results, and conducts some robustness checks. The final section comments on the results and concludes.
II. Literature Review
The aim of this literature review is to select a hedonic estimation model that is both consistent with the literature and theoretical and methodological rigorous. To this end, we explore each component of the estimation model in turn, that is, price variable, sample, functional form, and attributes.
As described in Equation (1), hedonic price functions relate wine prices to their attributes:

where P i is the price of wine i, A ij is the j th attribute of wine i, and f is the functional form selected. The right-hand side of the equation presents a particular linear specification of f; ɛi is the residual.
A. Wine Price Vector
In the literature, we encounter different definitions and/or different sources of the wine price vector, therefore, P i may refer to:
(i) Suggested prices, as published in prominent guides (e.g., Oczkowski, Reference Oczkowski1994; Landon and Smith, Reference Landon and Smith1998; Roma, Di Martino, and Perrone, Reference Roma, Di Martino and Perrone2013);
(ii) “Primeur” prices obtained from broker houses (e.g., Ali and Nauges, Reference Ali and Nauges2007);
(iii) Retail prices reported in consumer magazines or websites (e.g., Gergaud Reference Gergaud1998; Lecocq and Visser, Reference Lecocq and Visser2006; Haeger and Storchmann, Reference Haeger and Storchmann2006), obtained through direct survey (e.g., Benfratello, Piacenza, and Sacchettos, Reference Benfratello, Piacenza and Sacchettos2009), or gathered by private data providers such as Nielsen (e.g., Steiner, Reference Steiner2004);
(iv) Auction prices (e.g., Di Vittorio and Ginsburgh, Reference Di Vittorio and Ginsburgh1996; Jones and Storchmann, Reference Jones and Storchmann2001; Ashenfelter, Reference Ashenfelter2010; Cardebat et al., Reference Cardebat, Faye, Le Fur and Storchmann2017); and
(v) Restaurant prices (e.g., Durham, Pardoe, and Vega-H, Reference Durham, Pardoe and Vega-H2004).
The choice of the source for prices primarily depends on the availability of data and volume. However, the data choice affects the resulting coefficients and the interpretation of results.
In our analysis, we deem wine auction prices the most appropriate measure of market prices. All other price data listed earlier do not reflect real and competitive market conditions: suggested prices (i) do not reflect real market scarcities; restaurant and broker prices (ii) and (v) are derived under restricted competition conditions; and retail prices (iii) are somewhat erratic over time due to promotional periods (e.g., Ortuzar-Gana and Alfranca-Burriel, Reference Ortuzar-Gana and Alfranca-Burriel2010).
B. Wine Sample
The choice of a wine sample to estimate the hedonic function is not trivial. As Thrane (Reference Thrane2004, p. 2) discussed, “data should be heterogeneous enough to allow for generalizations and, at the same time, be homogeneous enough to make relevant comparisons.” From an econometric standpoint, the use of identification dummies and interaction variables allows the researcher to balance homogeneity and heterogeneity. In order to limit the number of variables in our model, we opt for a very homogeneous sample of Bordeaux red wines: the Bordeaux Legends 50 sample used by Liv-ex.
C. Functional Form
In hedonic estimation, the functional form (f) is critical as it reflects the underlying assumptions about the relationship between the value of an attribute and its implicit price. A mis-specified functional form may produce incorrect coefficient estimates. Most authors use log-linear or log-log functional forms; alternative specifications, such as Box–Cox models, may provide more accurate estimates, but are not easily comparable with other methods. Therefore, for comparability reasons, most studies employ log-linear specifications.
In our analysis, we opt for log-log models for two reasons. First, log-log specifications limit nonlinear relationships between price and attributes and attenuate the impact of outliers. Second, a more flexible functional form would require estimating specific parameters, which may be unstable to subsample frequency changes. In this case, the differences between parameters, such as Box–Cox parameters, across subsample would prevent the comparison of coefficients from one period to another.
D. Wine Price-Relevant Attributes
The hedonic wine literature covers a wide array of attributes A ij.
Market prices are jointly determined by a buyer's willingness to pay and a seller's willingness to supply, both dependent on the perceived quality of the wine.
On the supply side, we distinguish time-variant and time-invariant variables. Di Vittorio and Ginsburgh (Reference Di Vittorio and Ginsburgh1996), Wood and Anderson (Reference Wood and Anderson2006), Dubois and Nauges (Reference Dubois and Nauges2010), and Chevet, Lecocq, and Visser (Reference Chevet, Lecocq and Visser2011) analyzed the relationship between wine quality and weather. However, meteorological variables may also be proxied by a vintage dummy variable. Similarly, winery-specific dummy variables (fixed effects) cover time invariant factors such as soil composition, soil density, vine exposure, altitude, vinicultural techniques, and the type of company of the winery (e.g., cooperative, private company). Considering the difficulties in obtaining technical and detailed winery, the vast majority of analyses employs firm-fixed effects.Footnote 3
Many authors include various wine age-related variables (linear, squared, cubed, logarithms) that depict changing quality and/or scarcity (e.g., Ashenfelter, Reference Ashenfelter2010; Schamel, Reference Schamel2009; Ling and Lockshin, Reference Ling and Lockshin2003; Delmastro, Reference Delmastro2005). If we consider that the willingness to pay for a bottle of wine depends on its drinkability, the relationship between age and price becomes nonlinear. First, some wines need to be kept for many years before drinking; second, all wines reach an “apogee” time, beyond which the quality of the wine may decrease. Instead of a single “age” variable, some authors consider a “cellaring potential” variable, defined as the difference between apogee and year of marketing (Oczkowski, Reference Oczkowski1994; Roma, Di Martino, and Perrone, Reference Roma, Di Martino and Perrone2013). We find more robust regression results when considering time to apogee and time to be drinkable separately.
On the willingness to pay, the selection of attributes raises questions as buyers' knowledge evolves. Many authors show that buyers deem chemical and sensory wine characteristics and winery characteristics irrelevant (Lecocq and Visser, Reference Lecocq and Visser2006; Benfratello, Piacenza, and Sacchettos, Reference Benfratello, Piacenza and Sacchettos2009). Rather they are guided by expert ratings. Over time, however, the level of knowledge of buyers may increase. Roma, Di Martino, and Perrone (Reference Roma, Di Martino and Perrone2013) suggest that the relevance of objective variables on buyers’ willingness to pay increases over time. Schamel and Anderson (Reference Schamel and Anderson2003) and Schamel (Reference Schamel2009) stress the increasing impact of collective appellation reputation and individual winery reputation.
Since the 1980s, investors have been active in collectible markets—in particular, the wine market (e.g., Burton and Jacobsen, Reference Burton and Jacobsen1999). A growing literature has explored investors’ decisions (see, for instance, Masset and Henderson, Reference Masset and Henderson2010; Fogarty, Reference Fogarty2010; Storchmann, Reference Storchmann2012; Masset et al., Reference Masset, Weisskopf, Faye and Le Fur2016). Masset et al. (Reference Masset, Weisskopf, Faye and Le Fur2016) introduce specific liquidity variables. Since a low degree of liquidity increases risk exposition, investors prefer more liquid markets. Liquidity of a wine (of a given vintage) is measured either by its exchange frequency on the market or by the ratio of this frequency to the output of the winery (Faye, Le Fur, and Prat, Reference Faye, Le Fur and Prat2015).
In addition to various drivers of wine quality, we also consider lot size, that is, the number of bottles and format, that is, the size of the bottles (e.g., regular bottles, magnum, double magnum) (Di Vittorio and Ginsburgh, Reference Di Vittorio and Ginsburgh1996; Cardebat et al., Reference Cardebat, Faye, Le Fur and Storchmann2017; Masset et al., Reference Masset, Weisskopf, Faye and Le Fur2016). Several studies also find an impact a positive price effect of original wooden cases (OWC). OWC are not only valued collectibles by themselves, they may also serve as an anti-counterfeit indicator (Masset et al., Reference Masset, Weisskopf, Faye and Le Fur2016).
For comparability reasons, we consider auction prices of relatively homogeneous wines (belonging to the Bordeaux Legend sample of Liv-ex) and employ a log-log specification. Finally, attribute selections (see Section III) are in line with the literature.
III. Data
Our sample consists of a selection of 50 Bordeaux wines from exceptional vintages, that are included in the Liv-ex Bordeaux Legends 50 Index.Footnote 4 For these wines, we draw transaction-level information, such as price, from a website that reports worldwide wine auction data (wineprice.com). Prices recorded in the database are realized prices, that is, the sum of the hammer price and the buyer's premium (specific to each auction house), net of sales tax, and value added tax (VAT). Overall, our sample comprises 43,114 transactions.
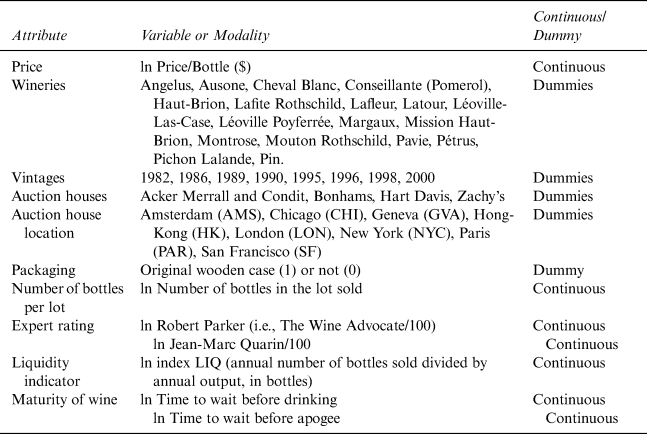
As discussed in Section II, we select a sample of commonly studied attributes (Table 1). Note, we consider two expert rating schemes to examine possible differences between them (both on a scale from 0 to 100).Footnote 5
Variables Implemented in Hedonic Functions

Using the transaction sample described earlier, we generate monthly subsamples of transactions and run the hedonic regression as outlined previously, considering a log-log functional form in which all continuous variables are expressed in log. In this configuration, the estimated coefficients of continuous variables are price elasticities. After eliminating low-transaction months (usually July and August of each year), we retain 103 subsamples and, therefore, run 103 regressions.
In each subsample, we define the same hedonic function with all variables as described in Equation (2) and estimate the relevant coefficients using the same method (ordinary least squares (OLS) with White correction). We thus generate a hedonic coefficient time series that is consistent across periods. We will then analyze the resulting time series of hedonic coefficients in the following step.
We specify the following log-log model

where Pi is the price per bottle of wine i; Cij is the jth continuous attribute of wine i; Dij is the jth dummy attribute of wine i; αj is the price elasticity of attribute Cj; and βj is the coefficient associated to the dummy variable Dj.
In the rest of this section, we present various tests and robustness checks conducted to assess the reliability of our hedonic estimates.
First, we note that changes in the composition of each monthly subsample in regard to wine vintage, auction place, and/or auction house may affect the estimated coefficient values. We further note that, during the observed period, several speculative events may have disrupted the hedonic coefficients’ series (Lafite 2000, Hong Kong prime).Footnote 6 To ensure the robustness of our results, we thus generate alternative panels, using various compositions and frequencies.Footnote 7 These panels are described in Table 2.
Presentation of the Different Panels

However, potential multicollinearity issues may result in overestimated hedonic coefficients and high variance. Ordinary solutions to the multicollinearity issue would compromise the time series’ consistency across periods.Footnote 8 As a second-best alternative, we control for the stability of the multicollinearity structure over time. To that effect, we verify that the tolerance values are stationary, and that their ranking is stable over time.Footnote 9 Using an Augmented Dickey–Fuller Stationarity (ADF) test and two rank tests (Spearman and Kendall) on each tolerance series (per variable), we confirm that the multicollinearity level and structure are stable over time (see Online Appendix 2: Figure A2.1 and Table A2.1).
We further run a MAR to test the dependence of the coefficients across periods and with the Bordeaux Legends 50 Index time series, which, consistent with our hypotheses, is considered as a continuous variable (see Figure 1).Footnote 10
Bordeaux Legends 50 Index (Liv-ex)

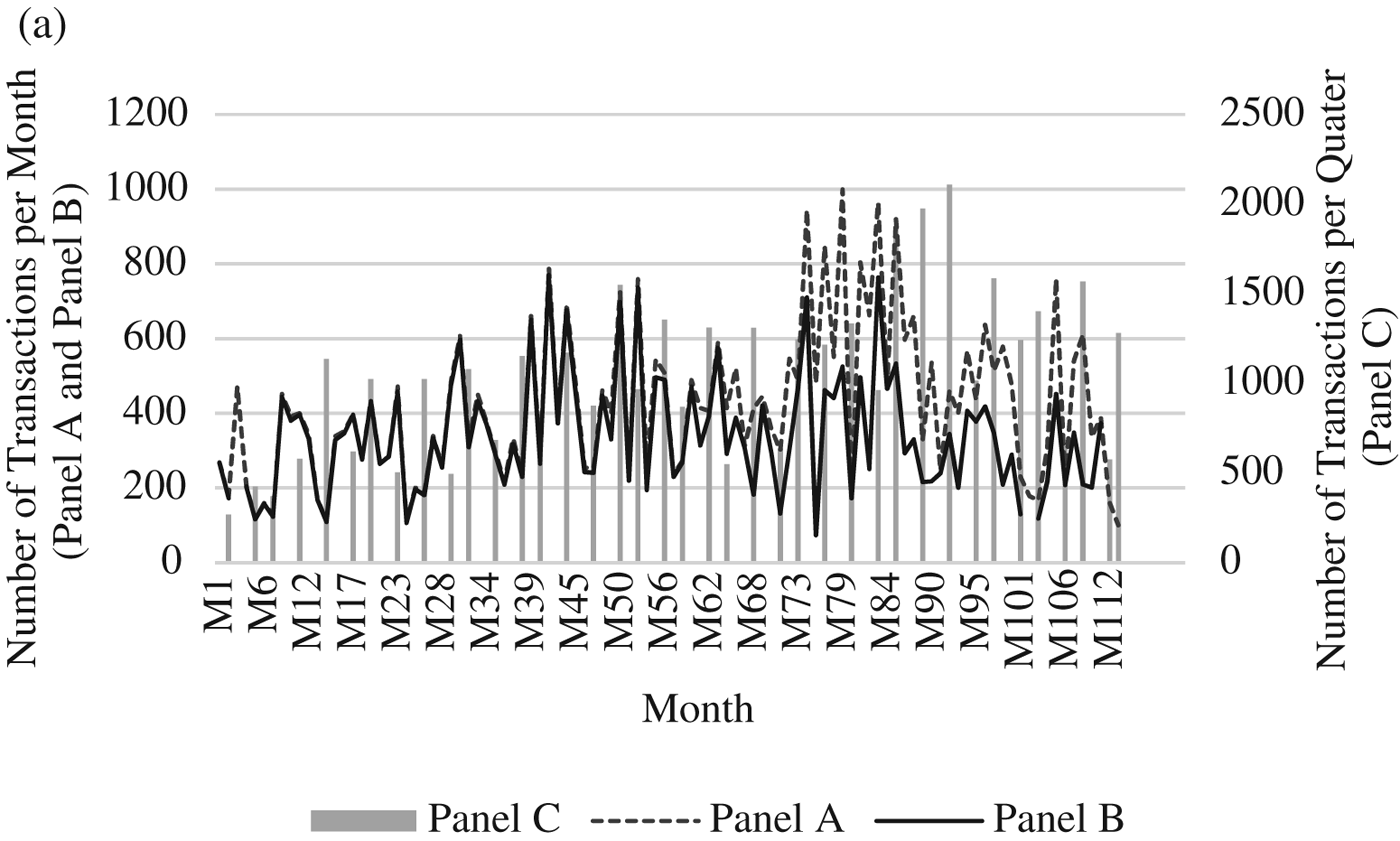
Figure 2a reports the number of transactions per period, for each of the three panels. We observe that, in all cases, the number of transactions is sufficient to run a regression.
Number of Transactions Per Panel

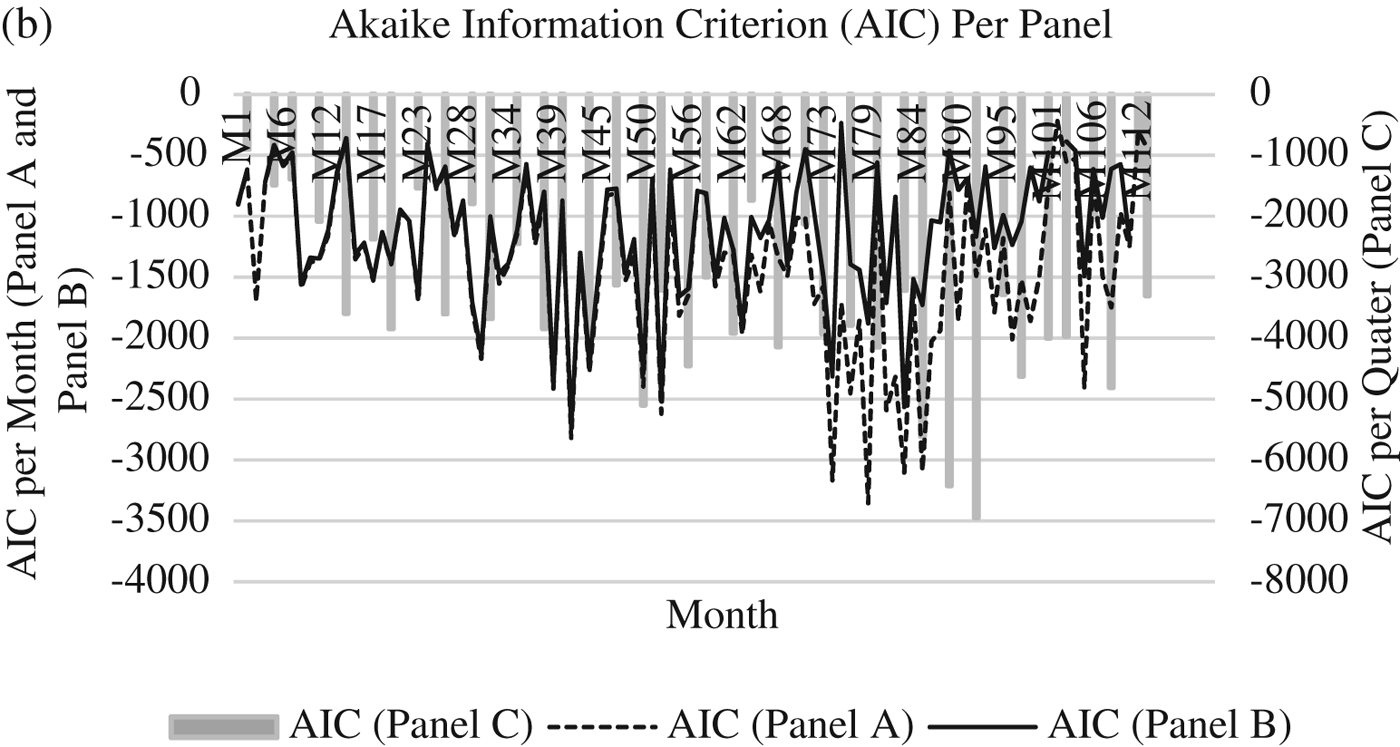
Figure 2b shows the Akaike Information Criterion (AIC), which compares the goodness of fit between subsamples in each panel (where the composition of transactions is different from one subsample to another). With a few rare exceptions, it should be noted that the explanatory power of the models is relatively high and similar across panels.
Akaike Information Criterion (AIC) Per Panel

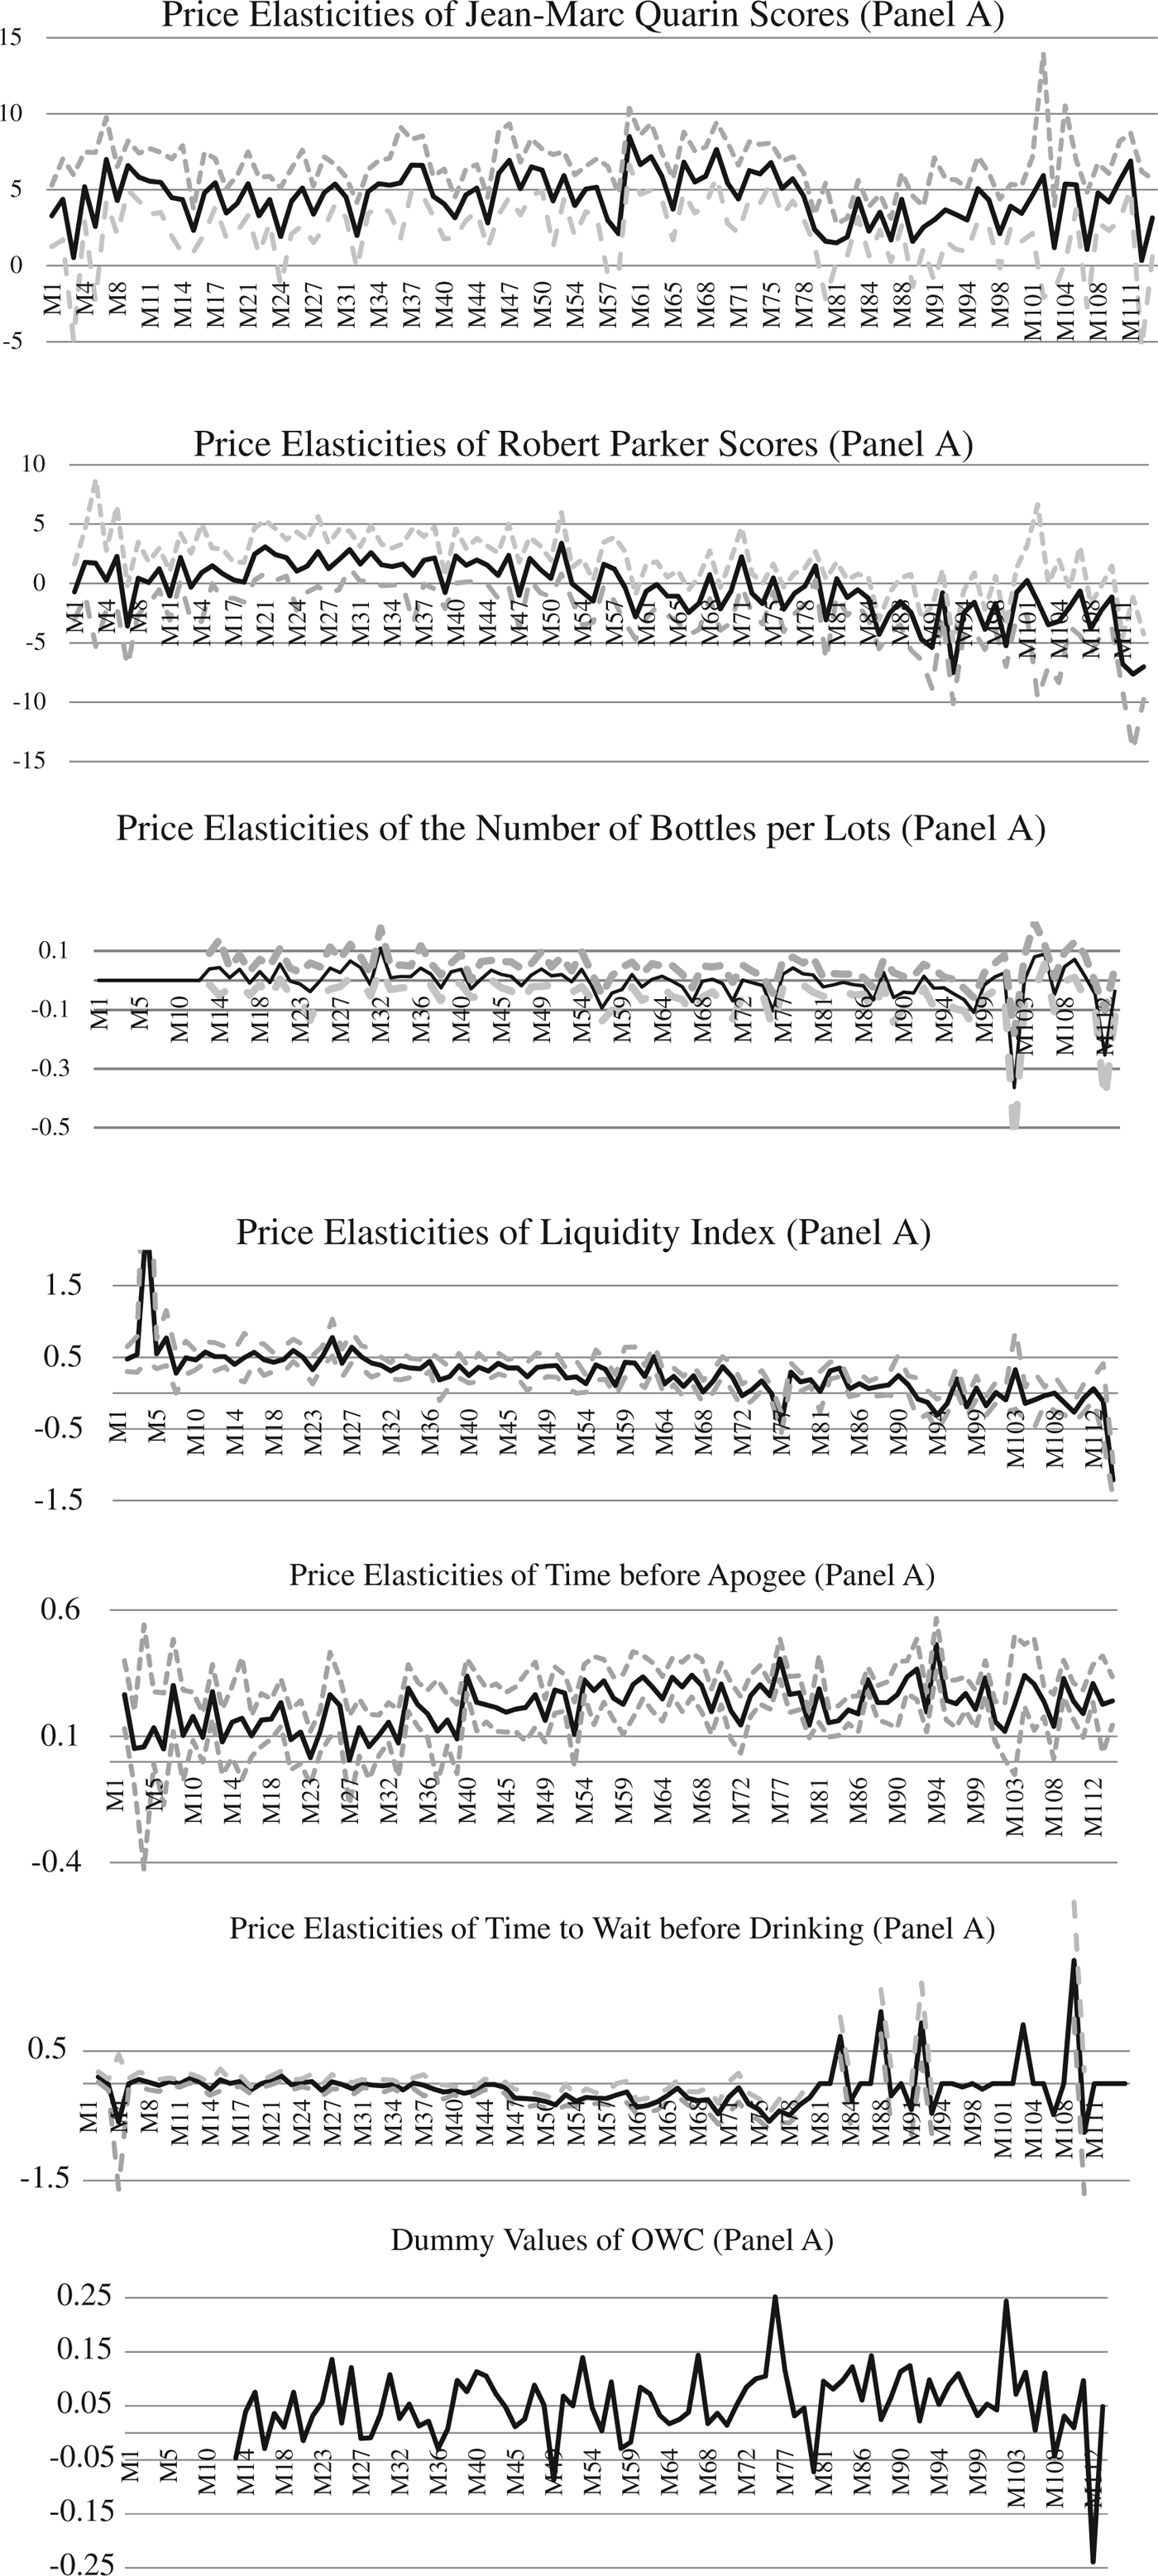
Figure 3 presents time series of selected hedonic coefficients (Panel A).
Panel A Estimated Hedonic Coefficients Time Series

For these regressions, we will only test the steadiness of hedonic coefficients concerning expert rating, liquidity, maturity of wine, number of bottles by lot, and packaging. The dummies—Wineries, Vintages, auction companies and places—have been removed to simplify the presentation. Furthermore, these variables may change across studies, while the selected variables are common to all wine hedonic papers. In addition, Figures A1.1, A1.2, and A1.3 exhibited in Online Appendix 1 indicate very similar trends of dummy values, either from one winery to another or from one vintage to another.
Finally, we assess whether the time series contains any structural breaks. To this end, we perform a homogeneity test on the Liv-ex Bordeaux Legends 50 Index.Footnote 11 After 10,000 Monte Carlo simulations, the test rejects the null hypotheses of homogeneity and indicates two significant periods.Footnote 12
Hereafter, we consider two homogeneous price periods: the first is identified as Panel A1 (from months 23 to 69), and the second, as Panel A2 (from month 70 to the end). The distinction between Panels A1 and A2 allows us to identify possible relationships between time series’ behaviors and the price levels. We further divide Panel A into a growth period (Panel AG) and a non-growth period (Panel ANG) of the Liv-ex Index.
Next, we describe the methodology used to test the stability of hedonic wine coefficients.
IV. Methodology and Results
The relationship between hedonic coefficients and their lagged values and/or the lagged values of the Liv-ex Index, is modeled using a MAR. For each attribute i, we note:

where e i,t is the estimated coefficient of the attribute i in the hedonic function run on t samples of observations; $\vartheta _i$ is an intercept; p and q are the selected lags for each possible explanatory variable; lnBL is the log-value of Bordeaux Legends 50 Index in period t; and u i,t is the iid residual.
In order to estimate our model using MAR, we must first verify that the time series meet the stationarity condition [I(0)]. In a second stage, we study the lag-structure to determine the optimal order of the p and q parameters.
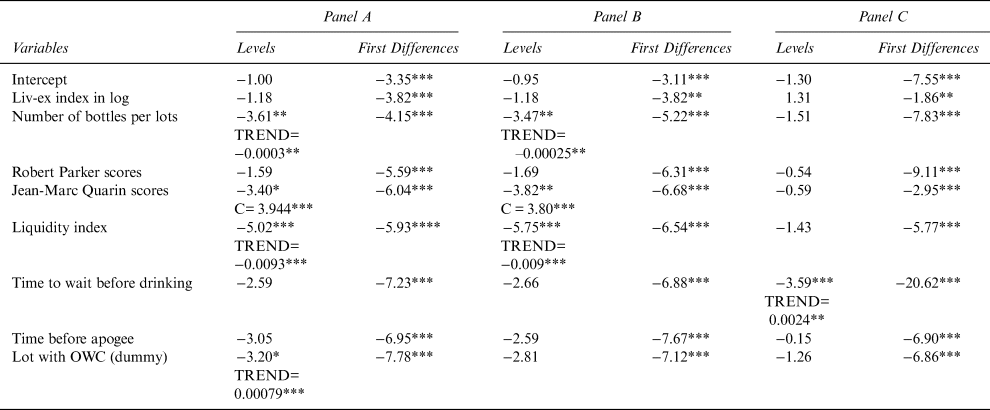
First, we test that the stationarity condition is met. We test the stationarity of each variable (i) in level and (ii) in first differences using an ADF test. The results, detailed in Table 3, indicate that all first-differenced series in Panels A and B are stationary. Phillips–Perron test confirms the stationarity of the lagged Liv-ex Index in Panel C.Footnote 13 We further observe that few time series exhibit stationary conditions when in levels. As a result, we run the MAR model on the first-differenced series.
Unit Root Tests (ADF Stationary Test)

Notes: The asterisks *, **, and *** denote statistical significance at the 10%, 5%, and 1% levels, respectively; series with a p-value inferior to 5% are stationary; when series are stationary in trend or intercept, the value and the probability is reported.
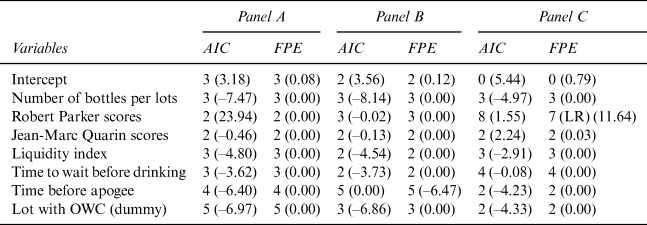
Next, we determine the optimal order of the p and q parameters based on both standard information criteria (AIC) and final prediction error criteria (FPE). The resulting choice of lags is detailed in Table 4. In most cases, the number of lags range between 1 and 4.
Number of Lags Selected

Note: T-tests of the AIC criterion and the probabilities of the FTE criterion for the selected lag are indicated in brackets.
The estimated MAR coefficients are expressed in first differences and represent changes in the price elasticity of attributes as a factor of their own lagged changes and the lagged changes of the price index (Liv-ex Bordeaux Legends 50, expressed in logarithms).
The interpretation of the estimated MAR coefficients is as follows.
• A negative lag variable coefficient implies an elasticity change that moves like a “snake in a tunnel.” Past increases (or, respectively, decreases) in elasticity produce decreases (or, respectively, increases) in the present elasticity. Thus, elasticity is not constant, but fluctuates around a trend.
• Conversely, a positive lag variable coefficient implies that changes are self-reinforcing. Past increases (decreases) lead to increases (decreases) of coefficients in the present. Thus, elasticity is not constant, but follows a trend.
• Finally, a positive lagged price index coefficient implies that an increase (decrease) in the index in the past results in an increase (decrease) in price elasticity in the present. Thus, elasticity is not constant, but depends on the cyclical evolution of the market price index.
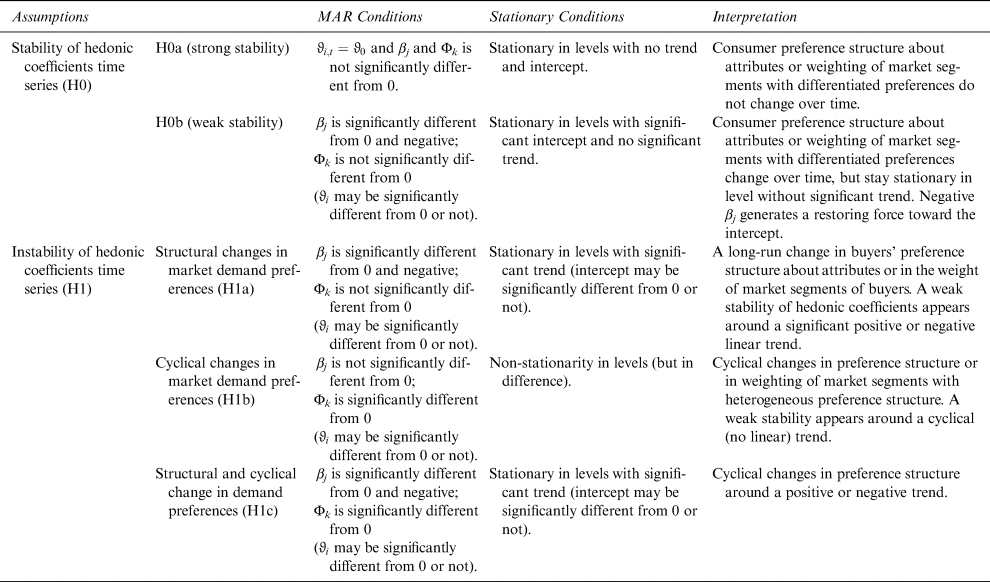
Our hypotheses relating to the stationarity of the hedonic wine coefficients can be decomposed into five testable statements.
• Stability hypotheses:
○ [H0a] The coefficients exhibit strong stability over time
○ [H0b] The coefficients exhibit weak stability over time
• Instability hypotheses:
○ [H1a] There are structural changes in market demand preferences
○ [H1b] There are cyclical changes in market demand preferences
○ [H1c] There are structural and cyclical change in demand preferences
H0 (the stability hypotheses) can be expressed in two versions. The strong version (H0a) assumes that e i,t is constant over time ($e_{i,t\;} = \vartheta _0$ ). The weak version (H0b) allows the hedonic coefficients to fluctuate around a constant and thus remain stationary in levels.
Conversely, H1 implies either (i) a structural change in the hedonic coefficients (H1a), (ii) a cyclical change (H1b), or (iii) both a structural and a cyclical change (H1c).
The testing conditions relating to these five hypotheses are summarized in Table 5.Footnote 14
Overview of Hypotheses and Test Conditions

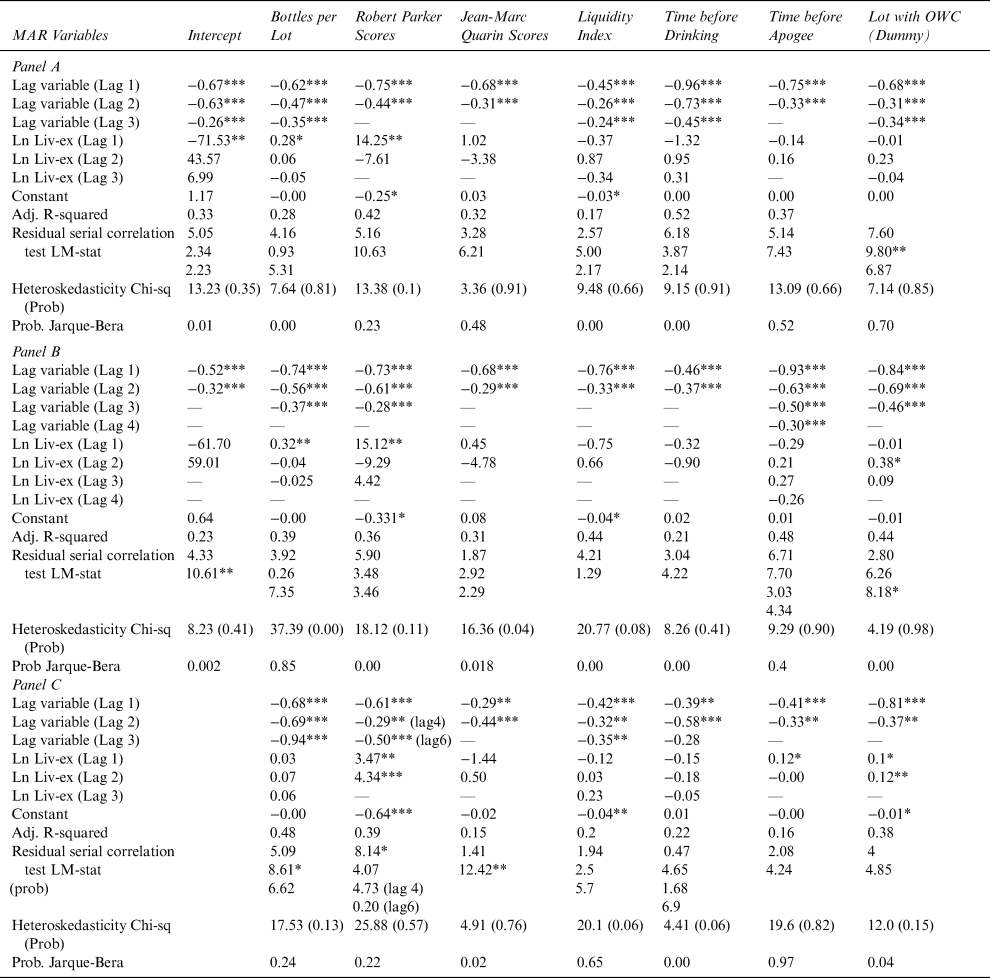
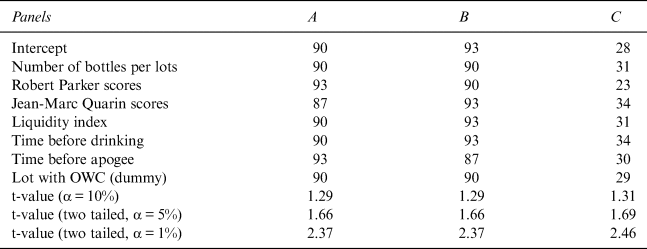
The results of estimated equations are summarized in Table 6, for Panels A, B, and C.Footnote 15 According to the degree of freedom, given in Table 7, thresholds of t-values have been computed in the two last columns, with two values of confidence level (95% and 90%).
MAR Estimation Results

Note: The asterisks *, **, and *** denote statistical significance at the 10%, 5%, and 1% levels, respectively, for coefficients and statistics.
Degree of Freedom and t-Value Thresholds Selected Per Equation

The bottom part of each panel of Table 6 presents the goodness of fit (R-squared) and the residual test results. The serial correlation LM test verifies that the chosen lag structure fully captures the dynamics of the data.Footnote 16 The heteroscedasticity LM-test indicates that the variance of the residual vector u i,t is constant (a condition for OLS estimation).Footnote 17 Finally, the Jarque–Bera test suggests that the residual vector u i,t follows a normal distribution.Footnote 18
The conditions for OLS estimations are met in all panels. However, the residual vector u i,t does not follow a normal distribution, which is not uncommon in large samples. Furthermore, in most cases, the homoscedasticity and no-serial correlation conditions are not met. However, since the estimators stay unbiased, they remain relevant.
V. Interpretation of Results
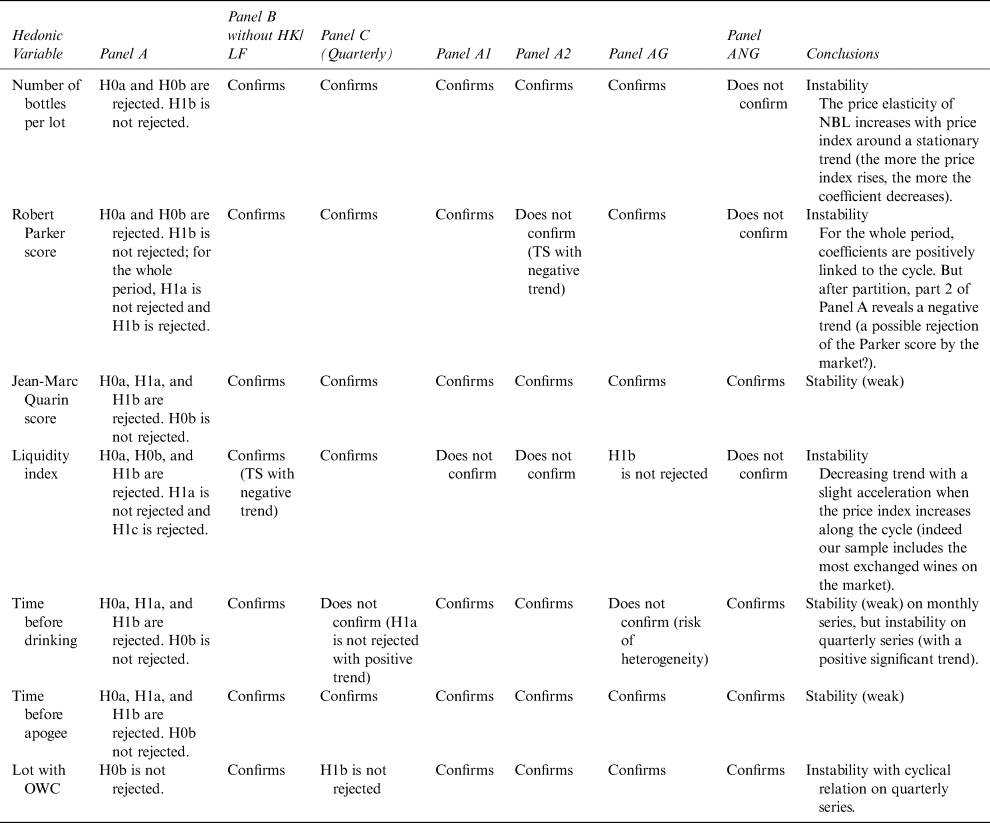
Table 8 summarizes the main results for the seven hedonic coefficients of interest.
Summary of Main Results

The number of bottles per lot variable (NBL) is not constant over time (H0a and H0b are rejected).Footnote 19 The variation of NBL is explained by both its own lagged values (negative relation) and by changes in the price index (positive relation).Footnote 20 These findings imply that the price elasticity of NBL is subject to cyclical changes that are positively impacted by movements in the price index.
The negative price elasticity of NBL expresses the percentage price decreases associated with a 1% increase in the number of bottles per lot. Therefore, if the price elasticity of NBL increases with the price index (in log), we infer that a higher-price index reduces the discount associated with buying greater volumes.
To further examine this finding, we split Panel A into a low-price period and a high-price period. We find that, in both periods, changes in the price index do not affect the price elasticity of NBL (see Table A4.1 in Online Appendix 4). In addition, we split Panel A into a growth period and a non-growth period of the price index (see Table A4.2 in Online Appendix 4). We find that the impact of changes in the price index on the price elasticity of NBL is highly significant in the growth period and statistically insignificant in the non-growth period.
We conclude that the discount based on purchasing volumes decreases when the price index increases, but not when price levels are high. Thus, the willingness to pay a high price depends on the cycle (growth/non-growth) and not on price levels. NBL is not subjected to structural changes (H1a is rejected), but exhibits cyclical changes in market demand preferences (H1b is not rejected).
At first sight, Robert Parker scores behave much like NBL. Fluctuations in the score are significantly explained by both its own lagged values (negative relation) and changes in the lagged (positive relation).Footnote 21
The price elasticity of Parker scores is subject to cyclical changes that move in concert with the price index. This relationship is highly significant in the low-price period, but not significant in the high-price period (see Table A4.1 in Online Appendix 4). Therefore, the impact of cyclical changes on the price elasticity of Parker scores depends on price levels. We also note that the positive relationship between Parker score and price index is highly significant during the growth period of the price index and statistically insignificant during non-growth periods of the price index (see Table A4.2 in Online Appendix 4). This suggests that, overall, the positive relationship is driven by results in the first period, that is, before the decline and stagnation phases of the price index.
One should also note that, in the second period of Panel A, the Parker score series is both stationary in first differences and in levels, with a significant negative trend (–0.114). This observation may be symptomatic of the Parker scores’ decreased popularity (compared to Quarin scores).
To summarize our findings with respect to the Parker score: we reject H0 (a and b); we do not reject H1b in the first part of the price series and we do not reject H1a in the second part.
With respect to Jean-Marc Quarin scores, we note that the price elasticity coefficients are surprisingly stable (in contrast to the Parker score coefficients). Hence, H0 cannot be rejected.Footnote 22
The liquidity index is of critical importance when it comes to investor strategy and the computation of hedonic indices. We find that the price elasticity of liquidity depends negatively on its lagged values, but is not influenced by price index fluctuations.Footnote 23 This last result, however, may be debated.
First, we note that, in all panels, the liquidity coefficient is either stationary in first differences (without trend or intercept) or in levels with a significant negative trend (–0.009). In other words, the liquidity coefficients vary around a slowly declining trend.
Second, the price index has a significant and negative impact on the liquidity coefficient in the growth period; this effect is not significant for the non-growth period. That is, in growth periods, a positive change in the price index reduces the sensibility of prices to wine liquidity.
In the long run, we thus observe a significant reduction of the liquidity impact on price—with accelerating effects during growth periods (reject H0). We conclude that the liquidity coefficient is subject to structural changes (H1a is not rejected) and cyclical changes (H1c cannot be rejected in growth period—Panel AG). This result is surprising in light of the growing importance of liquidity in wine finance. We note, however, that our sample only contains the most exchanged wines on the fine wine market (Faye, Le Fur, and Prat, Reference Faye, Le Fur and Prat2015). On this market, liquidity is probably not a crucial issue.
The two variables associated with wine maturity (“time to wait before drinking” and “time to wait before apogee”) behave in similar ways. If the impact of price index is insignificant, each variable depends negatively on its own lagged values.Footnote 24 The variables are stationary either in first differences or in levels, with a significant positive trend (0.0015) for “time to wait before apogee.” We infer that “time to wait before drinking” is weakly stable (we do not reject H0b) and that “time to wait before apogee” is subject to cyclical changes (H1b cannot be rejected). This second result is consistent with the growing importance of the age variable in wine hedonic models.
Finally, the OWC coefficients depend significantly on their lagged values in all panels. However, the price index is only highly significant in Panel C (quarterly series). Differences between Panels A and C suggest a composition effect bias: Since OWC are frequently missing for fine wines, monthly series may be inappropriate to capture the OWC effect. Using quarterly data, we find a positive relationship between the price index and the price elasticity of the OWC attribute. This finding is consistent with the fact that OWC are considered as a guarantee against counterfeiting. We conclude that OWC is subject to cyclical changes (H1b cannot be rejected). We reject both H0 (a and b) and H1a.
VI. Concluding Remarks
This study tests the stability of the hedonic wine coefficients over time. We find that the most frequently studied attributes are not stable over time. This finding sheds doubt on the long-term relevance of many studies. “Number of bottles per lot,” “Parker score” (until 2010), and “OWC” all exhibit cyclical movements, while “Time to wait before drinking” and “Parker score” (since 2011) exhibit structural changes. The liquidity index displays both cyclical and structural movements. Only the “Quarin score” remains stable.Footnote 25 As the cyclical effect tends to reinforce the price sensitivity of attributes, wine buyers seem to be exposed to a “representativeness” bias, rather than an “investors’ overconfidence” bias. The results are consistent with the decreasing importance of the Parker score and the increasing importance of age for famous fine wines.
This study opens up new research. One of the main conclusions is that perimeters of data and variables must be extended. Our results further attest to the need to create a permanent observatory of hedonic attributes on standardized databases, instead of the episodic hedonic research on specific data currently witnessed. Moreover, we only tested the stability of hedonic coefficients’ values. One may also extend this study to confidence intervals. In fact, price dispersion could react differently throughout the business cycle.
Supplementary Material
For supplementary material accompanying this paper visit https://doi.org/10.1017/jwe.2019.24.