Introduction
Our knowledge regarding decision-making skills in late adulthood continues to include many unanswered questions, and multiple discrepancies in the empirical results have been reported (for a review see Hess et al. Reference Hess, Strough and Löckenhoff2015; Rydzewska et al. Reference Rydzewska, Koscielniak, Sedek, Sedek, Hess and Touron2022; Strough et al. Reference Strough, Bruine de Bruin, Wilson, Thomas and Gutchess2020). Although some related studies have reported stereotypical age-related weaknesses in decision-making competencies (Denburg et al. Reference Denburg, Weller, Yamada, Shivapour, Kaup, LaLoggia, Cole, Tranel and Bechara2009; Lee and Soberon-Ferrer Reference Lee and Soberon-Ferrer1997; Samanez-Larkin et al. Reference Samanez-Larkin, Kuhnen, Yoo and Knutson2010), multiple studies have also provided evidence that older adults can be better and more rational consumers or decision-makers than their younger counterparts (Bruine de Bruin et al. Reference Bruine de Bruin, Strough and Parker2014; Ory et al. Reference Ory, Hoffman, Hawkins, Sanner and Mockenhaupt2003).
Bruine de Bruin et al. (Reference Bruine de Bruin, Parker and Fischhoff2012, Reference Bruine de Bruin, Parker and Fischhoff2020) analysed adult age differences in terms of decision-making competence and concluded that while a negative relationship between age and performance of tasks that are mediated by fluid cognitive ability (resistance to framing, application of decision rules) exists, no age-related relationships with respect to various other tasks were found. These authors found that in the second type of task (consistency in risk perception, recognising age-group social norms, under/overconfidence, resistance to sunk costs), older adults compensate for their decreased fluid cognitive abilities by referring to their life experiences. The authors noted that experience-related abilities, such as crystallised cognitive abilities and the processing of affective information, may improve with age.
In this article, we focus on the susceptibility of older adults to the attraction effect (Huber et al. Reference Huber, Payne and Puto1982), also known in the literature as the decoy or asymmetric dominance effect. This phenomenon refers to a common decision bias, wherein choice preferences can be influenced and even reversed by the introduction of a third, marginally inferior option, known as a decoy (Tsetsos et al. Reference Tsetsos, Usher and Chater2010). Specifically, the decoy serves to make one of the original options appear more attractive in comparison, thus leading to an alteration in the decision-making process. Additionally, our research explores how decision-making in risky situations changes with age.
Age and susceptibility to attraction effect
The attraction effect (Huber et al. Reference Huber, Payne and Puto1982) is one of the three context effects described in the literature (similarity, attraction and compromise). This effect refers to preference changes caused by introducing an additional, irrelevant option to a set of choices (Cataldo and Cohen Reference Cataldo and Cohen2019; Trueblood et al. Reference Trueblood, Brown, Heathcote and Busemeyer2013). Context effects contradict the regularity axiom (Luce Reference Luce1977) as one of the most fundamental axioms of rational choice, which causes all decision-makers to be more or less predictably irrational (Ariely Reference Ariely2010). In the present study, we wished to verify the effect of this irrationality on older adults compared to their younger counterparts.
When making decisions in everyday life or when shopping, it is sometimes obvious that some alternatives are entirely irrational, that is, that one of the options is clearly worse than the others and should not be considered. Psychological and marketing research has demonstrated that such choice architecture often underlies the attraction effect (Huber et al. Reference Huber, Payne and Puto1982; Lichters et al. Reference Lichters, Sarstedt and Vogt2015; Simonson Reference Simonson1989). This mechanism aims to increase a chosen alternative’s popularity by adding a similar but clearly inferior option (namely, a ‘decoy’). Numerous experimental studies have found the attraction effect to be robust across various domains and have demonstrated its widespread societal impact (Dhar and Simonson Reference Dhar and Simonson2003; Huber et al. Reference Huber, Payne and Puto2014; Sivakumar and Cherian Reference Sivakumar and Cherian1995). For example, this effect is relevant to consumers’ reactions to advertisements (Moran and Meyer Reference Moran and Meyer2006), general elections (Hedgcock et al. Reference Hedgcock, Rao and Chen2009) and even perceptual decision tasks (Trueblood et al. Reference Trueblood, Brown, Heathcote and Busemeyer2013).
For a more comprehensible description of the attraction effect, let us consider the situation described by Ariely (Reference Ariely2010) in his book Predictably Irrational. He noted three options for choosing a subscription to The Economist on its website: (1) a web subscription for USD 59, (2) a print edition for USD 125 and (3) a combined print and web subscription also for USD 125. The author commented that it would be absurd to choose the print edition since the combined option offers more for the same price. He confirmed the inferiority of this option in an experiment, showing that 84 per cent of decision-makers would choose the combined option, 16 per cent would choose the web subscription and none would choose the print subscription. Ariely was intrigued by the aim of such an offer, so he conducted his experiment once again to investigate another group of participants, only this time without showing them the print subscription as a decision option. The results turned out to be quite surprising in that withdrawing the irrelevant option (which no one had previously chosen) reversed the choice preference, making the web option the dominant choice (68 per cent) and the combined subscription the second choice (32 per cent). Thus, The Economist may have deliberately used the dominant option (decoy) to promote a selected product (target) at the expense of the popularity of another alternative (competitor).
According to one of the most popular explanations of the attraction effect, namely, multi-alternative decision field theory (Roe et al. Reference Roe, Busemeyer and Townsend2001) in addition to the more recent multi-attribute linear ballistic accumulator model (Trueblood et al. Reference Trueblood, Brown and Heathcote2014), preferences for different choice alternatives evolve in the process of the pairwise comparisons and evaluations of the choice attributes. This process continues until and unless a minimum threshold level of satisfaction with any of the available options is obtained (a ‘criterion’). The rationale for the attraction effect (preference leaning towards the dominant choice option) is that the pair formed by the target and the decoy is more salient than the pair consisting of the competitor and the decoy, most likely owing to the similarity of the attributes of the former pair. Thus, the attraction effect is likely to occur according to these models only when this similarity and inferiority of the decoy to the target is noticed and processed by drawing the decision-makers’ attention to this pair and causing selection of the dominant option.
Research on ageing and the attraction effect has been minimal. Only two papers have investigated this topic directly (Kim and Hasher Reference Kim and Hasher2005; Tentori et al. Reference Tentori, Osherson, Hasher and May2001), both of which suggest that older adults are less prone to becoming victims of manipulations based on the presence of decoy options. Tentori et al. (Reference Tentori, Osherson, Hasher and May2001) explained the results of their experiment in terms of the rationality of older adults, who deliberately exclude unfavourable options (unlike younger adults). Kim and Hasher (Reference Kim and Hasher2005) expanded this reasoning by focusing on the role of life experience and decision-makers’ reliance on different processing styles.
In the current research, we follow the hypotheses originally presented by Koscielniak et al. (Reference Koscielniak, Rydzewska and Sedek2018) by referring to a monotonic decrease in basic cognitive abilities (such as mental speed, working memory capacity) throughout adult life (Salthouse Reference Salthouse1996, Reference Salthouse2012). Engagement in demanding mental processes is also related to increasing motivational costs, so older adults become very selective with respect to choosing the tasks in which they want to invest their limited resources (Hess Reference Hess2014, Reference Hess, Sedek, Hess and Touron2022). Due to those cognitive and motivational limitations, we suggest that older adults may not be able to process choice comparisons correctly, especially in terms of the similarity between the target and the decoy options and their dominating relationship. This cognitive weakness should prompt older adults to make more irrational choices (that is, the selection of objectively inferior decoy options as the best among the three options).
However, the age-related deterioration in decision competence (namely, more frequent selection of decoy options) does not necessarily result in consistently higher resilience to the attraction effect among older adults. In our procedure, we did not use simple economic dilemmas that were applied in previous ageing and attraction effect studies, such as choosing a shopping voucher or products in the grocery store (Kim and Hasher Reference Kim and Hasher2005; Tentori et al. Reference Tentori, Osherson, Hasher and May2001); rather, we used graphical representations of probabilities. Visual reasoning requires experiential/intuitive processing, which remains effective until late adulthood, unlike many other cognitive skills (Peters et al. Reference Peters, Finucane, MacGregor, Slovic, Stern and Carstensen2000). Older people are likely to retain their ability to effectively compare visually defined choice alternatives in the roulette task, including the perception of their similarities and inferiorities. Therefore, we allow for the possibility that older adults may be just as vulnerable to the cognitive fallacies of context effects in this specific task as younger adults.
Age and susceptibility to decoys prompting either safe or risky decisions
Lifetime changes in risk preferences are subject to many inconsistencies in the literature (for a review, see Best and Charness Reference Best and Charness2015; Mata et al. Reference Mata, Josef, Samanez-Larkin and Hertwig2011). Real-world data related to sexual behaviour and crime statistics (Daly and Wilson Reference Daly and Wilson1997), for instance, suggest that risk-seeking declines with increasing age. However, the results of multiple laboratory studies have demonstrated the opposite; under certain circumstances, older adults can be bolder and more risk-seeking than younger people (Bauer et al. Reference Bauer, Timpe, Edmonds, Bechara, Tranel and Denburg2013; Mata et al. Reference Mata, Josef, Samanez-Larkin and Hertwig2011).
It should be assumed that these discrepancies are mainly caused by different decision types and inconsistencies in the research methods used in such studies. The meta-analysis conducted by Mata et al. (Reference Mata, Josef, Samanez-Larkin and Hertwig2011) formed a substantial distinction between two choices: (1) a risky choice based on experience and (2) a risky choice based on description. In the latter case, older adults tend to be more risk-averse in most experimental tasks (such as sure/risky gambling tasks, blackjack, but not in the Cambridge gambling task). On the other hand, this tendency is generally reversed in the case of decisions from experience in which data aggregated by those authors suggest that older people are slightly more risk-seeking in this context than younger people. The design of our roulette task more closely resembles risky choices based on experience (participants engage in repeated trials to become familiar with the task) rather than risky choices based on description. Consequently, this difference suggests a greater likelihood of risk-seeking behaviour rather than risk avoidance among older adults in our study.
Pachur et al. (Reference Pachur, Mata and Hertwig2017) emphasised that risk aversion is only one of the two characteristics associated with decision-making; the other characteristic is decision quality (choosing the option with the higher expected value (EV)). While the determinants of risk aversion are mainly emotional and motivational, decision quality seems to be influenced primarily by cognitive factors (the ability to integrate information regarding risk and potential gain). In light of previous research, little doubt exists that fluid abilities decline in older adults (Hartshorne and Germine Reference Hartshorne and Germine2015), which can result in older adults exhibiting worse decision quality than younger people. One example of research in this context is a study that used the Iowa gambling task (IGT) paradigm (Bauer et al. Reference Bauer, Timpe, Edmonds, Bechara, Tranel and Denburg2013), which reported that older people were more risk-seeking (‘hypersensitive to reward’). However, this risk was highly inefficient and resulted in worse outcomes.
In most previously employed sequential tasks (such as the balloon analogue risk task (BART) or the IGT), participants learnt about the outcome of their decisions at the end of each trial. This constant feedback (which is non-typical in everyday life) can result in sudden strategy changes during the task owing to the resulting reward/punishment (Eppinger et al. Reference Eppinger, Hämmerer and Li2011; Mell et al. Reference Mell, Heekeren, Marschner, Wartenburger, Villringer and Reischies2005) in addition to producing strong emotions related to those outcomes (Kurnianingsih et al. Reference Kurnianingsih, Sim, Chee and Mullette-Gillman2015). In the present study, we propose a new paradigm of the roulette task to reduce this noise by not revealing the outcome of participants’ decision-making. Moreover, to overcome age-related aversion to maths, this task is designed as a narrative scenario (‘Imagine you are in a casino where you see several roulette wheels’) and is thus more comprehensible to older adults, who are often less able to cope with complex mathematical problems (Duverne and Lemaire Reference Duverne, Lemaire and Campbell2005).
Cognitive failures in the attraction effect
Decisions made in the attraction effect paradigms reveal the general susceptibility of people to succumb to this manipulation and make predictable, biased decisions. However, it is essential to distinguish this susceptibility from the actual selection of decoy options, which are objectively inferior. The latter can be considered as cognitive failures or as decisions that are objectively suboptimal, representing decision-making errors encountered in everyday life. Such mistakes are often associated with stereotypical perceptions of older people as forgetful, absent-minded and/or bumbling (Kite et al. Reference Kite, Stockdale, Whitley and Johnson2005). The consequences of such cognitive weakness can be severe in an ageing society in which increasing numbers of older adults are expected to make crucial financial or medical decisions and to participate in political elections and other activities.
The research findings do not provide conclusive evidence regarding whether older adults genuinely face higher risks of making cognitive errors (for a review, see Hitchcott et al. Reference Hitchcott, Fastame, Langiu and Penna2017). The results of a re-analysis conducted by Koscielniak et al. (Reference Koscielniak, Rydzewska and Sedek2018) showed a significant relationship between age and the proportion of decoys chosen, indicating that older adults tend to choose dominated options more frequently than their younger counterparts. In the current research, we plan to examine the relationship between age and the tendency to commit simple errors more systematically – by using the number of inferior (decoy) choices as a representation of the susceptibility to committing cognitive failures.
To conclude, it is crucial to highlight that although susceptibility to the attraction effect and choice of suboptimal options are different concepts, both are relevant in everyday scenarios. Hence, our research aimed to investigate the nature and implications of both these aspects within decision-making processes.
Current research hypotheses
Based on the multiple theoretical and empirical premises described so far, we intended to verify several hypotheses related to decision-making differences throughout adult life. The primary expectation, which is based on findings by Tentori et al. (Reference Tentori, Osherson, Hasher and May2001) and Kim and Hasher (Reference Kim and Hasher2005), is that older adults will be less susceptible to the attraction effect. It must be noted, however, that the parameters of the choices in the previous studies were expressed in mathematical terms (such as the price of the product). This presentation may have discouraged older people from processing these parameters, and the decoy effect may not have occurred owing to a failure to notice the relationship between the target and the decoy (Koscielniak et al. Reference Koscielniak, Rydzewska and Sedek2018). In the current investigation, we decided to present the stimuli in a distinctly different format, characterised by the inclusion of both numerical and graphical information within a lottery paradigm. This methodological choice facilitates an exploratory examination of whether the observed attenuation in susceptibility to the decoy effect in older adults is a universal phenomenon or contingent upon the modality in which the choice alternatives are presented.
Contrary to popular stereotypes of ageing, we expect older adults to be more risk-seeking in the roulette task than younger and middle-aged groups. This hypothesis is consistent with the theory of hypersensitivity to reward developed by Bauer et al. (Reference Bauer, Timpe, Edmonds, Bechara, Tranel and Denburg2013) in the context of the Iowa Gambling Task, where older adults were very sensitive to rewards. Moreover, we designed this task in the form of a story to encourage participants to make intuitive choices based on their life experiences. According to the meta-analysis conducted by Mata et al. (Reference Mata, Josef, Samanez-Larkin and Hertwig2011), this format used for presenting a decision-making problem increases the propensity towards risk among older adults compared to that of younger people and should be observable in the roulette task with the exception of its first trials based on the description. Recent research on ageing and risky decisions by O’Brien and Hess (Reference O’Brien and Hess2020) suggested that intuitive focusing on probabilities in risky lotteries, instead of complex calculations of EVs, might characterise older adults. Moreover, this format of displaying lotteries is very close to pie charts, which are a convenient format of information that is well-processed by older adults (van Weert et al. Reference van Weert, Alblas, van Dijk and Jansen2021).The magnitude of green fields in our roulette task is a very salient graphic representation of probabilities. Hence, one can expect that decoys using proportions will be more effective in prompting risky decisions than decoys using stakes (values of wins), especially among older adults. After considering the strong evidence for declining cognitive performance in late adulthood (Hartshorne and Germine Reference Hartshorne and Germine2015; Salthouse Reference Salthouse2012), we expected the oldest age group to exhibit the highest frequency of cognitive failures (irrational choices of decoy options). This finding would align with the bounded rationality theory proposed by Nobel Prize winner Simon (Reference Simon1957), who suggested that cognitive limits and difficulties in processing information are common causes of irrational choices. In other words, older people may be inclined to point to the ‘first choice option’ in the roulette task without noticing that another, similar alternative dominates it. Finally, we planned to conduct exploratory analyses to examine the dynamics of risk propensity throughout the roulette task (in Experiment 2), thereby testing whether these preferences are similar across both age groups, namely younger versus older adults. This strategy is a relatively new approach in ageing research, and no rationale exists for making directional hypotheses in this domain. Based on the article by Koscielniak et al. (Reference Koscielniak, Rydzewska and Sedek2016), we can only suspect that the older adults’ abilities to improve their decision quality (such as decreasing the number of decoys) throughout the roulette task would be unimpaired compared to those of younger adults. If confirmed, these findings would have noteworthy implications, suggesting that older adults, despite experiencing age-related cognitive decline and an initial propensity for errors, may retain the ability to adapt their decision-making strategies effectively when given the opportunity to make choices in a sequential manner. In this context, accumulated experience could potentially compensate for declines in fluid cognitive abilities such as speed of processing and working memory.
In summary, this article aimed to answer essential questions regarding life changes in susceptibility to the attraction effect and risk tolerance. We believe that the nature of the stimuli used in our procedure (a narrative scenario featuring both numerical and graphic information) allows us to generalise our results and predict real-life decisions throughout the adult lifespan.
Experiment 1: online study
We used the roulette task paradigm in an online environment to investigate a wide sample of participants who were grouped into three age categories (young adults, middle-aged adults and older adults) to investigate age-related differences in risk tolerance, susceptibility to the attraction effect and the tendency to commit simple cognitive failures when making decisions. The roulette task was a modified version of the ‘gambling task’ developed by Hu and Yu (Reference Hu and Yu2014) with several important amendments. First, instead of presenting abstract diagram lotteries, we used a narrative story in which the participants were asked to imagine that they were in a real casino and could play a ball on a single roulette wheel of their choice. We assumed that this change would make the task more interesting and comprehensible for older adults, who are known for their aversion to complex mathematical operations (Duverne and Lemaire Reference Duverne, Lemaire and Campbell2005). Second, every trial consisted of at least one ‘risky’ choice (high stakes with a relatively low probability of winning) and one ‘safe’ choice (lower stakes with a high probability of winning). These wheels presented an identical EV.
The main difference between our roulette game and previous procedures is the between-subject design of this task. Participants in the control group were presented with only two wheels (the ‘risky’ and ‘safe’ wheels), while participants in the experimental conditions saw three wheels in each trial: (1) safe, (2) risky and (3) decoy. We proposed two experimental conditions. In one condition, we aimed to increase the participants’ probability of choosing the risky wheel by adding the risky decoy, which resembled the target wheel but clearly dominated in terms of probability or stake. Analogously, we tried to increase risk aversion in the safe condition by promoting the competitor wheel. Moreover, the first half of the trials included the stake decoy, such as the gain for the dominated option being smaller than the gain for the target option, while in the second half we used the probability decoys, in which the probability of winning was lower than in the target option.
Methods
Participants
A total of 406 participants were recruited via an online research panel; however, for further analyses, we included data from only 357 participants who successfully passed a single comprehension check item within the roulette task. The research group consisted of 47.6 per cent women and 52.4 per cent men across three age categories: (1) 18–33 (n = 126), (2) 42–57 (n = 121) and 65–80 (n = 110). No significant between-group differences in total years of education were observed, F(2, 354) = 0.58; p = 0.56; ηp2 = 0.003. Participants were financially compensated for their efforts and were rewarded with the panel’s social points (which they could exchange for material prizes such as cups or T-shirts).
Procedure
In addition to the planned entry criteria, the research panel restricted access to the procedure to include only participants who used screens with a resolution of at least 1280 × 960 pixels; in addition, only one submission from a single internet protocol (IP) address was allowed. All participants were asked to complete the demographic survey, which included questions regarding their ages, years of education and genders. Afterwards, they were redirected to the main part of the study (the roulette task), which included the information that the study aimed to collect to measure decision-making preferences. No time limits were enforced; participants were encouraged to take as much time as necessary to make rational decisions. The computer mouse was used as a primary communication device (for selecting the chosen options). Before starting the roulette task, participants were randomly assigned to one of the three experimental conditions: the ‘risky’ condition (n = 128), the ‘safe’ condition (n = 114) or the control group (n = 115).
Roulette task
To verify the research hypotheses, we applied a novel roulette task. It consisted of ten decision trials, each displaying two or three roulette wheels (depending on the experimental conditions). Each wheel consisted of only two fields: (1) the winning field (green) and (2) the losing field (red). Participants were asked to pick one single wheel in each set, indicating the wheel they would choose for gambling purposes in real life. For those choices, two parameters were indicated: (1) the probability of winning (the size of the green field) and (2) the stakes (presented numerically in Polish currency). Finally, half of the trials contained the stake decoy, so the gain for the dominated option was lower than the gain for the target option with identical probability of winning. In the second half of the trials, we used the probability decoys in which the probability of winning was lower than for the target options (while keeping the stakes identical). The sample trials used in the procedure are illustrated in Figure 1.
Sample trials in the roulette task.

In each experimental condition, participants were presented with a set of choice options that included two wheels with different parameters but identical EVs. The probability of winning on the risky wheel ranged from 19.00 per cent to 40.00 per cent with potential win amounts varying between PLN 32.00 and PLN 98.00 (USD 7.47 and USD 22.86). Conversely, the safe wheel featured a probability of winning that ranged between 63.00 per cent and 93.50 per cent and offered winnings between PLN 8.00 and PLN 35.00 (USD 1.75 and USD 8.17). In the condition incorporating a risky decoy, a third wheel was introduced that closely resembled the risky option but had an EV that was 20 per cent lower. Similarly, in the condition involving a safe manipulation, a decoy wheel was introduced with an EV 20 per cent lower than that of the safe wheel. Detailed parameters for each wheel are delineated in Appendix 1.
The actual trials were displayed in random order. The order in which the roulette wheels were displayed on the screen for each trial was also random.
After making their choices for all ten trials, participants selected a comprehension check in an additional trial. This check was intended to control their understanding of the task rules and their attention to the stimuli. This trial contained roulette wheels of which one was the most favourable regarding both stake and probability of gain. According to the pre-established criteria, participants who made a suboptimal choice in this trial were excluded from the data analysis.
Results
Risk-taking preferences
As each participant made ten decisions, we considered our data as nested within participants. Hence, to assess their risk tolerance, we applied a mixed logistic regression, with the choice in each trial as the dependent variable, coded as 1 = risky choice and 0 = safe choice (decoy selections were excluded from this formula as they were considered irrational decisions). Age group (younger adults versus middle-aged adults versus older adults), experimental condition (risky versus safe versus control) and their interactions served as independent variables (fixed effects). We also included random intercepts for participants. Because the age groups and experimental conditions were multinomial variables, we used simple coding for these variables with the younger adult group and the control condition as the benchmarks, coded 0, and introduced two dummy variables for age: (1) for the middle-aged group and (2) for older adults (compared with the younger group), both coded 1. Similarly, we used indicator coding for the experimental conditions with the control condition (no decoy) as the benchmark, which was coded 0, and introduced two dummy variables for the safe decoy and the risky decoy, both coded 1 (see para. 1.1. in the supplementary materials for details). Such an approach implies that the intercept for the logistic regression analysis is computed for the sample mean.
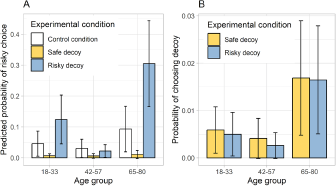
The fixed effects accounted for a 9.20 per cent variance in the dependent variable (marginal McFadden’s pseudo R 2), while together with the random effects they accounted for 83.25 per cent of the variance in the dependent variable (conditional McFadden’s pseudo R 2). We found that participants in the safe decoy condition were significantly more risk-averse than those in the control condition, while the participants in the control condition and the risky decoy condition did not differ significantly from each other (see Figure 2a and Table 1). Post hoc comparisons using the Bonferroni correctionFootnote 1 revealed significant differences between the safe decoy and both the risky decoy (p Bonferroni < 0.001) and the control groups (p Bonferroni = 0.004). Age differences in risk tolerance were significant such that the older adult group was the least risk-averse followed by the youngest group and the middle-aged group (further post hoc group analysis [p Bonferroni = 0.026]). The interaction between the age groups and the experimental conditions that revealed significant differences between the oldest group and the middle-aged group did not exist.
Experiment 1 results. (A) Chart depicting the risk preferences (probability of choosing risky option) across three age groups and between experimental conditions. (B) Probability of making irrational choices (selecting dominated options) in the roulette task trials.

Probability of risky choices as a function of participants’ ages and experimental conditions; fixed effects parameter estimates for logistic regression (Experiment 1)

Notes: B = estimate, SE = standard error, exp(B) = odds ratio, CI = confidence interval (lower and upper limit), Z = Z statistics, p = significance level.
Contrast coding: Age younger = 18–33 vs 42–57, Age older = 65–80 vs 42–57, Condition S = safe vs control, Condition R = risky vs control.
Intercept computed for the sample mean.
Similarly, we performed a mixed logistic regression analysis incorporating a decoy type (stake versus probability) as an additional predictor of risky choice. In this analysis, we used only the data from the risky decoy and the safe decoy conditions, as the participants in the control condition did not have a decoy to choose. We coded age groups in the same manner as used in the previous analysis, and we used simple coding for the two experimental conditions and for the decoy type (see para. 1.2 in the supplementary materials for details). Again, such an approach implies that the intercept for the logistic regression analysis is computed for the sample mean.
In this supplementary analysis (see para. 1.3), the fixed effects accountedfor a 12.1 per cent variance in the dependent variable (marginal McFadden’s pseudo R 2), while together with the randomeffects they accounted for 89.5 per cent of the variance in the dependent variable (conditional McFadden’s pseudo R 2). This analysisdemonstrated the significant effect of condition such that participantswere more prone to choose the risky option in the risky decoy condition than in the safe decoycondition. Although the effect of the decoy type was non-significant, we found a significant interaction between the experimental condition and the decoytype, and a significant three-way interaction for the older versus the middle-aged participants (see Table S1 in the supplementary materials). Further decomposition of these interactions revealed that the type of the decoy has no effectin the safe decoy condition (see Table S2 in the supplementary materials). Still, such a decomposition affected the choices in the risky decoy condition, such thatparticipants were less likely to choose a risky option when the risky decoy was basedon stake than when it was based on probability (for detailed results, see Table S2 and Figure S1 in the supplementary materials).
Only in the risky decoy condition did we find significant age effect (for both the younger and the older age groups) that was accompanied by a significant effect of the decoy type and significant older age group x decoy type interaction. A further analysis revealed that the youngest and the middle-aged participants were more prone to make risky choices when the decoy was based on probability than based on stakes, B = −0.79, SE = 0.32, exp(B) = 0.45, Z = −2.47, p = 0.014 and B = −1.39, SE = 0.38, exp(B) = 0.25, Z = −3.61, p < 0.001, respectively. However, we did not observe such a difference for the oldest group, B = 0.20, SE = 0.36, exp(B) = 1.22, Z = 0.56, p = 0.577.
The propensity for suboptimal decisions
Although the decoy choices were excluded from the focal analysis, we assumed that they presented a good representation of cognitive failures (suboptimal choices), as shown in Figure 2b. We conducted an additional mixed logistic regression by examining the predictors of the propensity to choose a decoy option. In this analysis, we again used only the data from the risky decoy and the safe decoy conditions, and we used simple coding for age and condition. The fixed effects (experimental condition, age group and their interaction) accounted for a 5.93 per cent variance of the dependent variable (marginal McFadden’s pseudo R 2), while together with the random effects they accounted for 59.93 per cent of the variance in the dependent variable (conditional McFadden’s pseudo R 2). The effect of the older age group was significant. Further post hoc tests with Bonferroni corrections indicated that older adults were more likely to make decision errors than participants in the middle and younger age groups (p Bonferroni = 0.008 and p Bonferroni = 0.067, respectively). No difference was observed between the middle-aged and the younger participant groups (p > 0.999). None of the remaining effects was significant (see Table S3 in the supplementary materials).
Discussion
The study aimed to verify hypotheses about the relationship between age and decoy manipulation with decision preferences under risk and uncertainty. We demonstrated that introducing a dominated choice option (decoy) impacts decisions in the roulette task and affects participants’ risk preferences. This effect was particularly noticeable between the two experimental conditions in which the decoy was introduced (risky versus safe), demonstrating the opposite directions of this effect compared to the control condition.
The analysis of the participants’ decisions demonstrates the age differences in risk preferences in the roulette task. The younger and the middle-aged adults were similar, while the older adult group was significantly more risk-seeking than the middle-aged adults. We suspect that participants differing in age put different focal weights on the lottery attributes. Namely, the younger age groups responded more strongly to the probability-based manipulation, while older adults focused more holistically on the roulette wheel parameters and equally to the probability of outcomes and the stakes.
Finally, we demonstrated that older adults were more likely than younger groups to make simple decision errors, that is, to choose decoy options. It is important to emphasise, however, the exceptionally high variance of this indicator in the eldest group. It might suggest that among people aged 65 and older, people who have great problems with attribute analysis and choice optimisation are found; however, at the same time, many of them do not experience such issues.
Experiment 2: a laboratory study
The roulette task procedure used in Experiment 1 was replicated in a laboratory setting with a few major modifications. As the participants in the younger and the middle-aged groups did not differ significantly in the analyses conducted for Experiment 1, we decided to include participants from only two age-extreme groups (younger adults versus older adults) in this experiment. We also introduced several changes to the roulette task. First, in the online study, most participants preferred safe alternatives to risky alternatives. Therefore, to encourage decision-makers to take greater risks and to eliminate the floor effect in the results, the EVs of all risky options were set to be 25 per cent higher than those of the safe options, thus making those alternatives more profitable and rational. Second, instead of the ten trials in Experiment 1, we asked our participants to make 30 choices.
Methods
Participants
Ninety younger adults (19–30 years old) and 90 older adults (65–76 years old) were invited to participate in this computerised laboratory study. Seven participants were rejected for failing to meet the predefined criteria; five made errors in both comprehension trials and two made irrational choices in more than 11 trials (more than three standard deviations [SD] from the mean). A total of 65.9 per cent of participants in the final group (n = 173) were women, and there was a similar proportion of genders in both age groups. Older and younger participants did not significantly differ in terms of their years of education.
The study participants in the younger adult group were recruited via online advertisement sites using the criteria of age (18–30 years) and education (at least a high school education). Older adults were recruited with the assistance of an external recruitment company with entry criteria including age (65–76 years) and possession of at least a high school education. It is essential to note that all participants received equal financial compensation for their involvement, and the remuneration they received remained independent of their choices made during the experimental trials.
Before proceeding with the experiment, older adults were asked to complete the mini-mental state examination (Tombaugh and McIntyre Reference Tombaugh and McIntyre1992) so that only people with no suspected dementia were allowed to participate in the study (the minimal number of points required for participation was 27 out of 30). Both groups were given information regarding the computer-based nature of the study and asked to bring any necessary corrective eyewear.
Procedure
The computerised procedure was written in Python 2 using the PsychoPy 2.4 package (Peirce Reference Peirce2007). The stimuli were displayed on 22-inch monitors with a resolution of 1920 × 1080 pixels. Choices were made using the arrow keys on the keyboard (left, down, right) and the space and enter keys were used to confirm understanding of the instructions.
We ensured that the procedure was identical for all participants and provided identical instructions to both age groups. Although older adults often declared less fluency using the computer, the entire procedure was very intuitive and none of the participants reported having problems with the hardware.
Roulette task
Before starting the roulette task, participants were randomly assigned to one of the three experimental conditions: (1) the risky condition (n = 60), (2) the safe condition (n = 57) and (3) the control group (n = 56). The roulette task was identical to the one used in Experiment 1 except with two differences: (1) the EVs of all risky options were 25 per cent more profitable than the safe choices and (2) the task consisted of 30 trials. The first half of the trials included the stake decoy (that is, the dominated option was defined by a winning amount smaller than the target option by 3 PLN), while in the second half the probability decoys were displayed (that is, the probability of winning in the dominated option was lower than the target option by 6 per cent). Probability values ranged from 66.50 per cent to 84.92 per cent for safe wheels and 16.73 per cent to 34.78 per cent for risky wheels, while rewards ranged from PLN 22.00 to PLN 57.00 (USD 5.12 to USD 13.28) and PLN 61.00 to PLN 284.00 ($14.21 to $66.15), respectively. Detailed parameters of all wheels are shown in Appendix 1.
In addition to actual experimental trials, the task included three training trials (which were conducted before the actual task) and two control trials (which were conducted after the regular choices) in which one wheel was explicitly the most favourable in terms of both the stakes and the probability. Participants who made mistakes in the training trials were asked to reread the instructions and start the task again, while mistakes in both control trials were grounds for excluding the participant’s data from further analysis.
No time limits were enforced. However, Python scripting allowed us to measure the participants’ exact reaction times for every experimental trial (an indicator of the ease and fluency of participants’ decision-making).
Results
Risk-taking preferences
As each participant made 30 decisions, we considered our data as nested within participants. Hence, we again applied mixed logistic regression, with the choice in each trial as the dependent variable, coded as 1 = risky choice and 0 = safe choice (decoy selections were excluded from this formula as irrational decisions). Age group (younger adults versus older adults), experimental condition (risky versus safe versus control), the number of the trial (continuous variable) and their interaction served as independent variables (fixed effects).
Because the age group and the experimental conditions were multinomial variables, we used simple coding for these variables with the younger adult group and the control condition as the benchmarks (see para.2.1. in the supplementary materials for details). We also mean-centred the trial number. Such an approach implies that the intercept for the logistic regression analysis is computed for the sample mean. We also included random intercepts for participants.
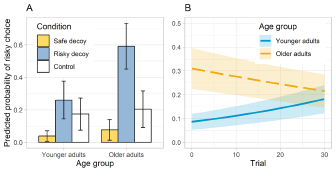
The fixed effects accounted for 8.37 per cent variance of the dependent variable (marginal McFadden’s pseudo R 2), while together with the random effects they accounted for 79.08 per cent of the variance in the dependent variable (conditional McFadden’s pseudo R 2). The effects of the experimental condition were significant (see Table 2 and Figure 3a). As in Experiment 1, post hoc comparisons using the Bonferroni correction reveal that participants in the safe decoy condition were more risk-averse than those from the risky decoy condition (p Bonferroni < 0.001), while the participants from the control condition and the risky decoy condition did not differ significantly from each other (p Bonferroni = 0.142) as did the participants from the safe decoy condition and the control condition (p Bonferroni = 0.270) as shown in Table 2 and Figure 3a. The effect of the age group was significant such that older participants were more prone to make risky choices than younger ones (see Figure 3b). The only significant interaction was the one between the age category and the trial number (see Table 2 and Figure 3b). Further decomposition of this interaction indicated that the risk tolerance of older adults was rather stable throughout the entire task, B = −0.01, SE = 0.01, exp(B) = 0.99, Z = −1.60, p = 0.109, while younger adults were initially very risk-averse and became increasingly bolder with each consecutive phase, B = 0.03, SE = 0.01, exp(B) = 1.03, Z = 4.00, p < 0.001. Alternative decomposition of the same interaction revealed that at the beginning of the task (Trial 1), younger individuals were significantly more risk-averse than older participants, B = 1.38, SE = 0.58, exp(B) = 3.96, Z = 2.37, p = 0.018, while this difference decreased over time, so that it became non-significant in Trial 9: B = 1.05, SE = 0.56, exp(B) = 2.85, Z = 1.86, p = 0.062. Ultimately, both groups became similarly risk-tolerant by the final phases of the roulette task, Trial 30: B = 0.18, SE = 0.58, exp(B) = 1.20, Z = 0.31, p = 0.758.
Probability of risky choices as a function of participants’ age, experimental condition and number of trials; fixed effects parameter estimates for logistic regression (Experiment 2)

Notes: B = estimate, SE = standard error, exp(B) = odds ratio, CI = confidence interval (lower and upper limit), Z = Z statistics, p = significance level.
Variable coding: Age older = 65–76 vs 19–30, Condition S = safe vs control, Condition R = risky vs control. Trial number mean-centred.
Intercept computed the sample mean.
Experiment 2 results. (A) Chart depicting the risk preferences (probability of choosing a risky option) across two age groups and between experimental conditions. (B) Chart depicting the risk preferences (probability of choosing risky option) as a function of age and trial.

As in Experiment 1, we also conducted another mixed logistic regression in which the decoy type (stake vs probability, coded as in Experiment 1) was incorporated as a predictor of risky choice. The effect of the experimental condition remained significant in this analysis. The effects of age and decoy type were non-significant, while their interaction was significant.
Although we did not find a significant interaction with the experimental conditions, we decided to conduct the same decomposition as performed in Experiment 1 and investigate the effects of age and the type of decoy in the two experimental conditions separately. As in Experiment 1, we found no significant effects under the safe decoy condition, while under the risky decoy condition we found a significant age group x decoy type interaction. Further analysis revealed that the younger participants were more prone to make risky choices when the decoy was based on stakes than when it was based on probability, B = 0.63, SE = 0.17, exp(B) = 1.34, Z = 3.63, p = 0.014, which was contradictory to what we found in Experiment 1. Moreover, the difference for the oldest group was significant and in the opposite direction, that is, participants were more prone to make risky choices when the decoy was based on probabilities than when it was based on stakes, B = −0.43, SE = 0.21, exp(B) = 0.65, Z = −2.10, p = 0.036. For detailed results, see Table S5 in the supplementary materials.
The propensity for suboptimal decisions
As in Experiment 1, decoy choices, which were excluded from the focal analysis, were considered a good representation of cognitive failures (suboptimal choices). Therefore, in the next mixed logistic regression analysis, we examined how the tendency to select decoys changed over time and whether this change differed in the different experimental conditions and between the different age groups. We again used only the data from risky decoy and safe decoy conditions. We applied simple coding for age and condition, mean-centred the number of trials and used the experimental condition, the age group, the number of the trial and all their interactions as predictors. The fixed effects accounted for a 12.59 per cent variance in the dependent variable (marginal McFadden’s pseudo R 2), while together with the random intercepts for participants they accounted for 40.39 per cent of the variance in the dependent variable (conditional McFadden’s pseudo R 2). The effect of the age group was significant such that older participants were more prone to choose decoys than younger participants (see Table S6 in the supplementary materials). The effect of the experimental condition was non-significant, the same as the interaction between the age group and the experimental condition. The effect of the trial was significant in that the probability of choosing the decoy decreased over the course of the study. The two-way interaction between the age group and the number of trial was non-significant. In contrast, the two-way interaction between the number of the trial and the experimental condition was significant, and the three-way interaction was marginally significant (see Table S6 in the supplementary materials). Further decomposition of these interactions revealed that over the course of the experiment, older adults were successively less prone to choose decoys; this effect was visible independent of the experimental condition. In turn, among younger participants, the propensity to choose decoys in the safe decoy condition decreased over time, while their tendency to choose decoys in the risky decoy condition was low and remained stable throughout the experiment (see the supplementary materials for details).
Suboptimal choices in control trials
We conducted an additional mixed logistic regression to check whether the results of the comprehension task (two control trials that intended to confirm the participants’ understanding of the task (coded as 0 = choosing a dominant option, 1 = mistake) depended on the age group, the experimental condition and the interactions of these two factors. We found that the probability of making a suboptimal choice was significantly higher for older than younger participants. We did not find a significant difference concerning the propensity to make suboptimal choices for the risky decoy versus the control condition or for the safe decoy versus the control. The two-way interactions were also non-significant. For detailed results, see Table S7 in the supplementary materials.
Fluency in processing task information
Finally, to analyse the dynamics of the participants’ decision-making preferences throughout the roulette task, we applied a mixed linear regression using the reaction time in each trial as the dependent variable. Age group (older adults versus younger adults), experimental condition (risky versus safe versus control), trial number and their interactions served as independent variables (fixed effects). As previously, we used simple coding for these variables with the younger adult group and the control condition as the benchmarks (see para.2.1. in the supplementary materials for details), and we mean-centred the trial number. Such an approach implies that the intercept for the linear regression analysis is computed for the sample mean. We also included random intercepts for participants.
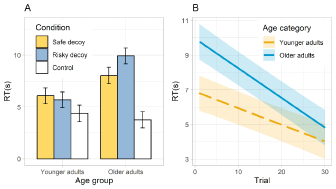
The fixed effects accounted for the 11.70 per cent variance of the dependent variable (marginal R 2), while together with the random effects they accounted for 43.70 per cent of the variance in the dependent variable (conditional R 2). We found a significant effect owing to both experimental conditions (see Figure 4a) such that participants were slower when the decoy was present than with no decoy (control condition). The effect of the age group was also significant in that younger participants were faster than older participants. The effect of the trial was also significant in that the reaction time decreased with each next trial. Although the three-way interactions were non-significant, the two-way interactions were significant (see Table 3 and Figure 4b for the interaction of age x trial).
Variability of reaction times in Experiment 2. (A) Chart depicting mean reaction time of response (decision-making) in seconds across three age groups and between experimental conditions. (B) Mean reaction time across 30 trials of the roulette task and between the age groups.

Reaction time as a function of experimental condition, age group and trial number; fixed effects parameter estimates (Experiment 2)

Further investigations revealed that the differences in reaction times among the three experimental conditions were significant for the older adults, who were the fastest in the control condition (without a decoy) but significantly slower when the decoy was present, respectively B = 4.27, SE = 1.12, T(166.03) = 3.82, P < 0.001 for the safe decoy versus the control condition comparison, and B = 6.17, SE = 1.09, T(166.03) = 5.66, P < 0.001 for the risky decoy vs the control condition comparison. These differences were much weaker and non-significant for younger adults, respectively B = 1.69, SE = 1.10, T(165.84) = 1.54, P = 0.127 for the safe decoy versus the control condition comparison and B = 1.31, SE = 1.10, T(165.85) = 1.19, P = 0.236 for the risky decoy versus the control condition comparison (Figure 4a).
Finally, although we found an overall effect of a decrease in reaction times in both age groups, this effect was stronger for older participants, B = −1.17, SE = 0.01, T(5011.98) = −14.01, P < 0.001 than for than younger participants B = −.09, SE = 0.01, T(5011.98) = −7.92, P < 0.001 for the risky decoy versus the control condition comparison. Alternative decomposition of the same interaction revealed that younger adults were significantly faster than older adults in the first trial [B = 2.96, SE = 0.68, T(22.03) = 4.35, P < 0.001] and in the middle of the task, around Trials 15–16 (B = 1.85, SE = 0.63, T = 2.92, P = 0.004), while these differences became non-significant in the last trial of the roulette task (B = 0.75, SE = 0.68, T = 1.09, P = 0.274).
Discussion
The present study aimed to confirm and extend the conclusions drawn from Experiment 1 by focusing on the possibility of utilising the attraction effect to manipulate risk propensity. The key research hypothesis stated that introduction of the decoy alternative would change the risk-taking preferences among younger and older adults. Furthermore, we intended to confirm the Experiment 1 results in which older adults were portrayed as higher risk-seekers in the roulette task compared to younger individuals. The study investigated the prevalence of irrational decision-making, age-related slowing in risky decision-making and the potential influence of the task phase on risk preferences and decision-making strategies.
The results of the study support the impact of the manipulation based on the attraction effect, particularly when comparing the two experimental conditions (safe vs risky decoy). Introducing the irrelevant and dominated decoy alternative impacted risk preferences and resulted in a change in decision strategy. In line with the previous study, we also found that older adults preferred riskier choices than did younger individuals. Moreover, we demonstrated that older adults were more inclined to make irrational decisions in which they more frequently selected dominated alternatives more frequently, even though better options were available. Finally, in agreement with the cognitive slowing hypothesis, older adults required more time than younger individuals to make decisions in the roulette task.
Notably, the relationships just described were significantly moderated by the phase of the roulette task. We showed a dynamic change in decision-making strategies in both age groups. While the risk preferences of older individuals remained relatively constant throughout the task, younger participants began with very cautious decisions and gradually accepted higher levels of risk as they made further choices. In the end, older and younger adults showed no significant differences in risk preferences. Moreover, despite the higher propensity of older adults to make suboptimal decisions compared to younger individuals, this tendency (together with between-group differences) decreased throughout the task.
These findings support the idea proposed by Koscielniak et al. (Reference Koscielniak, Rydzewska and Sedek2016) in which older adults have an unimpaired ability to optimise their behavior in sequential tasks as they gather experience. We obtained a similar result for reaction time analyses (information processing fluidity) in which older adults required more time than younger individuals to make decisions but only in the initial phase of the roulette task. As the trials progressed, these differences diminished, and, at the end, the speed/fluidity of information processing became similar in both age groups. This result suggests that providing older adults opportunities to train in new tasks (even without providing them external feedback) could enable them to achieve comparably good outcomes as younger individuals. We interpret this as a matter of merely familiarising older adults with the task, which was shown to be a sufficient strategy to minimise age-related declines in rule-based and non-rule-based category learning (Rabi and Minda Reference Rabi and Minda2017).
In evaluating shifts in choice preferences, it is essential to acknowledge that the roulette task lacked a feedback mechanism. This absence restricts the study’s generalisability to real-life settings in which feedback is required for experiential learning. Nonetheless, the observed changes in preferences demonstrate that mere repetition (even without feedback) also has an impact on the decision-making process.
It is also important to emphasise that the sampling strategy employed in this study introduced certain limitations. First, the use of online advertisements for recruiting younger adults may have introduced selection bias by potentially attracting individuals who were more technologically savvy or had specific interests in online platforms. Furthermore, partnering with an external recruitment company for older adults may also have limited the diversity of this cohort as such companies often have specific demographic pools from which they draw participants.
General discussion
Based on available sources, we assumed that older adults should be less likely to succumb to the attraction effect, as in the articles by Kim and Hasher (Reference Kim and Hasher2005) and Tentori et al. (Reference Tentori, Osherson, Hasher and May2001). We also based our assumption on the cognitive rationale of multi-alternative decision field theory (Roe et al. Reference Roe, Busemeyer and Townsend2001) and multi-attribute linear ballistic accumulator model (Trueblood et al. Reference Trueblood, Brown and Heathcote2014) according to which we expected that older adults would be less likely to notice the relationships between alternatives and to succumb to subtle decoy manipulations (Koscielniak et al. Reference Koscielniak, Rydzewska and Sedek2018).
In the two studies, we successfully demonstrated the presence and impact of the attraction effect in the risky choice environment. This result is consistent with the general principles of the attraction effect (Huber et al. Reference Huber, Payne and Puto1982), but at the same time we indicated its applicability in gambling tasks (Hu and Yu Reference Hu and Yu2014).
We could not confirm age-related differences in susceptibility to decoy manipulation since no interaction effect of the experimental condition and the age group was statistically significant. We believe that it may have to do with the construction of the decision task itself. The roulette task is clearly different from the paradigms used in other studies (earning extra credit in a course, grocery shopping) in which both knowledge and life experiences play a crucial role. This task is a new and abstract gambling challenge, and all age groups have to learn its rules and rely on intuition. Older adults do not differ from younger adults in this type of reasoning (Mikels et al. Reference Mikels, Löckenhoff, Maglio, Goldstein, Garber and Carstensen2010), which may explain the lack of age-related differences in response to our decoy manipulation (Koscielniak et al. Reference Koscielniak, Rydzewska and Sedek2018).
The main purpose of our study was to examine differences in the propensity to succumb to the decoy effect, and the results showing age differences in risk-taking propensity were also intriguing. Older participants were willing to accept more risks than their younger counterparts in the roulette task. This significant effect was observable in both experiments. These findings augment the ongoing discourse concerning incongruities observed in earlier studies (Mata et al. Reference Mata, Josef, Samanez-Larkin and Hertwig2011) by providing novel rationales that account for these disparities. First, the roulette task is a distinctive paradigm in terms of its stimuli (choice parameters), which features the graphical expression of the probability and numerical pay-off value. The decision at this point requires quite complex information integration, which (at least initially) should be easier for younger adults. The younger participants were possibly more engaged in looking at the probabilistic parameters of lotteries, causing them to avoid risky choices in the roulette task even when the risky EVs were more profitable. Older people, owing to their limited cognitive abilities (Salthouse Reference Salthouse2012) and reduced mathematical skills (Bruine de Bruin et al. Reference Bruine de Bruin, Strough and Parker2014; Duverne and Lemaire Reference Duverne, Lemaire and Campbell2005), possibly focused more on the higher reward as the most straightforward and prominent rationale for decision-making. However, if this explanation was indeed true, the tendency of older individuals towards risk should differ in trials based on probability manipulation versus stakes; however, this explanation was not empirically confirmed. Therefore, we can assume that other factors besides cognitive characteristics are involved in the roulette task paradigm. In the conceptually similar lottery research, disentangling the cognitive and the motivational factors in decisions under risk, Pachur et al. (Reference Pachur, Mata and Hertwig2017) showed that older adults chose more risky options in the gain domain, which also characterises our roulette paradigm. Moreover, they attribute it to the less negative affect and the lower risk aversion among older adults.
Last, it seems worthwhile to revisit the dichotomy between decisions made from description versus those made from experience (Mata et al. Reference Mata, Josef, Samanez-Larkin and Hertwig2011). Although the roulette task employed in this study leans towards an ‘experience-based’ style of information processing (where initial experience has an impact on decisions in consequent trials), it is notably devoid of immediate feedback following each trial. Therefore, we argue that this experimental framework did not neatly fit into the categories of either experience-based or description-based decision-making but rather incorporated elements of both. We believe that the elevated risk preferences observed among older adults could potentially be attributed to their more extensive life experience, which is an important predictor of risk-seeking behaviour in decision-making processes (Bellucci et al. Reference Bellucci, Fuochi and Conzo2020).
The roulette task appears to be a good method of investigating the number of cognitive failures in decision-making. An obvious indicator of such tendency is the frequency of choosing the decoy option (which should not be considered when a superior alternative is available). Although the number of such choices in the roulette task was not exceptionally high, the relationship between the participants’ ages and their cognitive failures indicated interesting findings.
In line with the stereotypes associated with ageing (Kite et al. Reference Kite, Stockdale, Whitley and Johnson2005), older people were found to be more prone to errors resulting from suboptimal decision-making. The results from Experiment 1 suggest that this change has a curvilinear character as no differences were spotted between the age groups of 18 to 33 and 42 to 57, while in the age group of 65 to 80 a significant increase in irrational decisions was already observed. An obvious explanation for this result is older adults’ reduced cognitive competence (Salthouse Reference Salthouse1996), which causes them to be less capable of noticing and processing subtle differences in choice attributes. However, the motivational factors are also worth highlighting in this context. According to selectivity theory (Hess, Reference Hess2014, Strough et al. Reference Strough, Bruine de Bruin and Peters2015; see also Baltes and Baltes Reference Baltes and Baltes1990), older adults focus primarily on personally relevant information or according to socioemotional selectivity theory they focus on positive stimuli (Carstensen et al. Reference Carstensen, Isaacowitz and Charles1999; Strough et al. Reference Strough, Bruine de Bruin and Peters2015). The roulette task did not meet any of these criteria; therefore, older adults could possibly have lacked sufficient motivation to exert the cognitive control that would have allowed them to avoid suboptimal choices.
Our study reveals an important finding in which older adults tend to make a relatively high number of decision errors by selecting irrelevant or dominated options in the preliminary trials of the roulette task; however, it should be noticed that the effect size of age was rather small. The societal implications of these results need to be underlined. While increased familiarity with the task does result in a reduction of errors in older adults, many important decisions in life rely on a single decision point. Consider, for instance, presidential elections or choosing a health insurance partner. Our study suggests that older adults may be particularly prone to decision-making errors in these critical, one-time situations, in which they cannot rely on life experience or familiarity with the decision-making environment. The consequences of such errors can be dire and result in unfavourable outcomes compared to other alternatives. Therefore, it is crucial for counsellors and organisations supporting the elderly to take proactive steps to protect them in such one-time choices, in addition to safeguarding them from manipulations based on the attraction effect itself. Emphasis should be placed on the costs associated with bad choices, encouraging older individuals to approach decision-making with thoughtfulness and care. Overall, our studies highlight the importance of providing support to older adults in making optimal decisions, particularly in the context of critical, one-time decisions.
Analysing the ease of decision-making (reaction times) in Experiment 2 indicates that older people need more time to understand the available information and choose their preferred option; however, their training ability is unaffected. As in the study conducted by Koscielniak et al. (Reference Koscielniak, Rydzewska and Sedek2016), the shift in reaction times throughout the roulette task was similar in both age groups, resulting in faster and easier decision-making as the participants learnt the rules. This change pertains to both the ease of decision-making, indicated by reaction time, and the decreasing tendency to make errors (choosing the dominated option). It is worth noting that while older adults made significantly more errors than younger adults at the beginning of the roulette task, the two groups did not differ by the time they reached the task’s final phase. Notably, regarding the entire roulette task, age-related differences in information processing time were evident only in the experimental trials (composed of three options, hence more cognitively demanding). For simpler trials, when choosing between two options in the control group, older adults made decisions with similar timing to younger adults, indicating that the stereotypical slowing in late adulthood does not pertain to simple and cognitively non-demanding choices.
Limitations of the study
Choosing roulette wheels in our paradigm is a highly abstract and imaginary task. It is possible to find analogies between these choices and everyday life decisions (such as buying fruit based on its size and price). Still, the fictional and hypothetical nature of the roulette stimuli may account for the reduced motivation to engage in the task. For this reason, verifying (replicating) our findings using other research methods is highly recommended.
Experiment 1, which involved similar EVs for safe and risky options, demonstrated a stronger effect for the ‘safe’ decoy compared to the ‘risky’ decoy. These findings propose a potential alternative explanation for the attraction effect in that it may function not only as a preference-reversal mechanism (Tsetsos et al. Reference Tsetsos, Usher and Chater2010) but also, under specific conditions, as a preference-boosting mechanism. Participants from all age groups clearly preferred safe choices in Experiment 1 and amplifying these baseline preferences with context manipulation turned out to be a stronger manipulation than trying to change cautious people into risk-lovers. However, we cannot resolve this hypothesis based on the collected data, and this thread should be addressed in future studies.
The objective of this research was to simulate real-world decision-making scenarios through the application of a roulette task. Insights derived from the analyses serve to enhance our understanding of the interplay between ageing, vulnerability to the decoy effect and the inclination to engage in risky behaviour. Although caution is advised when generalising these findings to a wider range of everyday decision-making contexts, they offer valuable contributions to the literature. We contend that our conclusions are particularly pertinent to sequential decision-making processes that incorporate both numerical and perceptual attributes, such as routine daily shopping, health-care choices and investment decisions.
Conclusion
Late adulthood does not have to be unequivocally associated with negative changes in the realm of decision-making. In our study, we demonstrated that older adults, in comparison with younger counterparts, are often (1) more risk-seeking in their decisions, (2) similarly susceptible to contextual manipulation and (3) efficient in making simple and cognitively uncomplicated decisions. Moreover, despite a noticeable slowing down in making complex decisions and making more cognitive errors in new and unfamiliar situations, older adults maintain a high ability to correct errors based on experience and to optimise their decisions in a manner similar to the younger individuals.
In an ageing society, age-related changes should be one of psychology’s most dominant focuses of interest. Despite the current study’s limitations, we believe that our findings add important information to the discussion concerning the nature of age differences in decision-making. We propose several explanations for previously observed discrepancies and highlight new determinants of older adults’ risk propensity and susceptibility to context effects. We also propose a new paradigm of the roulette task to conduct research in the domain of risk that can be applicable to both laboratory and online settings.
Acknowledgements
We would like to thank Malgorzata Kowal for her excellent technical assistance.
Author contributions
All authors designed the research and wrote the manuscript: MK and KR conducted the experiments and analysed the data; AG carried out a mixed logistic regression analyses; and GS made critical revisions. All authors approved the final manuscript for submission.
Financial support
This work was supported by the National Science Centre, Poland under Grant 2018/29/B/HS6/02604.
Competing interests
The authors declare none.
Ethical standards
Ethical approval was obtained from the Ethics Committee of the Faculty of Psychology at SWPS University of Social Sciences and Humanities (reference number 6/2016).
Appendix 1: parameters of the roulette task trials
(1 USD = approximately 4.15 Polish zloty [PLN])

Appendix 2. Parameters of roulette tasks in Study 2