Introduction
During the last 50 years, atmospheric warming has caused an increase of +0.5°C in the annual mean air temperature at the western Antarctic Peninsula (WAP; Steig et al. Reference Steig, Schneider, Rutherford, Mann, Comiso and Shindell2009). Furthermore, relatively warm deep ocean currents circulating around the Antarctic continent due to changes in wind forcing account for acceleration of grounded land glaciers and West Antarctic Ice Sheet mass loss (Pritchard et al. Reference Pritchard, Ligtenberg, Fricker, Vaughan, van den Broeke and Padman2012). Summer air temperatures at the WAP are frequently c. 0°C or above, and thus close to the melting point of larger ice sheets (Osmanoglu et al. Reference Osmanoglu, Navarro, Hock, Braun and Corcuera2014).
The South Shetland Islands (SSIs) at the northern tip of the WAP are characterized by a relatively warm and humid climate, and experience rapid loss of ice mass through surface melting and evaporation, progressive thinning of glacier tongues and ice flux through the periphery of the ice cap (summarized in Osmanoglu et al. Reference Osmanoglu, Navarro, Hock, Braun and Corcuera2014). Based on remote sensing data, the areal loss between 2000 and 2008 from the southern ice cap on King George Island, the largest of the SSIs and the area of this study, was estimated at c. 1.6% of the island’s area (Rückamp et al. Reference Rückamp, Braun, Suckro and Blindow2011). In line with the rapid regional warming trend in this area, Monien et al. (Reference Monien, Schnetger, Brumsack, Hass and Kuhn2011) and Majewski et al. (Reference Majewski, Wellner, Szczuciński and Anderson2012) demonstrated increasing sediment accumulation rates in Maxwell Bay at the south-western coast of King George Island since the middle of the 20th century and, in particular, during the last decade.
Each summer a network of meltwater streams develops in the ice-free areas of Potter Peninsula that transports significant amounts of eroded sedimentary particles into Potter Cove. Studies of the seasonal variability of freshwater discharge and the effects of suspended particulate matter (SPM) release on the Potter Cove pelagic communities show that phytoplankton are negatively affected by the shading effect of the SPM layer within the upper water column (Schloss et al. Reference Schloss, Ferreyra, Mercuri and Kowalke1999). However, SPM does not have exclusively negative effects on marine organisms. Ardelan et al. (Reference Ardelan, Holm-Hansen, Hewes, Reiss, Silva, Dulaiova, Steinnes and Sakshaug2010) showed that SPM in coastal surface waters around the SSIs may also positively affect primary production, possibly related to the release of dissolved and particulate iron. Ablated particles are a reservoir for the micronutrient iron, which could become bioavailable through photochemical reactions (Breitbarth et al. Reference Breitbarth, Achterberg, Ardelan, Baker, Bucciarelli, Chever, Croot, Duggen, Gledhill, Hassellov, Hassler, Hoffmann, Hunter, Hutchins, Ingri, Jickells, Lohan, Nielsdottir, Sarthou, Schoemann, Trapp, Turner and Ye2010) via a complex combination of biogeochemical reactions in the upper water column (Raiswell et al. Reference Raiswell, Vu, Brinza and Benning2010) or by flocculation at freshwater–seawater transitions (Markussen et al. Reference Markussen, Elberling, Winter and Andersen2016). The exact mechanism producing bioavailable iron in this setting has not yet been fully explored (e.g. Raiswell & Canfield Reference Raiswell and Canfield2012) and a clear definition of bioavailable iron is also missing (Shaked & Lis Reference Shaked and Lis2012). According to Shaked & Lis (Reference Shaked and Lis2012) and Lis et al. (Reference Lis, Shaked, Kranzler, Keren and Morel2015) a range of naturally occurring iron components, including goethite, ferrihydrites and Fe-(oxyhydr)oxides, can be taken up by certain phytoplankton, resulting in a species- and component-dependent increase in primary production. These bioavailable iron components represent mineral/chemical structures that can be leached from bulk sediment by buffered ascorbic acid (Raiswell et al. Reference Raiswell, Vu, Brinza and Benning2010).
Therefore, recent studies have used the ascorbate-soluble iron fraction (FeA) to estimate the most potentially bioavailable iron fraction of particulate matter in iron-depleted regions of the Southern Ocean (Shaw et al. Reference Shaw, Raiswell, Hexel, Vu, Moore, Dudgeon and Smith2011, Raiswell & Canfield Reference Raiswell and Canfield2012).
Dust deposition has long been regarded as the major source of iron to the Southern Ocean, with recent estimates ranging between 0.09 and 1 mg m-2 yr-1 for aeolian iron input (Jickells et al. Reference Jickells, An, Andersen, Baker, Bergametti, Brooks, Cao, Boyd, Duce, Hunter, Kawahata, Kubilay, LaRoche, Liss, Mahowald, Prospero, Ridgwell, Tegen and Torres2005, Wagener et al. Reference Wagener, Guieu, Losno, Bonnet and Mahowald2008). Furthermore, icebergs, glacial input and resuspended shelf sediments represent a significant source of iron to coastal and shelf areas. According to Raiswell & Canfield (Reference Raiswell and Canfield2012), the estimated contribution from iceberg transport ranges between 0.06 and 0.12 Gg yr-1 (c. 0.003–0.006 mg m-2 yr-1 nanoparticles and aqueous iron across an area of 20x106 km2), whereas Shaw et al. (Reference Shaw, Raiswell, Hexel, Vu, Moore, Dudgeon and Smith2011) extrapolated the iceberg iron input to be 2–20 mg m-2 yr-1 based on the FeA fraction of particles released from icebergs. The flux of dissolved iron (Fed) released from the porewater system of the WAP shelf was estimated to range between 0.35 and 39.5 mg Fed m-2 yr-1 (Monien et al. Reference Monien, Lettmann, Monien, Asendorf, Wölfl, Lim, Thal, Schnetger and Brumsack2014). In general, the ‘island effect’ of iron supply from land masses or shelf sediments to the coastal Southern Ocean is well described (e.g. Blain et al. Reference Blain, Tréguer, Belviso, Bucciarelli, Denis, Desabre, Fiala, Jezequel, Le Fevre, Mayzaud, Marty and Razouls2001, Planquette et al. Reference Planquette, Statham, Fones, Charette, Moore, Salter, Nédélec, Taylor, French, Baker, Mahowald and Jickells2007, Ardelan et al. Reference Ardelan, Holm-Hansen, Hewes, Reiss, Silva, Dulaiova, Steinnes and Sakshaug2010, Monien et al. Reference Monien, Lettmann, Monien, Asendorf, Wölfl, Lim, Thal, Schnetger and Brumsack2014). Despite these much improved recent estimates, a further step to complete the iron budget for this region is quantification of the potentially bioavailable iron in meltwater SPM from surface and subglacial erosion.
The aims of this study were to determine the sources and sinks of SPM in Potter Cove and to estimate the amount of SPM released into the cove in a typical summer melting period. As with other areas along the WAP, King George Island has experienced massive ice loss over the last decades and newly ice-free areas are exposed to weathering (Rückamp et al. Reference Rückamp, Braun, Suckro and Blindow2011), accelerating erosion of rock and soil surfaces. In one approach, Potter Cove runoff volume was extrapolated to the total surface area of the SSIs to quantify the potential iron input from the islands to the coastal Southern Ocean. The composition of SPM was further investigated using the ascorbate leaching method (at near-neutral pH) to assess the potentially bioavailable iron content. The potential of eroded surface particles as a source for bioavailable iron input to the Southern Ocean compared to other potential sources is discussed.
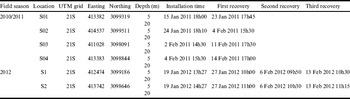
Location and deployment times (UTC-3) of sediment traps.

Materials and methods
Sampling
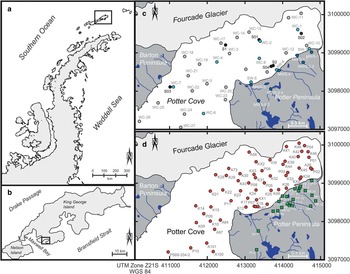
During three summers (December to March in 2009–2012), four different meltwater streams located on Potter Peninsula, and nine offshore sites in the water column of Potter Cove were sampled for SPM (Fig. 1, for geographical co-ordinates see Appendix I Table S1 found at http://dx.doi.org/10.1017/S095410201600064X). Samples were taken on a weekly basis, with a few sampling gaps due to poor weather conditions. Meltwater stream and surface water samples were collected using pre-washed 2 l polyethylene bottles. For this, bottles were thoroughly rinsed with ultra-pure water, then with natural water on-site. In the field laboratory, a defined volume of each homogenized water sample was filtered over 0.45 µm preweighed polycarbonate filters (Merck Millipore, Darmstadt, Germany) for SPM quantification. One part of the suspension was decanted and SPM was transferred to a PE tube (Sarstedt, Nümbrecht, Germany) for leaching experiments.
Maps of a. the western Antarctic Peninsula with the South Shetland Islands, b. King George Island and Potter Cove. Sampling locations of c. sediment traps (S0x, 2010–2011 and Sx, 2012; black circles), water column sampling (light blue and grey circles), meltwater stream sampling (dark blue circles), and d. surface sediment samples (red circles) and soil samples (green squares).

Discharge volumes of two of the meltwater streams (MWS-2 and 4; see Fig. 1) were determined in the summer (29 January–5 March 2011) by daily measurements of in situ stream profiles and flow rates. The cross section of the stream profile was measured near the outflow into the cove to estimate the variable discharge volume based on stream diameter and recorded current velocities. Daily discharge was calculated for the maximum discharge wave (16h00 local time), which was determined by interval measurements every 3 h on 2 March 2011. Based on Fourier analysis of the observed data timeseries, a Monte-Carlo model was developed to simulate the discharge from the two creeks into Potter Cove during summer melt conditions. The simulated summer discharge quantity was assessed as 7.55 hm3 over 60 days. When linearly extrapolated to the full 2011 summer, the total discharge amounts to 11 hm3 over 90 days. Discharge contributions from the other streams were regarded as negligible, because the channels transported little or no water or were disconnected from glacier discharge. As water discharge for Mathias Creek (MWS-5) is only fed by summer precipitation and was measured in 2009 by Silva Busso it was disregarded for this study. The discharge of water and SPM are related to the catchment area of the Potter stream basin that comprises a small moraine area of 1.29 km2. All calculations of the estimation of surficial particle runoff are based on this catchment area, the particle data gained in this study and the estimation of sediment accumulation data within Potter Cove.
During the 2010/2011 and 2012 summers, profiles of the temperature, salinity and turbidity were obtained at all water column sampling sites using a Sea-Bird CTD (SBE19plusV2, Sea-Bird Electronics, Bellevue, WA, USA) with an attached turbidity sensor (NTURT-134, WETLabs, Philomath, OR, USA). Additionally, SPM surface samples were taken twice (December 2010 and February 2011) on a high-resolution grid (28 sampling points within Potter Cove) to determine the spatial extent of the sediment plume.
Cylindrical plexiglas tubes (height (h): 25.3 cm, diameter (d): 4.19 cm, h/d: 6.04) were deployed as sediment traps at 5 and 20 m water depth. The traps were deployed by SCUBA divers at different locations in Potter Cove (Fig. 1c, detailed geographical co-ordinates and deployment times are shown in Table I) where they remained for seven days until recovery, or occasionally for up to 14 days during rough weather conditions. Collected material and the SPM-containing water samples (0.1–2 l) were filtered over preweighed polycarbonate filters (Millipore), which were carefully washed with 20 ml of 18.2 MΩ cm water to remove sea salt, before being stored at 4°C for geochemical analyses. The SPM fraction for iron leaching was decanted, transferred and stored in PE tubes.
Considering that Potter Peninsula meltwater streams carry sediment particles for a mean period of 183 days per year (Eraso & Dominguez Reference Eraso and Dominguez2007), sediment accumulation rates were calculated from sediment traps based on the following formula:
 $$SAR{\,\equals\,}{{sample\,weight} \over {deployment\,time}}.{{{{mean\,of\,sedimentation\,days} \over {yr}}} \over {area}}.$$
Soil samples were obtained from different locations on Potter Peninsula (PP-xx, PI-xx, F-xx; see Fig. 1d and Appendix I Table S1) with a metal-free polypropylene spoon. Short cores (Kxx and Pxx) were taken in Potter Cove using a small gravity corer (UWITECH, Mondsee, Austria; 5.7 cm diameter) and push cores (5.4 cm diameter) operated by divers (Fig. 1d, Appendix I Table S1) and sliced at 1–2 cm resolution. All soil and sediment samples were frozen within 3–5 h after sampling and lyophilized in the Dallmann Laboratory at Carlini Station. Additional surface samples (Axx, first 2 cm) were recovered using a Van Veen grab sampler (Fig. 1d, Appendix II Table S2 found at http://dx.doi.org/10.1017/S095410201600064X) and stored at 4°C before being lyophilized and sub-sampled for geochemical analyses. All SPM samples and sediments were ground and homogenized at the Institute for Chemistry and Biology of the Marine Environment (Oldenburg, Germany) using an agate planetary mill (Pulverisette 5, Fritsch, Idar-Oberstein, Germany).
Sample preparations and geochemical analyses
To determine total element contents in SPM, preweighed SPM filters were dried at 60°C for c. 12 h, cooled in an exsiccator at room temperature and weighed. For acid digestion, selected filters with sufficient material (>50 mg) were placed in a closed polytetrafluoroethylene (PTFE) vessel system and preoxidized with 1 ml HClO4 (70%; Suprapur, Merck Millipore) at 150°C for 2 h. Then 3 ml HF (40%; Suprapur, Merck Millipore) was added, and the closed PTFE vessels were heated to 180°C for 12 h (starting temperature: 60°C, heating rate: 30°C h-1). Next, the acids were evaporated at 180°C on heating blocks until incipient dryness and the residuals were re-dissolved (three times) with 3 ml 6-N HCl (subboiled). Subsequently, 2 ml HNO3 (2% v/v, subboiled) and 10 µl HF (40%; Suprapur, Merck Millipore) were added to the residuals and samples were simmered at 60°C for 1 h. Finally, the solutions were heated again at 180°C in closed PTFE vessels overnight for 12 h. Clear solutions were diluted to a final dilution factor of 500 with HNO3 (2% v/v, subboiled) and analysed for major and trace elements by inductive coupled optical emission spectrometry (ICP-OES, iCAP 6000, Thermo-Fisher Scientific, Dreieich, Germany; Al, Fe, Mn, Mg, Ca, Na, K, Ti, P, Cu, Ba, Sr, Zr, Y, Zn) and by inductive coupled plasma mass spectrometry (ICP-MS; Element 2, Thermo-Finnigan, Dreieich, Germany; Cs, Rb, U, Nb, Pb, rare earth elements (REE; i.e. La-Lu)). Filter blanks were processed using the same procedure except that no sample was filtered. Standard reference materials (see ‘Error analysis and method validation’) were digested together with a blank filter to ensure that samples were completely digested.
Glass beads for x-ray fluorescence (XRF) analysis of surface sediment samples (0–2 cm) were prepared according to Monien et al. (Reference Monien, Lettmann, Monien, Asendorf, Wölfl, Lim, Thal, Schnetger and Brumsack2014). Major and minor elements (Al, Fe, Mn, Mg, Ca, Na, K, Ti, P, Cu, Rb, Ba, Pb, Sr, Zr, Y, Zn) were measured with a conventional wavelength dispersive XRF (WD-XRF) spectrometer (Philips PW 2400). Total organic carbon (TOC) was calculated from the difference between total carbon and total inorganic carbon, which were determined by combustion analysis (CS 500, ELTRA, Haan, Germany) and coulometry (CM5014 CO2 Coulometer, UIC, Joliet, IL, USA), respectively. Element contents were corrected for seawater salt using porewater data and the water content of each sample. Where porewater data were not available, the correction assumed seawater composition and a bottom water salinity of 34‰, which is the average salinity found at Potter Cove during all field seasons.
The readily leachable iron, and therefore the fraction most likely to be bioavailable, was determined through buffered ascorbate extraction (FeA, after März et al. Reference März, Poulton, Beckmann, Küster, Wagner and Kasten2008). First, decanted samples were oven dried (60°C for c. 12 h). Then 200±1.5 mg of selected dried samples (sediment trap material: S2, suspended material: MWS-1, 2, 4, 5 and SW-F4, cores: KX4, P04, P05 and P09, for details see Appendix I Table S1) were weighed into 50 ml polypropylene screw cap centrifuge tubes (Sarstedt, Nümbrecht, Germany) to which 20 ml of a 11.35 mol l-1 ascorbic acid solution, buffered with 1 g sodium citrate and 1 g sodium bicarbonate, were added (final pH=7.5). After the sample had been shaken at room temperature (23±1°C) for 24 h, the suspension was centrifuged (3500 rpm) for 5 min before the supernatant was analysed for iron using ICP-OES.
For age determination, three short cores (K44, P03 and P09) were analysed for 210Pb in 5–8 cm resolution steps. Out of the 48 cores retrieved in Potter Cove, only these three were suitable for dating. Near-surface bioturbation, high physical disturbance/sediment resuspension due to ice calving at the glacier front, and physical mixing of the sediment surface by icebergs caused disturbances in most of the cores. Several cores were too short (<30 cm) and did not reach zero 210Pb excess activities, necessary for 210Pb inventory calculations.
Samples were sealed in cylindrical vials and stored for one month to achieve radioactive equilibrium. Activities of radionuclides (210Pb: 46.5 keV, 214Pb: 351.9 keV, 214Bi: 609.4 keV) were measured by gamma spectrometry (Ge-well-detector, GWC 2522-7500 SL, Canberra Industries, Meriden, CT, USA) and processed with GENIE 2000 3.0 software (Canberra Industries). Standard reference material (UREM-11) was used to determine the efficiency for 210Pb, 214Pb and 214Bi. 210Pb excess (210Pbxs) and unsupported 210Pb were calculated from the difference between total 210Pb activity and supported 210Pb, which was determined through 214Pb and 214Bi assuming secular equilibrium with 226Ra. 210Pbxs values in the vertical sediment profiles between the measured horizons were interpolated at 1 cm resolution, and compaction effects were taken into account by correcting the 210Pbxs activities with the dry bulk density. The total 210Pb inventory was then determined by integration of the corrected 210Pbxs activity data vs accumulated sediment depth. Finally, the age of each sediment slice and bulk sediment accumulation rate (SAR) were determined by applying the constant flux (CF) model after Sanchez-Cabeza & Ruiz-Fernández (Reference Sanchez-Cabeza and Ruiz-Fernández2012). 137Cs (661 keV) could not be detected in the samples for age model validation due to its very low concentration in Antarctic sediments. All uncertainties presented here were calculated following the quadratic uncertainty propagation, assuming that the quantities involved are independent.
Calculation of an index for sediment and soil weathering
A quantitative approach estimating the degree of weathering is the Chemical Index of Alteration (CIA; Nesbitt & Young Reference Nesbitt and Young1984 and references therein):
 $$CIA{\,\equals\,}{{Al_{2} O_{3} } \over {\left( {Al_{2} O_{3} {\,\plus\,}Na_{2} O{\,\plus\,}K_{2} O{\,\plus\,}CaO^{{\asterisk}} } \!\right)}} \cdot 100.$$
Here, values are expressed as molar ratios, and CaO* (carbonate corrected) and Na2O (corrected for seawater salt) exclusively represent the silicate mineral component. Whereas a CIA value of 30–50 is typical for fresh, unaltered rocks, values of 80–100 are indicative of completely weathered material (Nesbitt & Young Reference Nesbitt and Young1984). Since samples do not show an enrichment in phosphorus, an additional correction of the CaO* for apatite derived from bird excrement (penguins and skuas) was not necessary.
Error analysis and method validation
All samples were measured in a random order to avoid artificial trends. Precision and accuracy were evaluated using in-house (PS-S, TW-TUC, Loess, ICBM-B, Peru-1, DR-BS) and international reference standards (STSD, BIR-1, JA-2, JB-1, PACS-1, JG-1a, UREM-11). To determine the degree of statistical variability and method precision, the relative standard deviation was used. For TOC, ICP-OES, ICP-MS and XRF analyses, multiple determinations of reference materials were performed to calculate the pooled relative standard deviation. Accuracy of each method was determined by calculating the relative systematic error representing the variation from the certified value. Precision was better than 1% for major elements (Al, Fe, Mn, Mg, Ca, K, Na, P) measured by XRF. Precision of major elements in SPM filter samples (acid digestion, ICP-OES) was better than 5%, except for Fe (7%), Mn and P (both 10%). Trace elements (Cu, Cs, Rb, Sr, Th, U, Y, Zr, Zn, REE, Nb and Ba) and bulk parameters (TOC) were measured with a precision better than 5%, with the exception of Cs (6%) and Y (10%, SPM filter samples). For the blanks (acid, filters) all element concentrations were below the detection limit (e.g. Fe was 3 µg l-1). Iron blanks for all methods used in this study were ≤0.4% of the lowest sample concentration. For gamma spectrometry, counting statistics were better than 5% for all samples except those with very low 210Pb activity (<0.08 Bq g-1). Accuracy and precision of this method were <10% for all radioisotope (210Pb, 214Pb and 214Bi) activities.
Quantification of suspended particulate matter discharge into Potter Cove
The total summer SPM discharge into Potter Cove, which also includes the subglacial input of SPM, is estimated based on two different approaches.
In Approach 1, sediment traps collected SPM sinking vertically from surface waters to the sea floor in different sectors of the cove. The SPM content in the surface water layer (0–5 m) of Potter Cove results from the mixing of subglacial and surface meltwater transport. The overall vertical SPM flux into Potter Cove (SPM PC total, trap ) was therefore estimated according to the following:
 $$SPM\,PC_{{total,\,trap}} {\,\equals\,}SAR_{{trap}} \,\times\,Area\,PC_{{total}} ,$$
where SAR trap represents the average accumulation rate in the upper 5 m of the water column as determined in our sediment trap study, and Area PC total is the total area of Potter Cove (7.14 km2, see Appendix II Table S2).
In Approach 2, an estimate of the total input of SPM into the cove (SPM PC total,Pb-210 ) based on SAR obtained from 210Pb data of Potter Cove sediment cores is given by:
 $$\eqalignno{&SPM\,PC_{{total,\,Pb\hbox-\it210}} {\,\equals\,}\cr&{{Area\,PC_{{dep}} \cdot SAR_{{\it 210Pb}} \cdot \left( {100\hbox-\%\,Export_{{SPM\,PC}} } \right)} \over {100}},$$
where SAR 210Pb represents the average local sediment accumulation rate obtained from 210Pb data, Area PC dep is the sediment depositional area in Potter Cove (5.95 km2; Wölfl et al. Reference Wölfl, Lim, Hass, Lindhorst, Tosonotto, Lettmann, Kuhn, Wolff and Abele2014) and %Export SPM PC is the SPM export rate. The latter parameter represents the proportion of SPM that is not deposited in but exported from Potter Cove. It is defined as the difference of the sediment trap deployment of a near-surface trap (3–5 m water depth) and a near-bottom trap (c. 20 m from the surface, this study).
The surface runoff from Potter Peninsula was estimated as follows:
 $$SPM\,PC_{{surficial}} {\,\equals\,}V_{{dis}} \,\times\,c_{{SPM}} ,$$
where V dis represents the total discharge volume from Potter Peninsula meltwater streams into Potter Cove and c SPM is the average SPM concentration in the meltwater.
The subglacial input of SPM (SPM PC subglacial ) is then calculated as the difference between total SPM input (SPM PC total ) calculated from both approaches and the SPM derived from surficial meltwater discharge (SPM PC surficial ):
 $$SPM\,PC_{{subglacial}} {\,\equals\,}SPM\,PC_{{total(trap/\it 210Pb)}} {\,\,\hbox-\,\,}SPM\,PC_{{surficial}} .$$
Results
Temporal variations in summer suspended particulate matter discharge
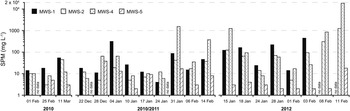
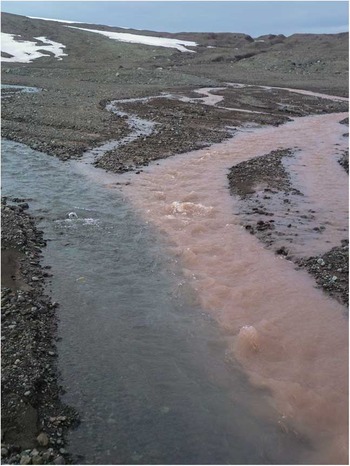
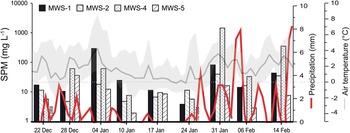
In a first step, SPM quantities were combined with water volume discharge results to approximate the total SPM runoff into Potter Cove. Water samples collected in the meltwater streams during the three summer campaigns had highly variable SPM concentrations (Fig. 2). During the first field season (January–March 2010), SPM concentrations were not higher than 54 mg l-1 (average 15 mg l-1). In contrast, in the two following years, average concentrations were 283±99 mg l-1 with maxima of up to 1500 mg l-1 (two events in 2010/11) and 18 000 mg l-1 (one event in 2011/12) in MWS-4 (Potter South). Some tributary creeks carry more SPM than others, as visible from their red-brownish colour compared to clear water streams (Fig. 3). Meltwater streams (MWS-1, 2 and 4) carried most SPM in January and February.
Temporal variations in suspended particulate matter (SPM) concentration during the summer. Data columns represent four different meltwater streams on Potter Peninsula with increasing distance to the glacier edge (MWS-1 glacial proximity, MWS-5 glacial distance).

Meltwater stream (MWS-4, 5 February 2011) showing one brownish coloured and one clear water tributary (photo by P. Monien).

In Matias Creek (MWS-5), SPM concentrations recorded were low (<38 mg l-1) in all years, with peaks at the end of the snow melt in December. The onset of the snow melt could not be sampled.
The longest and most complete sampling series from 2010/2011 were used to relate SPM runoff to local precipitation patterns (i.e. rain and snow; Fig. 4). Between December 2010 and March 2011, mean daily air temperatures were mostly above freezing. On four sampling days (28 December 2010, 4 January, 31 January and 14 February 2011) SPM concentrations were conspicuously high, correlating with high precipitation and, moreover, with mean daily air temperatures >2°C and minimum temperatures >0°C.
Suspended particulate matter (SPM) loads (bars) from summer 2010/2011, precipitation (red line, doi.pangaea.de/10.1594/PANGAEA.808250 and doi.pangaea.de/10.1594/PANGAEA.758314) and mean air temperature (grey solid line, minimum and maximum day temperatures as shaded area, doi.pangaea.de/10.1594/PANGAEA.808250 and doi.pangaea.de/10.1594/PANGAEA.758314).

The spatial turbidity pattern
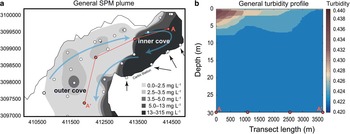
The spatial extension of SPM in the upper part of the Potter Cove water column (0–20 m) was determined in order to describe the spatial patterns of sedimentation (vertical transport) vs horizontal transport of particulate matter within the upper water column towards Maxwell Bay and Bransfield Strait. The SPM concentration in the water column varied depending on i) stream discharge volume and ii) wind speed and direction. In general, the SPM plume originating from the glacier front and from the outflow of the meltwater streams is mixed with inflowing clear water from Maxwell Bay and leaves the cove at the south-western edge. Figure 5a depicts the spatial distribution of SPM concentrations based on all available data between 23 December 2010 and 14 February 2011. In contrast, a general turbidity transect from the glacial front (A) to the outer cove (A’) during the same time period (Fig. 5) shows that the south-western area is generally low in SPM (0–0.5 mg l-1), whereas surface waters in the south-eastern inner region close to the glacier show SPM concentrations of up to 3.5 mg l-1.
Average spatial distribution of suspended particulate matter (SPM) concentration in the surface waters of Potter Cove during summer 2010/2011. Blue arrows indicate flow direction of water masses (Roese & Drabble Reference Roese and Drabble1998) and black arrows show meltwater discharge areas. b. Generalized (December 2010–February 2011) turbidity profiles along a transect from the discharge of water and SPM with a turbidity sensor. Salinity profiles show the same pattern (not shown, see doi.pangaea.de/10.1594/PANGAEA.811942).

Sediment trap data
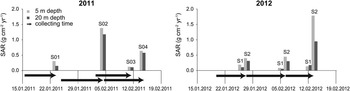
Sediment trap data were used to estimate the recent sedimentation in Potter Cove. Results from the sediment trap analyses during the 2010/2011 (S01–S04) and 2011/2012 (S1 and S2) summers highlight two different sedimentation regimes in Potter Cove. Sediment traps S01, S03 and S1 (north-western section of Potter Cove with glacier and meltwater streams) collected less material than S02, S04 and S2 (south-eastern sector of Potter Cove with glacier termination and ice-free areas on Potter Peninsula; Fig. 6). In the traps located in front of the meltwater streams (ice-free areas), SAR as high as 1.8 g cm-2 yr-1 were calculated. These high sedimentation events concurred with an increase in meltwater volume and high sediment loads in both years (Figs 2 & 6). The mean summer sediment flux from the north-western coastline was 0.12 g cm-2 yr-1, whereas in the innermost part of the cove (S02) the SAR was 0.7 g cm-2 yr-1. For the estimation of an annual sediment export and sedimentation budget, the mean SAR of S2, S02 and S04 was calculated (0.47 g cm-2 yr-1). The SPM content in the 20 m traps (S2, S02 and S04) was 15–50% lower than in the 5 m traps (S2, S02 and S04). This indicates that significant amounts (15–50%) of particulate matter remain in the upper water column and do not sink to the sea floor in the inner cove. For further calculations of the export rate of particulate matter, a conservative proportion of 15% of SPM to remain in the upper water column and be exported to Maxwell Bay was chosen.
Estimated sediment accumulation rates (SAR) from sediment trap data for different locations in Potter Cove. Sedimentation is estimated to last 183 days. Arrows indicate time frame of sediment collection, end of arrow highlights the trap recovery date.

Chronology and accumulation of sediment in Potter Cove
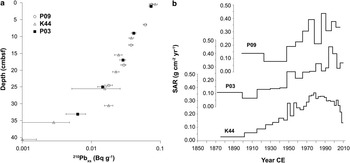
The 210Pb age models of the short cores taken from different sectors of the inner and outer Potter Cove comprise accumulation periods between present and the last 133 (K44), 131 (P09) and 137 years (P03). Sampling stations of cores K44 (water depth: 38 m) and P03 (water depth: 32 m) are located in the central inner cove, whereas P09 (water depth: 62 m) was retrieved at the outlet of Potter Cove into Maxwell Bay. The 210Pb age models reveal that SARs have generally been increasing at all core locations since the beginning of the 20th century (Fig. 7), with local maxima at c. 1990 (P03, 0.40 g cm-2 yr-1) and 2011 (P09, 0.48 g cm-2 yr-1). In contrast, core K44 only shows a marginal increase in SAR since 1950 with a present maximum of 0.18 g cm-2 yr-1 (Fig. 7). The average SAR in Potter Cove during the past 130 years is 0.23±0.05 g cm-2 yr-1.
Sediment depth vs 210Pb excess activities in cores P03, P09 and K44 and b. calculated sediment accumulation rates (SAR) using the constant flux model after Sanchez-Cabeza & Ruiz-Fernández (Reference Sanchez-Cabeza and Ruiz-Fernández2012). Error bars represent uncertainties calculated following quadratic uncertainty propagation.

These SARs are only estimates because the underlying age model could not be validated using 137Cs; however, the recent SARs (between 1993–2010 ce) estimated from the sediment cores using the 210Pb CF model can be verified with our sediment trap data. The resulting average SAR of 0.47 g cm-2 yr-1 derived from the sediment trap data is in the same order of magnitude as the average SAR obtained from all 210Pbxs dated cores (0.33±0.14 g cm-2 yr-1, average last 20 years) supporting the results of our age model.
An attempt to budget surface runoff and subglacial particle discharge
As described in ‘Materials and methods’, the total summer SPM discharge into Potter Cove can be estimated using two different approaches. Using the average accumulation rate in the upper 5 m of the water column (0.47 g cm-2 yr-1), as determined in our sediment trap study (Approach 1), the overall vertical SPM flux into Potter Cove (surficial and subglacial input) is calculated to be c. 39x103t yr-1. In contrast, by using the average local SAR over the past 20 years obtained from 210Pb chronology of Potter Cove sediment cores (0.33 g cm-2 yr-1), the depositional area of 5.95 km2 in Potter Cove and a relative depositional rate of 15–50% (see ‘Sediment trap data’) to assess the SPM flux to Potter Cove soft sediment areas, the total SPM input is estimated to range between 23x103 t yr-1 (15%) and 39x103 t yr-1 (50%) (Approach 2).
In order to retrieve information on the unknown amount of SPM derived from subglacial discharge, the flux of SPM transported via surficial meltwater streams into the cove has to be calculated. Based on the runoff values measured on-site between 29 January 2011 and 5 March 2011, discharge volume was estimated at 7.55 hm3 for the entire Potter creek system. This system only includes the glacial proximal streams (MWS-2 and 4) transporting the main particle load into Potter Cove (average 71%). The direct glacial outflow (MWS-1) and Matias Creek (MWS-5) as a glacial distal creek are neglected in our calculations due to low measured particle loads (MWS-5) or disturbance by tidal cycles (MWS-1), where runoff water was sometimes diluted by the passage of a seawater pond, although measurements were conducted at low tide. The total length of the discharge period was 124 days and ranged from 13 December 2010 (onset of melting period in the streams) to 16 April 2011 when streams were frozen. It should be noted that the period of meltwater stream discharge (124 days) is shorter than the period of total glacial flow (183 days) including the discharge of subglacial water coming directly from below the tidewater glacier, which was used for sediment trap calculation. Moreover, days with low discharge volume in December and April are neglected as minor contributions to total discharge volume, so that only a period of 90 days is used as a basis for calculation. Extrapolation of the measured water discharge for the glacial proximal streams MWS-2 and 4 to 90 days of discharge results in a total discharge of 11 hm3. Considering a water runoff volume as mentioned above and an average SPM concentration of 0.27 kg m-3, an approximate SPM runoff of 3x10³ t is calculated for the major meltwater stream system of Potter Peninsula during the 2010/11 summer (see Appendix II Table S3 found at http://dx.doi.org/10.1017/S095410201600064X).
In summary, following the different approaches, total SPM input into Potter Cove is estimated to be 23–39x103 t yr-1. Considering a surficial SPM flux of 3x10³ t yr-1 the SPM input from subglacial areas into Potter Cove is c. 20–36x103 t yr-1. In a very conservative approach the lowest estimate of the total SPM input (23x103 t yr-1) is used for further budget calculations.
Geochemical characterization of particulate matter from Potter Peninsula (terrestrial surface runoff and transport via meltwater streams), as well as from Potter Cove surface sediments
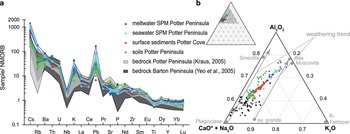
To draw conclusions about the potential of the different sources (i.e. meltwater stream and sea surface water, marine surface sediments and terrestrial soils) that provide potentially bioavailable particulate iron to the coastal Southern Ocean, major and trace elements in all four particle reservoirs were analysed and data are shown in Appendix I Table S1. All samples show the typical element distribution pattern for oceanic island arc basalts (Fig. 8a). Further, trace metal abundances of all samples plot into the wide range of bedrock found in the catchment area (Fig. 8a). All Potter Peninsula soil samples were relatively enriched in large ion lithophile elements (LILE) including Cs, Rb, Ba, U, K, Pb, Sr and light rare earth elements (LREE; i.e. La, Ce; Fig. 8b). High field strength elements (HFSE), such as Zr, Ti, Y and Nb, are depleted relative to normalized ocean ridge basalts (Fig. 8a). Despite the generally similar trends in elemental composition, some differences are visible between the sediment reservoirs (meltwater SPM, seawater SPM and soils).
Spider diagram normalized to NMORB, the shaded area highlights the variability of the bedrock. The bedrock data are from Kraus (Reference Kraus2005) and Yeo et al. (Reference Yeo, Lee, Hur and Choi2004). b. Triangle plot for clay (Al2O3), plagioclase (CaO*, carbonate corrected silicate fraction + Na2O, sea salt corrected silicate fraction) and the K-feldspar (K2O) fractions showing important minerals and weathering trends after Nesbitt & Young (Reference Nesbitt and Young1984).

Of all elements measured, Al2O3 showed the highest variability (see Appendix I Table S1), with 16.4–22.8 wt.% in SPM samples from the different reservoirs (Fig. 8b) and 15.2–18.2 wt.% in soils and sediments. Higher Al2O3 content in newly eroded areas indicate chemical weathering of material and/or higher clay content in soils and sediments. This is also supported by the degree of chemical weathering with CIA values increasing slightly from soils and sediments (c. 50) to SPM samples in meltwater stream and surface waters (c. 60, for raw data see Appendix I Table S1). In line with the Al2O3 data, SPM samples from the meltwater streams showed the highest variability in their CIA values (50–69).
Estimation of the amount of potentially bioavailable iron (FeA)
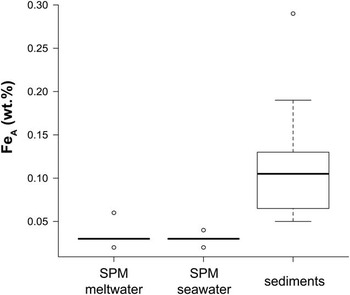
Samples from all particle reservoirs were compared with respect to their content of potentially bioavailable iron, measured here as the ascorbate leachable fraction (FeA, see ‘Sample preparations and geochemical analyses’). Our analyses in Potter Cove revealed low FeA fractions in the different sediment reservoirs of 0.5–1% of total sedimentary iron. Specifically, the FeA content of meltwater and seawater SPM (average 0.03 wt.%) was significantly lower than FeA concentrations in surface sediments (average over entire core depths: 0.11 wt.%; Fig. 9 and see Appendix I Table S1).
Boxplot of FeA concentrations in suspended particulate matter (SPM) of meltwater (n=10), seawater (n=5) and in sediments (n=20). Boxes represent the 50th percentiles and bars the 95th percentiles, open circles highlight outliers.

Discussion
Factors determining suspended particulate matter discharge in Potter Cove (present and recent past)
Subglacial water flow is the result of a combination of elevated air temperature, precipitation events, basal melting and surface ablation (Eraso & Dominguez Reference Eraso and Dominguez2007, Rückamp et al. Reference Rückamp, Braun, Suckro and Blindow2011). The SPM concentration in subglacial meltwater coming directly from underneath the glacier’s tidewater front was found to vary seasonally (summer vs winter) and annually. The highest SPM concentrations were recorded in streams passing through snow-covered areas transporting glacial runoff (Varela Reference Varela1998). MWS-1 is an outflow directly beneath the glacier edge, MWS-2 flows from the glacier edge several hundred metres over a rocky catchment area, whereas MWS-4 collects water from various smaller tributary creeks crossing supra-permafrost areas (Ermolin & Silva Busso Reference Ermolin and Silva Busso2008). MWS-5 with its generally lower SPM loads is slightly different in its hydrogeological settings because it is mostly fed by snow melt and lacustrine discharge (Varela Reference Varela1998). Discharge volume and SPM content are influenced by meltwater pressure, conduit migration and glacier sliding velocities, as well as by mixing events at the glacier bed or in the subglacial drainage system (Hodson & Ferguson Reference Hodson and Ferguson1999). Peak flushes of SPM in the Potter Peninsula river system roughly correlate with major precipitation events (peaks of the red curve in Fig. 4), whereas the sub-seasonal variability (increase in February/March; Fig. 2) reflects increased glacier ablation (A. Eraso & C. Dominguez, personal communication 2013). Increased particle loads in summer meltwater also reflect subglacial flow activity in the talic (the active permafrost layer). Like glacier ice, the talic warms during summer time (Ermolin & Silva Busso Reference Ermolin and Silva Busso2008) and releases major amounts of SPM in late summer. Particle concentrations in meltwater decrease when erosional material (produced mostly during winter freezing) is exhausted, and small particles have been washed out by earlier summer discharge waves (Hodson & Ferguson Reference Hodson and Ferguson1999 and references therein), or when low summer air temperatures interrupt subglacial melting (January 2011; Fig. 4). The extremely low SPM discharge rate (average 15 mg l-1) in January–March 2010 can be explained by anomalously cold climate conditions during an El Niño–Southern Oscillation (ENSO) event (Schloss et al. Reference Schloss, Wasilowska, Dumont, Almandoz, Hernando, Michaud-Tremblay, Saravia, Rzepecki, Monien, Monien, Kopczynska, Bers and Ferreyra2014), which caused low discharge volumes and reduced particle outwash at the beginning of summer.
In addition to the controlling factors mentioned above, which are based on short-term variation, interannual or decadal time scales, SPM runoff from Potter Peninsula could be affected by the location of meltwater streams and the retreat of the glacier front. In particular, the distance of the meltwater streams to the glacier front may have a direct influence on its SPM concentration (Figs 1c & 2). Close to the glacier front (MWS-1) the SPM concentrations are lower than at mid-peninsula locations, whereas at large glacial distance the lowest concentrations occur. Newly ice-free sites contain a higher proportion of fine-grained material (MWS-1) than sites where washout of SPM has been occurring for decades (MWS-5).
This variability can be tracked back in time using the results of the 210Pb dating of Potter Cove sediment cores. Sediment mass accumulation rates reveal a significant increase since 1940 in the central inner cove (P03; Figs 1 & 7), consistent with a massive glacier retreat and the uplift of the grounded glacier front described by Rückamp et al. (Reference Rückamp, Braun, Suckro and Blindow2011), and the general warming trend at the Antarctic Peninsula (Steig et al. Reference Steig, Schneider, Rutherford, Mann, Comiso and Shindell2009). According to Rückamp et al. (Reference Rückamp, Braun, Suckro and Blindow2011) the glacier front was situated south of the P03 sediment core location in 1930 and the increase in SAR (all cores) c. 1940 may indicate the change from a grounded glacier to a tidewater glacier with increased ablation activity. This finding is consistent with increased particle washout on Potter and Barton peninsulas during the 1980s and 1990s due to expansion of the ice-free areas (Monien et al. Reference Monien, Schnetger, Brumsack, Hass and Kuhn2011, Rückamp et al. Reference Rückamp, Braun, Suckro and Blindow2011). Majewski et al. (Reference Majewski, Wellner, Szczuciński and Anderson2012) reported a similar scenario for sediments from Collins Harbour, a bay c. 10 km north-west of Potter Cove, where sedimentation rates also peaked in the early 1980s. The earlier decrease in SAR in sediment core P03 c. 1995 might be related to its mid-cove location, where bathymetry is changing from deeper troughs to shallower areas on the south-eastern side of the cove (Wölfl et al. Reference Wölfl, Lim, Hass, Lindhorst, Tosonotto, Lettmann, Kuhn, Wolff and Abele2014). It appears that there has been less SPM from meltwater creek transport settling in this region since 1995, possibly due to the predominantly clockwise currents in Potter Cove (Roese & Drabble Reference Roese and Drabble1998).
The total SPM flux into coastal waters was estimated based on recent and past variability in the discharge of SPM derived from surface runoff and subglacial input. Abrasion rates, which are calculated based on our data with typical values found for comparable settings in polar regions, were compared to validate our results. If a subglacial input of 20–36x103 t yr-1 and an average density of this material of 2.7 g cm-3 (Monien et al. Reference Monien, Schnetger, Brumsack, Hass and Kuhn2011) is assumed, this would result in an abrasion rate of c. 5–8 mm yr-1 in the Fourcade Glacier catchment area (12 km2, after Kim et al. Reference Kim, Lee, Hong, Hong, Jin and Shon2010). These numbers are in agreement with the glacial abrasion rates of 0.1–100 mm yr-1 for temperate glaciers in the Northern Hemisphere found by Hallet et al. (Reference Hallet, Hunter and Bogen1996).
Suspended particulate matter composition: an effect of glacial washout
The composition of the SPM originating from Potter Peninsula and accumulating in Potter Cove (Fig. 8a) reflects the geochemistry of the basaltic to andesitic basement interbedded with lapilli stones and sediments (Monien et al. Reference Monien, Schnetger, Brumsack, Hass and Kuhn2011 and references therein). The distinct Nb trough of the samples is characteristic for rocks crystallized from subduction zone magmas (Monien et al. Reference Monien, Schnetger, Brumsack, Hass and Kuhn2011). Figure 8a indicates that weathering processes in this environment do not affect most of these elements and that primary distribution patterns are preserved.
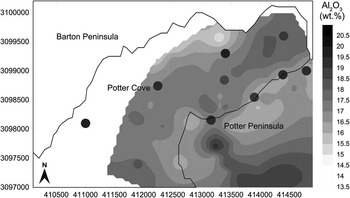
Mapping of the Al2O3 content in SPM (Fig. 10) shows increased clay deposition close to the glacier front and around the catchment area of MWS-5, probably due to subglacial flow in Potter Cove or accumulation in troughs on Potter Peninsula. In contrast, the other areas on Potter Peninsula represent moraines where clays have been washed out. The turbidity patterns (Fig. 5) support this glacial outflow scenario. We hypothesize that a massive discharge of subglacial water, loaded with very high particle concentrations, wells up at a distance in front of the glacier and the fine-grained fraction is exported as surface flow. Granulometric analyses of Potter Cove surface sediments (Wölfl et al. Reference Wölfl, Lim, Hass, Lindhorst, Tosonotto, Lettmann, Kuhn, Wolff and Abele2014) documented the existence of fine-grained deposits in the inner cove. An accumulation of subglacially introduced particles in the inner cove is further supported by wind-driven vertical circulation patterns leading to up- and down-welling in this area (Roese & Drabble Reference Roese and Drabble1998).
Distribution map of Al2O3 content in Potter Peninsula soils and Potter Cove sediments. Dots indicate suspended particulate matter concentrations in surface waters of Potter Cove and in meltwater streams on Potter Peninsula. The interpolation was cut off outside the data frame.

Suspended particulate matter at Potter Cove: deposition and export
Surface distribution patterns of SPM (Fig. 5) can be related to the position of the glacier front and the current regime in Potter Cove (Roese & Drabble Reference Roese and Drabble1998). The Al2O3 distribution plots indicate accumulation of clay-rich sediments in the central part of Potter Cove (Fig. 10), which is consistent with the grain size patterns found by Wölfl et al. (Reference Wölfl, Lim, Hass, Lindhorst, Tosonotto, Lettmann, Kuhn, Wolff and Abele2014). Geochemical distribution patterns, CTD profiles (Fig. 5) and sediment trap data (Fig. 6) indicate that large proportions of clay material (Fig. 8b) remain floating in the water column. During events with high SPM input into the cove, significant fractions (≥15% and ≤50%) of the SPM released from meltwater streams remain in the upper water column (Figs 5b & 6). This particle discharge from Potter Peninsula is visible at the south-eastern shoreline (Fig. 5) as a low-density surface plume (salinity profiles not shown, as the pattern is the same as for turbidity). The SPM is partly exported through the south-eastern outlet (Fig. 5) to the outer cove and to Maxwell Bay, and partly further east to Bransfield Strait as indicated by satellite images (Vogt & Braun Reference Vogt and Braun2004).
Is suspended particulate matter a significant source fertilizing the coastal Southern Ocean with dissolved iron?
It has been suggested that SPM is enriched with FeA, and is thus a potential agent for fertilizing the coastal regions of the Southern Ocean (Ardelan et al. Reference Ardelan, Holm-Hansen, Hewes, Reiss, Silva, Dulaiova, Steinnes and Sakshaug2010). Few studies have so far attempted to quantify SPM concentrations in waters around King George Island (e.g. Pecherzewski Reference Pecherzewski1980, Schloss et al. Reference Schloss, Ferreyra, Mercuri and Kowalke1999) with SPM estimates of 0.5–183 mg l-1. However, to date there are no estimates on how much SPM is exported from the South Shetland archipelago into the surrounding coastal areas of the Southern Ocean.
Our estimate is based on the surface meltwater stream and subglacial input of the coastal inlet of Potter Cove (see Appendix II Table S3). Calculations are based on the minimum FeA values from meltwater stream sediments (see Appendix II Table S3). Potter Cove sediments reveal higher FeA concentrations because they are characterized by suboxic conditions favouring iron reduction and subsequent dissolution of iron (Monien et al. Reference Monien, Lettmann, Monien, Asendorf, Wölfl, Lim, Thal, Schnetger and Brumsack2014). The extrapolation to the whole area of the SSI can be considered as a minimum discharge since it was based on the minimum export rate of our estimations of 15% (see ‘Sediment trap data’ and Appendix II Tables S4 & S5). Based on these assumptions the total SPM input to the coastal areas of the Southern Ocean area around the SSI (2.5x10⁴ km2) is estimated to be 4x10⁴ mg m-2 yr-1 (for equations see Appendix II found at http://dx.doi.org/10.1017/S095410201600064X). Other sediment sources are aeolian dust and particles from icebergs. Dust flux estimations in the Southern Hemisphere reaching the polar region vary between 1 mg m-2 yr-1 (Jickells et al. Reference Jickells, An, Andersen, Baker, Bergametti, Brooks, Cao, Boyd, Duce, Hunter, Kawahata, Kubilay, LaRoche, Liss, Mahowald, Prospero, Ridgwell, Tegen and Torres2005) and 150 mg m-2 yr-1 (Lefévre & Watson Reference Lefévre and Watson1999) with the most recent estimation for total particle input into the Southern Ocean via aeolian transport of 19 mg m-2 yr-1 (Wagener et al. Reference Wagener, Guieu, Losno, Bonnet and Mahowald2008). However, in the vicinity of ice-free islands this flux may be significantly higher. For the total SPM from melting icebergs, a particle flux to the Southern Ocean (20x106 km2) of 4.8x10³ mg m-2 yr-1 was estimated (Shaw et al. Reference Shaw, Raiswell, Hexel, Vu, Moore, Dudgeon and Smith2011). This comparison shows that the contribution of sediment material via surface meltwater and subglacial transport from SSI coastal environments to the coastal Southern Ocean may represent a quantitatively important fraction. A study from the Amundsen Sea provides evidence that suggest that labile iron concentrations increase in the vicinity of melting ice on the Antarctic shelves leading to higher bioproductivity (Planquette et al. Reference Planquette, Sherrell, Stammerjohn and Field2013).
Based on our iron leaching data it is possible to estimate the input of potentially bioavailable iron into the coastal waters around the SSI. If we consider that every year the archipelago discharges 6.7x10⁶ t of SPM with an export rate of 15% and an average FeA fraction of 0.03% into the surrounding coastal waters (2.5x10⁴ km2), the SSI would contribute c. 12 mg m-2 yr-1 of FeA to this area. This input is in the same order of magnitude as the input of FeA via icebergs (20 mg m-2 yr-1; Shaw et al. Reference Shaw, Raiswell, Hexel, Vu, Moore, Dudgeon and Smith2011) and the flux of potentially bioavailable iron from shelf sediments in the WAP region (0.35–39.5 mg m-2 yr-1, Monien et al. Reference Monien, Lettmann, Monien, Asendorf, Wölfl, Lim, Thal, Schnetger and Brumsack2014). Compared to the maximum FeA from aeolian input, which is estimated to be 0.05–0.25 mg m-2 yr-1 (Shaw et al. Reference Shaw, Raiswell, Hexel, Vu, Moore, Dudgeon and Smith2011), the input of FeA via SPM in the vicinity of the islands is c. 50–240-fold higher.
Nevertheless, in the close vicinity of the SSI, the export of high loads of sediment carrying significant amounts of potentially bioavailable iron seems to have little effect on the local primary production. Generally, chl a concentrations are quite low, peaking at c. 1 mg m-3 at the northern WAP (King George Island), probably due to the shading effect of turbid and SPM-loaded waters (Schloss et al. Reference Schloss, Wasilowska, Dumont, Almandoz, Hernando, Michaud-Tremblay, Saravia, Rzepecki, Monien, Monien, Kopczynska, Bers and Ferreyra2014). An exception was in 2010, when physical conditions (anomalously low air temperatures and dominant wind from the eastern sector favouring stratification) allowed for the establishment of a bloom event with up to 20 mg m-3 chl a (Schloss et al. Reference Schloss, Wasilowska, Dumont, Almandoz, Hernando, Michaud-Tremblay, Saravia, Rzepecki, Monien, Monien, Kopczynska, Bers and Ferreyra2014). It is assumed that during that Antarctic summer high loads of iron supported the extreme phytoplankton bloom, enabled by the prevailing physical conditions. Further north, Ardelan et al. (Reference Ardelan, Holm-Hansen, Hewes, Reiss, Silva, Dulaiova, Steinnes and Sakshaug2010) found high chl a concentrations offshore of the SSIs and in the Scotia Sea (up to 5 mg m-3). The authors speculated on the ‘island effect’ leading to elevated SPM and iron. This effect was also shown by Blain et al. (Reference Blain, Tréguer, Belviso, Bucciarelli, Denis, Desabre, Fiala, Jezequel, Le Fevre, Mayzaud, Marty and Razouls2001), who found very high concentrations of dissolved iron (>10 nM) in downstream waters close to the Iles Kerguelen and the surrounding Kerguelen Plateau.
Although icebergs and islands discharge their suspended loads discontinuously and irregularly in space, SPM discharge has been assessed here as an important source for FeA in the coastal Southern Ocean. It seems that relatively high concentrations of chl a and increased values of dissolved iron in the water column (Ardelan et al. Reference Ardelan, Holm-Hansen, Hewes, Reiss, Silva, Dulaiova, Steinnes and Sakshaug2010) could be connected to SPM sources at the shelf areas and islands in the Antarctic region. In contrast, recent findings in the Arctic region around Greenland reveal that the flux of iron-rich meltwater has no effect on the iron enrichment of the offshore water body (Hopwood et al. Reference Hopwood, Bacon, Arendt, Connelly and Statham2015). This might be because the Arctic Ocean does not exhibit widespread low iron or high-nutrient low-chlorophyll (HNLC) conditions, whereas the Southern Ocean has the largest HNLC regions in the world (Jickells et al. Reference Jickells, An, Andersen, Baker, Bergametti, Brooks, Cao, Boyd, Duce, Hunter, Kawahata, Kubilay, LaRoche, Liss, Mahowald, Prospero, Ridgwell, Tegen and Torres2005). Therefore, the effect of local sedimentary iron sources on primary production is potentially much greater around Antarctica. In the near future, we expect glacial sediment to become an even more important source of iron as glacier melt and the incidence of wet-based glaciers with increased glacial flow (Rignot et al. Reference Rignot, Bamber, van den Broeke, Davis, Li, van de Berg and van Meijgaard2008) and sediment flux increases.
Conclusions
Sources, sinks and export of SPM and the associated potentially bioavailable iron discharge were studied in an Antarctic inlet on King George Island. There is no evidence that seasonal variations in SPM loads are linked to subglacial flow, but rather to snow melt. On multi-annual timescales discharge volumes follow the general climate regime, with low loads during cold ENSO years.
Increased sedimentation has occurred concurrently with the onset of glacial retreat in Potter Cove and has increased rapidly since the 1940s. This increase is most probably related to the transition of the ice sheet in Potter Cove from grounded to tidewater. Of the total SPM representing coarser grain sizes (>16 µm), c. 85% is deposited in Potter Cove. The residual 15% of the SPM, representing the clayey outwash of Potter Peninsula moraines and the fine-grained subglacial material, remains in the water column. Particles exported to the coastal ocean contain a significant fraction of potentially bioavailable iron. This source might be more important for the supply of dissolved iron to the coastal waters of the Southern Ocean than aeolian dust, and similar to that released from icebergs. It is assumed that with a continued rise in local air temperature the flux of eroded iron-rich particles from newly ice-free areas into the water column will further increase. Consequently, (sub-)glacially derived SPM may gain even more importance as a source of bioavailable iron for the Southern Ocean in the future.
Acknowledgements
This study is part of IMCONet programme (EU FP7-PEOPLE-2012-IRSES). This particular project was funded by the German Federal Ministry of Education and Research (BMBF, ref. no. 03F0617C) and the German Research Foundation (DFG project no. BR 775/25-1). The authors wish to thank the staff of Carlini Station (former Jubany, CAV 2009/10, 2010/11, 2011/2012) and particularly the divers of the Prefectura Naval Argentina for recovery of sediment cores and sediment traps. Many thanks to Anne-Catrin Wölfl and Nina Wittenberg from the Alfred-Wegener Institute (Sylt, Germany) who provided additional material of surface sediment samples. We appreciate the support of technicians and students of the microbiogeochemistry group at ICBM, Oldenburg University, and Sanja Asendorf and Jöran März, in particular, for their help in the field. Finally, we thank Doris Abele and Ulrike Falk for their valuable comments on this manuscript. The authors also thank two anonymous reviewers for their valuable comments.
Author contribution
DM developed the general concept of this study, co-ordinated and undertook the sampling of SPM, CTD measurements and wrote and prepared the manuscript. PM was responsible for the sampling and geochemical analyses of sediments and soils, performed the 210Pb analyses, established the age model and wrote the corresponding sections. RB performed the iron leaching experiments. TW investigated the chemical composition of the SPM samples. AK analysed the sediment core samples for REEs. ASB was head of the investigation of water discharge and modelled the total summer discharge volume. BS supported the laboratory analysis, mineralogical data interpretation and co-ordinated the project. HJB applied for the funding of this study and co-ordinated the project. PM, BS, HJB further helped with data discussion and preparation of the manuscript.
Supplemental material
Supplementary tables and equations in two appendices will be found at http://dx.doi.org/10.1017/S095410201600064X.