The number of slaves carried off from Africa to the Americas increased fivefold between 1630 and 1770, the point at which the transatlantic slave traffic reached its all time high. During this time, slaves went from less than half the transatlantic movement of people to over 80 percent, a dramatic shift that made the subtropical plantation Americas the high-income core of the New World. Historians and economists have filled out the picture of the demand side of the expanding slave market quite well. Although the growth in European income and population was modest, there was a dramatic increase in the consumption of sugar, by far the most important plantation crop. That, combined with secular improvements in the productivity of plantation agriculture, contributed to a major expansion of the slave economy in the Americas.
The supply side of the transatlantic market for slaves, and in particular its cost structure, has received much less attention than the demand side. There has, however, been a vigorous debate on the profitability of the slave trade with the more recent literature suggesting that excess profits were unlikely because of competition, at least in the long run. And work on some eighteenth-century accounts supports the findings for the earlier period that firms involved in the slave trade were doing little more than covering their costs. The tight profit margins suggest that transport costs were central to the prices of slaves on both sides of the Atlantic and the number of people transported.Footnote 1
This article itemizes the factors that contributed to the cost of transporting enslaved Africans, and measures the contribution of each to the difference between the price of slaves in the Americas and on the African coast. We analyze 22 voyages that originated in London between 1683 and 1685, combining the Transatlantic Slave Trade Database with the manuscript records of the Royal African Company (RAC) to produce a nearly complete picture of the various costs of each voyage. Three types of Royal African Company records are central to our estimates: the invoices of goods for purchasing Negroes in Africa, the accounts of the slave auctions in the Caribbean, and the company's Copy Book of Accounts. The RAC conducted much of its trade during this period with hired ships, and the accounts detail the various payments made to the owners of the ships and the ship captains. Also reported are the company's other expenses, the earnings from the trade in gold and ivory, and the income from the transport of sugar.Footnote 2
The Royal African Company Voyage Accounts: An Illustration
There was little variation in the cost structure of the voyages. To illustrate the nature of the costs, we begin by outlining the accounts of a voyage by the 150-ton Bonadventure, which sailed from London on April 21, 1683. On board were goods valued at £1,306 (sterling) for the purchase of gold on the Windward Coast of Africa, £710 worth of supplies for Cape Coast Castle on the Gold Coast, and £1,235 for the purchase of 320 Negroes at Ardra on the Slave Coast in the Bight of Benin.
The Bonadventure arrived in Barbados on January 16, 1684. Sixty-four Africans did not survive the middle passage and another seven died shortly after arrival. Of the remaining 249, the RAC sold 184 on its own account, the shipowners received 56, and the ship's captain was paid 9 slaves. On the ship's return to London, the RAC settled the account with the owners, crediting them with having delivered 256 slaves.Footnote 3 At a rate of £5 per slave, the total due the owners was £1,280 from which the RAC deducted the value of the 56 slaves the shipowners had already received as payment. These slaves, who had been sold in Barbados on the shipowners’ account, were each valued at £15 or £840 in total, so the amount still owing was £440. As was typical of these voyages, the shipowners supplemented their income by participating in the gold trade. The value of the gold that had been purchased in Africa was £1,680. The shipowners had contributed £350 of the £1,306 cargo traded for gold, and they received a corresponding share of the return, or £450. There were in addition some small payments and adjustments.Footnote 4
The returns from these voyages depended mainly on the receipts from the Caribbean slave auctions. The results from the Bonadventure's slave auction, which took place in January 1684, are presented in Table 1. Men, women, boys, and girls were sold mainly in small groups, and given the detail of the accounts, it is possible to compute a price for each category. For example, in the second sale listed, eight men and two women sold for £180 (Barbados currency), with payment due in seven months. Applying an annual discount rate of 20 percent and weighting women as 90 percent of the value of male slaves, an average price of £16.51 for the men and £14.86 for the women is derived. David Galenson found that slave prices tended to fall in the sales listed lower in the account. Although that was not generally true of the Bonadventure auction, the prices of slaves in the last three sales were indeed exceptionally low. These slaves, who were auctioned in large lots, sold for less than half the average price of the slaves listed higher in the account. The Africans in these lots were likely sick.Footnote 5
SLAVE SALE ACCOUNT OF THE BONADVENTURE: BARBADOS, JANUARY 22, 1684

a Months to payment.
b Barbados currency (.9 sterling).
c Died after arrival.
Sources:
BNA, Treasury Papers, T70/913 and T70/963–966; and McCusker, Money and Exchange, p. 240.
There are other explanations for the much lower prices of certain slaves, including differences in their quality upon leaving Africa and a discount for bulk sales, but the historical record shows that throughout the slave trade era, morbidity, sometimes from disease, sometimes from deprivation on the voyage, was by far the most common explanation. The company's agents in Barbados at this time pointed to a specialized group of “constant customars & Buyers [at low prices] of Poore sickly & refuse negroes—by which they have many times greate Losses.” These were not planters but speculators who would later sell the survivors to planters. In 1707 the Virginia agent wrote to the company of “small pox [which] though he [the captain of the Bridgewater] concealed … as much as possible, was very prejudicial to their sale.”Footnote 6
Both the shipowners and the captain received most of their payment in slaves. The captain's commission was five men, three women, and one girl; and the shipowners received 25 men, 27 women, and four boys. On the 184 slaves sold on its own account, the Royal African Company reported proceeds of £2,492 (Barbados currency).Footnote 7
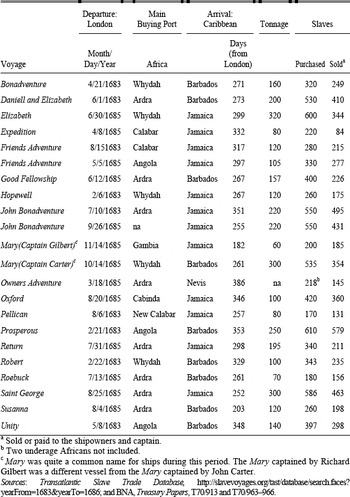
The 1683 voyage of the Bonadventure is one in our sample of 22 voyages (see Table 2). The time between a ship's departure from London and its arrival in the Caribbean averaged just over nine and a half months, and ranged from the 182-day voyage of the Mary to Jamaica, to the 386 days it took the Owners Adventure to reach Nevis.Footnote 8 Based on when the final accounts were recorded, it appears that ships reached London about six months after their arrival in the Caribbean. Thus, depending on the African port of embarkation, the entire voyage took between 15 and 17 months.
ROYAL AFRICAN COMPANY VOYAGES WITH HIRED SHIPS: LONDON DEPARTURE, 1683 AND 1685

a Sold or paid to the shipowners and captain.
b Two underage Africans not included.
c Mary was quite a common name for ships during this period. The Mary captained by Richard Gilbert was a different vessel from the Mary captained by John Carter.
Sources:
Transatlantic Slave Trade Database, http://slavevoyages.org/tast/database/search.faces?yearFrom=1683&yearTo=1686; and BNA, Treasury Papers, T70/913 and T70/963–966.
The size of the ships varied from 60 tons to 320 tons. Although larger vessels tended to take on and deliver more slaves, beyond 200 tons there were sharply diminishing returns. As ship size increased from 60 tons to 200 tons, the numbers of slaves increased from about 200 to 550; but beyond 200 tons, there was little difference in the numbers boarded.
Mortality on these voyages was much higher than the rates typical of the later slave trade. A comparison of the number of Africans purchased and the number ultimately sold in the Caribbean shows that mortality averaged 25 percent (see Table 2), with more than 90 percent of deaths occurring prior to arrival in the Caribbean. There was, moreover, wide variation. Mortality ranged from a low of 5 percent on the 300-ton Prosperous to more than 60 percent on the 80-ton Expedition, possibly the result of a slave insurrection. Consistent with the literature, there was no relation between mortality and either the size of vessel or the number of slaves boarded.Footnote 9
Decomposing the Total Transport Cost
The gap between slave prices in the West Indies and on the African coast can be explained by three main factors: mortality and morbidity on the middle passage, the costs of transporting and selling the slaves, and the offsetting income from the trade in gold, ivory, sugar, and other freight. On voyages where the Royal African Company hired the ship, transport costs for each voyage were borne by the owners of the ship, the ship's captain, and the RAC. In addition, the Royal African Company had to cover the costs of maintaining the infrastructure of forts and trading establishments in the Gambia River, Bunce Island, Sherbro, and, most of all, the Gold Coast. There was as well the cost of its operations in London and the West Indies. The net revenue from the gold, ivory, sugar, and other freight helped offset these and other costs of transporting the Africans.Footnote 10
The price of slaves in the West Indies adjusted for mortality and morbidity equaled their price in Africa plus net transport costs per slave, which were gross transport costs less the revenue received by the RAC and shipowners from sources other than the slave sales. Although, on average, competition likely drove profits close to zero, the RAC would certainly have earned above normal profits on some voyages and suffered losses on others. We allow for excess profits (both positive and negative) by including them in one of the components of our cost calculation. Decomposing the costs and revenues by category, the relation can be expressed as

where PI is the price of healthy slaves in the West Indies, d is the mortality rate, and m is the effect on price of morbidity.Footnote 11 The terms on the right-hand side of equation 1 include the price of slaves in Africa, PA, and the various transport costs per slave. The costs to the shipowner and captain are cS and cC. The costs to the RAC are divided between those that can be specifically attributed to a voyage,  and the other costs,
 such as maintaining the forts. We cannot observe the fort maintenance and other costs, directly; therefore, we derive them as a residual, which means they include any excess profits (or losses) that the company earned on a particular voyage. Finally, rR and rS are the RAC's, shipowners’ revenue per slave from gold, ivory, and freight.
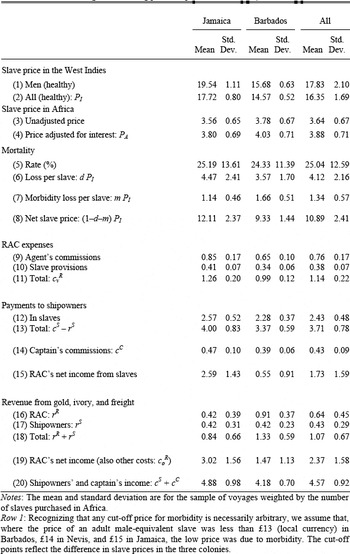
Following equation 1, Table 3 gives the means and standard deviations across voyages of the price of slaves in Africa, their price in the West Indies and the various components that contributed to the differential. The average price of healthy male adult slaves in the Caribbean was £17.83 sterling, with prices in Jamaica averaging £3.8 higher than those in Barbados (row 1). For a given destination, there was little variation across voyages in the average slave price. The standard deviation was just £1.1 for Jamaica and £0.6 for Barbados. The average selling price of all healthy slaves was £17.72 in Jamaica, £14.57 in Barbados, and £16.35 for all the voyages (row 2).Footnote 12 These prices can be compared to the RAC's cost of purchasing the slaves (row 3). The African price is based on the value of the cargo that the company designated for the purchase of slaves and the number of Africans who were boarded on the ship. Entirely consistent with a competitive market, the Royal African Company paid almost the same price for slaves whether they were sold in Jamaica or Barbados, £3.56 as compared to £3.78, even though the company received much higher prices in Jamaica.Footnote 13
SLAVE PRICES AND TRANSPORT COSTS, 1683–1685 (pounds sterling per slave purchased in Africa)

Notes:
The mean and standard deviation are for the sample of voyages weighted by the number of slaves purchased in Africa.
Row 1:
Recognizing that any cut-off price for morbidity is necessarily arbitrary, we assume that, where the price of an adult male-equivalent slave was less than £13 (local currency) in Barbados, £14 in Nevis, and £15 in Jamaica, the low price was due to morbidity. The cut-off points reflect the difference in slave prices in the three colonies.
Row 2:
The weights used in deriving the average price are women – 0.9, boys – 0.75, and girls – 0.7. See the text and note 5.
Row 3:
Based on the cargo sent by the RAC to purchase slaves.
Row 4:
The adjustment is based on an annual interest rate of 5 percent for a period of 16 months.
Row 5:
Mortality on the voyage and after arrival but before the slave auction.
Row 6:
The mortality loss per slave is the mortality rate times the price of healthy slaves, where the calculations are by age and gender. We do not know mortality rates by age and gender during the voyage, and these are assumed the same. So the results differ from the product of rows 2 and 3 only to the extent that mortality rates after arrival (but before the sale) differed.
Row 7:
The total morbidity cost is the difference between the returns from all slaves deemed to be “sick;” that is, falling below the cut-off price for morbidity, and the returns that would have been received had they commanded the average price of healthy slaves. This total is divided by the number of slaves leaving Africa.
Row 8:
Rows 2 – (6 + 7).
Row 9:
The selling agents’ commissions are put at 7 percent of the slave price. The commission is also applied to slaves sold on the accounts of the shipowners and captains.
Row 10:
The cost of “negro provisions” taken on board in London for the middle passage averaged £0.21. To this cost has been added additional expenses incurred in the Caribbean associated with selling the slaves. In a few cases, where a payment to a factor is reported, it is included. The imputed interest on these costs—5 percent annual interest rate for 16 months—has been added.
Row 12:
Based on the slaves the shipowners received and the average price of healthy slaves for the voyage. Note that the 7 percent agent's commission is deducted from the price.
Row 13:
The earnings from the slave sales plus the payments received from the RAC after the ship returned to London. These payments were the difference between the shipowners’ credit for all negroes delivered to the Caribbean (including those who died before the sale), and the valuation of the slaves the shipowners received in commissions. The amount credited was £5 per slave for Barbados and the Leeward Islands and £5.33 for Jamaica. The slaves paid as commissions were valued in the accounts at £15, £16, and £17 for Barbados, the Leewards, and Jamaica, respectively. There were small adjustments both positive and negative for expenses incurred by the ship or the RAC; although where a ship violated the charter, the (negative) adjustment could be significant. Assuming the shipowners were earning normal profits the amount paid by the RAC to the shipowners was less than the shipowners’ costs since they also received revenue from the related trade, shown in row 17. Thus row 13 can be interpreted as the owners’ cost, cS, less their earnings from gold, ivory, and freight, rS.
Row 14:
Seven percent is deducted for the selling agent's commission.
Row 15:
Rows 8 – (4 + 11 + 13 + 14).
Row 16:
The revenue from gold and ivory less the cost of the cargo including the imputed interest on the cargo.
Row 17:
The earnings from gold and ivory plus the payments the shipowners received from the RAC for carrying freight, mainly sugar.
Row 19:
Derived as the residual, rows: 6 +16 – (9+11+12+14). Assuming the RAC earned normal profits over this sample of voyages, this residual represents, coR, the cost per slave over the rest of its operation.
Row 20:
Note that the shipowners’ total cost, cS (also total earnings if normal profits are assumed), is rows 13+17.
Sources:
BNA, Treasury Papers, T70/913 and T70/963–966; Davies, Royal African Company; and the text.
The Africans were purchased with a cargo that was loaded on the ship when it left London, but the Royal African Company did not receive any income until the ship returned to England, about 16 months later. An additional cost then was the foregone interest on the value of the cargo. Assuming a discount rate of 5 percent, the true cost of the slaves was 6.7 percent above their purchase price. The addition of foregone interest raises the average cost of slaves to the RAC to £3.88 from £3.64 (row 4).Footnote 14
The Sources of the Price Differentials
Losses from mortality and morbidity contributed to more than 40 percent of the price difference between slaves in Africa and healthy slaves in the Caribbean. The average mortality rate of 25 percent (row 5) accounted for £4.47 per slave of the gap for Jamaica versus £3.57 for Barbados (row 6). Losses in Jamaica were higher due to the higher prices of slaves there. Slave morbidity accounted for an average of £1.34 sterling per slave transported (row 7).
The agent who conducted the slave auctions in the West Indies typically received a commission of 7 percent, which accounted for less than £1 of the price differential (row 9).Footnote 15 One of the smallest costs was the RAC's payment for Negro provisions on the middle passage. The cargo, which was boarded in London, included flour, beef, beans, biscuits, brandy, and tobacco. In addition, slave vessels obtained provisions in Africa appropriate to the diets of slaves from the region where they were purchased. Vessels trading in Upper Guinea purchased millet and rice; on the Gold Coast, millet; and in the Bight of Biafra, yams. In the West Indies, the Royal African Company also incurred the cost of such items as supplementary provisions and the hire of canoes to ferry the slaves to shore. Together the provisions and these other costs averaged £0.38 per slave (row 10).Footnote 16
The Royal African Company paid “freight” to the shipowners on all slaves delivered to the West Indies. The rate was £5 (sterling) per slave in Barbados and Nevis (Leeward Islands), and £5.4 (£5 8s 6d) per slave arriving in Jamaica. Payment was roughly two-thirds in slaves, who were sold on the shipowners’ account.Footnote 17 The prices of the slaves paid to the shipowners are reported only for the auction of the Expedition. We assume the owners received, on the other voyages, the average price of healthy slaves.Footnote 18 The Royal African Company paid to the shipowners, both in slaves and cash, an average of £3.71 per slave who left Africa, £4.00 on the Jamaican voyages, and £3.37 on the voyages to Barbados (row 13). For a given destination, the variation in returns (the standard deviation was about 20 percent of the mean) was due almost entirely to differential mortality on the voyages.
The ship's captain was also paid by the Royal African Company. His commission, received in slaves and reported for each auction, amounted to 5 percent of the number of slaves sold on the company's account, and averaged £0.43 per slave who left Africa (row 14). Because slave prices were higher in Jamaica than in Barbados, captains on the Jamaican voyages received 20 percent more in commissions.
The net return to the Royal African Company from the slave sales was its income from the sales less the company's payments to the shipowners and the captain, the cost of the slaves in Africa, and the other expensesdirectly associated with each voyage. Deducting these costs along with the sales agents’ commission, we derive the RAC's net return as averaging £1.73 per slave (row 15). The net return on the Jamaican voyages was £2.59, £2 more than on the voyages to Barbados.Footnote 19
Although earnings from the slave sales dominated aggregate revenue, income from other sources influenced the overall returns from the voyages. Most vessels stopped at forts along the Gold Coast to buy gold, there was a smaller trade in ivory, and there were earnings from carrying sugar and other freight from the West Indies to Britain. The return to the Royal African Company from the trade in gold and ivory averaged £0.64 per slave (row 16), with all but four voyages generating at least some revenue from these sources. This income may have been decisive to the viability of some voyages, especially those to Barbados, where the return from selling slaves was lower. On those voyages, the income from these complementary activities averaged £0.91 per slave, nearly tripling the RAC's net return. Indeed the impact of gold, ivory, and freight may have been even greater. On voyages that went through Barbados, the shipowners earned £0.42 (row 17). Had the RAC been forced to pay more to the shipowners in the absence of the extra trade, the company's net income would have fallen from £0.55 to £0.13. Another effect of the additional revenue was to reduce the gap in returns between the Jamaican and Barbados voyages. The Barbados ships carried more gold, and as a result the RAC's return was increased by £0.49 per slave more than on the Jamaican voyages (row 16).Footnote 20
The RAC's net return is calculated as a residual: the revenue from the slave sales and the trade in gold and ivory less all the costs directly associated with the voyages. The company's mean return was £2.37 per slave and highly variable, with a standard deviation of £1.58 (row 19). By contrast, the standard deviation of returns to the shipowners and captains was just 20 percent of the mean (row 20). Nevertheless, the overall risk to the Royal African Company would have been much less, since the company could diversify across voyages to a far greater degree than the shipowners or captains.Footnote 21
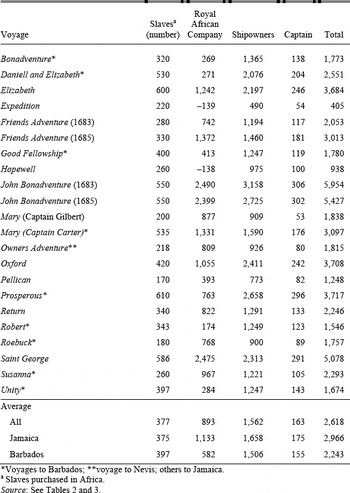
The total income of the Royal African Company, the shipowners, and the ship's captain is the net amount earned per slave times the number of slaves transported, which is shown in Table 4 for each voyage.

Because there was little relationship between mortality and number of Africans boarded, ships that took on more slaves tended to have proportionally greater returns.Footnote 22 The 1683 voyage of the John Bonadventure, a 220-ton vessel that took on 550 slaves, generated the most income, £5,954, of which the RAC received £2,490 and the shipowners, £3,158, an amount that far exceeded what they earned on any of the other voyages. The exceptional return was due to low mortality of 10 percent, the large number of Africans boarded, and unusually high income from gold and ivory. The Expedition, which experienced a slave revolt on the way to Jamaica and slave mortality of 62 percent, generated the lowest overall return, £405 sterling. The RAC lost £139 on that voyage. Losses were almost as great on the voyage of the Hopewell due to a high price paid in Africa, high mortality (33 percent), and no earnings from gold and ivory.
Across the sample, income averaged £2,618 with the Jamaican voyages generating more income than those to Barbados, £2,966 versus £2,243, a difference significant at the 5 percent level. The differential was due to the higher price of slaves in Jamaica and the fact that the greater revenue from the slave sales was only partially offset by lower returns from gold and ivory. The shipowners received by far the largest share of the income from the slave trade, 56 percent or £1,562; and, although they earned more from the voyages to Jamaica than to Barbados, the difference was small, £152. On the other hand, the Royal African Company's net income on the Jamaican voyages of £1,133 was nearly twice what the company earned from the voyages to Barbados. The greater risk of piracy on voyages to Jamaica and risk of attack from the Spanish, which likely reduced the trade in gold, may explain part of the difference in returns.Footnote 23
The Royal African Company records allow us to assess the relative importance of the various contributors to the gap between slave prices in Africa and the Caribbean. Averaging across these voyages, 31 percent of the price differential between the Caribbean and Africa was due to mortality, 9 percent was due to morbidity, and 60 percent to net transport costs. The earnings from the trade in gold and other freight, which helped reduce the price differential, were 13 percent of gross transport costs, averaging 9 percent on the Jamaican voyages and 20 percent on the voyages to Barbados.Footnote 24
Interpreting the Impact of Transport Costs on Slave Prices and Numbers
In the 1680s transport costs, including the cost of mortality and morbidity, accounted for about 80 percent of the price of the slaves in the Caribbean, and throughout the eighteenth century, transport costs remained central to the slave markets on both sides of the Atlantic. We analyze the impact of these costs on slave prices and slave numbers in the period of our study, 1684 to 1686. Here our concern is less with the breakdown of the individual transport cost components than with the overall impact of these costs. Accordingly, we replace equation 1 with

where t are net transport costs per slave leaving Africa, which are gross transport costs, including profits but excluding the effect of mortality and morbidity, less earnings from the related trade. Assuming constant price elasticities of demand and supply, the slave trade market can be represented by a supply equation in Africa

and a demand equation in the Caribbean

where QA are slave departures from Africa, QI are “healthy equivalent” slave arrivals in the Caribbean, and γ and η are the elasticities of supply and demand.Footnote 25 Slave departures and arrivals are related by the death rate and the morbidity cost

Substituting equations 3 to 5 into equation 2 gives equilibrium slave numbers and slave prices. The equilibrium West Indies price of slaves is the solution to

The other equilibrium values are derived by substituting PI into equations 2–5. Thus there are two equilibrium prices, one for the West Indies and the other for the Caribbean; and two equilibrium quantities, one representing the number of Africans boarded on the ships and, the other, the number of “healthy equivalent” Africans arriving in the Caribbean. Comparative statics results for transport costs, t, and the mortality rate, d, are derived by differentiating equation 6.Footnote 26

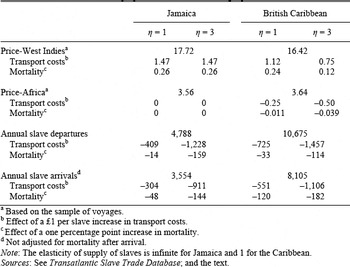
Between 1684 and 1686, 32,034 Africans were boarded on ships bound for the British Caribbean, while the number disembarking was 24,316. Of the total arrivals, Jamaica received 10,663 slaves andBarbados, 11,302. Our assessment of the impact of transport costs and mortality is based on annual departures and arrivals, and slave prices from our sample of voyages. Table 5 reports the results for Jamaica and all the British Caribbean, where for both regions the elasticity of demand, η, has been set equal to 1 or 3. Because Jamaica represented a small part of the overall slave trade, changes in transport costs unique to Jamaica would have had a negligible impact on prices in Africa, so we assume a perfectly elastic supply of slaves to the colony. For all the British Caribbean, an elasticity of supply, γ, of 1 is assumed.Footnote 27
THE EFFECT OF TRANSPORT COSTS AND MORTALITY ON SLAVE PRICES AND NUMBERS, 1684–1686

a Based on the sample of voyages.
b Effect of a £1 per slave increase in transport costs.
c Effect of a one percentage point increase in mortality.
d Not adjusted for mortality after arrival.
Note:
The elasticity of supply of slaves is infinite for Jamaica and 1 for the Caribbean.
Sources:
See Transatlantic Slave Trade Database; and the text.
A £1 increase in transport costs to the British Caribbean raises the West Indies price of slaves by between £0.75 and £1.12 (5 to 7 percent), and lowers the price of slaves in Africa by £0.25 to £0.50 (7 to 14 percent), depending on the assumed elasticity of demand. A £1 increase in transport costs exclusive to Jamaica raises the Jamaican price by £1.47.Footnote 28 These results suggest that changing transport costs could have had a significant impact on slave prices both in Africa and the Caribbean. The especially large effect of transport costs that were exclusive to a colony helps explain why the price of slaves in Jamaica was significantly higher than in Barbados. On the Barbados voyages, the earnings from gold, ivory, and freight averaged £0.5 per slave more than on the voyages to Jamaica. These earnings differentially lowered the net transport cost to Barbados and hence the price of slaves in that colony. The impact on the slave price differential between Jamaica and Barbados according to the transportation effect derived here was £0.74 (i.e., £0.5×1.47). The greater cost of the ship and captain on voyages to Jamaica also had a magnified effect. Changes in transport costs had a potentially large impact on the size of the trade. For the British Caribbean, an increase in transport costs of £1 per slave reduces the number of slaves leaving Africa and arriving in the West Indies by 7 to 14 percent. Limiting the analysis to Jamaica, the potential effect of transport costs is even greater. Where a (not implausible) elasticity of demand of 3 is assumed, a £1 increase in costs reduces slave flows by nearly 25 percent. As we noted, the greater perceived risks to shipping in the western Caribbean during the 1680s contributed to higher transport costs. In later years, as the threats diminished the differential in transport costs did as well, and consistent with the effects derived here there was a marked shift in the trade to Jamaica and other western Caribbean islands.
Changes in mortality have quite different effects on the West Indies and African sides of the slave market. For Jamaica, a one percentage point increase in the mortality rate increases the West Indies price by £0.26 (1.5 percent) and reduces arrivals by between 48 to 144 (1.5 to 4.0 percent). The effect on the number of slaves departing Africa is negligible (–14) for a demand elasticity of one since the fewer arrivals are offset by the additional departures needed to compensate for increased deaths on the voyage. For an elasticity of three, however, departures fall by 3 percent. Where a unit elastic supply is assumed (British Caribbean), arrivals fall by 1.5 to 2.2 percent, while the African side of the market is hardly affected. These results imply that the large decline in middle-passage mortality over the eighteenth century had a significant impact on the market for slaves in the Caribbean, but likely had little effect in Africa.
The Slave Trade: A Long-Run View
The accounts discussed above were created at the outset of a period of rapid expansion of the slave trade; a time when British slave traders took over dominance in the delivery of slaves to the Americas. Between 1675 and 1807 new regions of slave provenance on both the coast and interior of Africa entered the business, smaller enterprises replaced the large national monopoly companies such as the RAC, shipboard mortality declined by half, and middle passage voyage lengths to the Caribbean fell on average by 30 percent. In addition, the mix of trade merchandise carried to Africa as well as the amount and variety of African produce carried back to Europe changed substantially. The incidence of piracy declined throughout the Atlantic in these years. Any or all of these factors could have substantially altered the supply structure of slave trading.
Figure 1 describes the pattern of slave prices over the period 1675 to 1807 and the implied transport cost per slave leaving Africa. This transport cost is calculated as the difference between the Caribbean and African price adjusted for mortality and morbidity (see equation 2, component t), and includes therefore above-normal, or below-normal, profits in each year. Given the large number of traders and the ease of entry and exit, it seems appropriate to assume generally normal profits over this long period, which means trends in the series should be a good reflection of actual transport costs. Over the 132 years, the trends in both the Caribbean and African prices of slaves were strongly positive, with Caribbean prices increasing at an annual rate of 0.82 percent and African prices at a considerably faster 1.44 percent. Given declining mortality on the voyages and the rise in African prices from a much lower base, implied transport costs, t, were also trending upward. The rate was 0.91 percent per year.Footnote 29
SLAVE PRICES AND TRANSPORT COSTS, 1675–1807 (1700–1701 prices)

Transport costs did not increase steadily. In the last quarter of the seventeenth century they were low, averaging £5.9 per embarked slave, and during the eighteenth century there were periods, notably in the 1730s and 1750s, when sharp increases in the price of slaves, possibly due to spikes in sugar prices, temporarily raised the differential between Caribbean and African slave prices. But from 1700 to 1780 there was almost no trend in our estimated transport costs. Still the average for the period of £11.8 per embarked slave was nearly twice the level of 1675–1699. During the last 25 years of the British slave trade, prices in the Caribbean moved sharply higher again, and although prices in Africa rose as well, albeit with a lag, the differential increased to nearly £20 per slave leaving Africa. It was only at the very end of the period that estimated transport costs returned to their earlier levels.Footnote 30
Two factors may have been especially significant to the rising transport costs. After 1700 there was a large decline in the commodity trade from Africa, particularly in gold. The decline in earnings raised the net cost of transporting Africans by reducing the gains from a good that could be shipped along with slaves. Another contributor to higher transport costs during some periods of the eighteenth century was the increased length of the complete voyage, which was due entirely to the greater time it took to assemble and board the slaves in Africa. Mean voyage length from the port of origin to the Caribbean was 286 days during the period 1675–1700 and 359 days from 1751–1775.Footnote 31
During the hundred-year period, 1675–1679 to 1775–1779, the cost of transporting a slave from Africa, exclusive of mortality and morbidity, increased by 75 percent, from £7.97 to £14.03 (1700/01 prices), while slave mortality fell from 24.2 to 14.8 percent.Footnote 32 Meanwhile, numbers arriving in the Caribbean over the five-year periods 1675–1679 to 1775–1779 increased from 32,000 to 103,000. We can apply the comparative statics results of Table 5 to suggest how transport costs and mortality affected slave numbers and prices over this long period. A £1 increase in transport costs raises the price of slaves in the West Indies by roughly £1, which suggests higher transport costs were responsible for about one-quarter of the increase in slave prices and severely dampened what would have been an even greater trade. On the other hand, falling mortality rates had an effect that was about equal in magnitude but opposite in direction. So, although mortality and transport costs each had a significant impact, their effects were roughly offsetting.Footnote 33 In fact, increasing demand for slaves in the Caribbean was what mainly drove the slave market in the eighteenth century. At first, the expansion of the slave economy in the western Caribbean was the cause, but once the slave population had grown, a high attrition rate, at least until 1790, accounted for most of the rising demand for Africans.Footnote 34
CONCLUSION
Several of the major findings in connection with our detailed analysis of the mid-1680s have implications for the slave trade when it was at its peak in the following century and a half. The produce traffic carried on by slave vessels, so important to the viability of some of the ventures examined here, has tended to be treated as a separate business in the later period. Studies of profits generated by the slave trade have not taken this into account or have assumed that it was of minor importance. This is partly because gold exports—initially the most valuable of West African commodities—declined sharply after 1700. Yet the decline was offset to some extent by the increasing importance of ivory, dye woods, and, in the early decades of the 1700s, by Brazilian gold, which found its way to Britain via exchange between British and Portuguese slave ships on the African coast. Second, the major contribution of slave mortality to the costs of the voyage that emerges here should be taken into account in any reassessment of the slave trade. It is now well-known that shipboard mortality declined markedly between 1700 and 1807, but the impact on long-run trends in the costs and volume of the transatlantic slave trade has yet to be recognized.Footnote 35 Ultimately, though, it was the expanding slave economy in the West Indies that was the main factor driving prices and numbers in the seventeenth and eighteenth centuries.
 . We make use of the detail in the slave auctions, which identify men, women, boys, and girls, to derive a price for each category of slave. Since mortality and morbidity could differ by age and gender, the West Indies price is computed as a weighted average of the price of each category of slave:
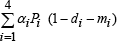 where refers to the category of slave (1 – men, 2 – women, 3 – boys, and 4 – girls), and αi is the share of slaves leaving Africa in category i. We assume that the mortality rate at sea was the same for all groups. Mortality after arrival, reported by age and gender, is added. For a thorough analysis of these issues, see Galenson, Traders.
 See
 . Equation 4 should be interpreted as the excess demand for slaves, being the difference between total demand and the supply of slaves in the Caribbean. Assuming supply in the Caribbean was perfectly inelastic, the elasticity of excess demand is ηT(QT/QI), where ηT is the elasticity of total demand and QT/QI is the ratio of total demand to slave arrivals. This ratio varied by region and time period, but generally annual slave arrivals were about 5 percent of the slave population. So even if the total demand for slaves in the Caribbean was very inelastic, the elasticity of demand for imported slaves could still have been quite high. See Eltis, Lewis, and Richardson, “Slave Prices,” pp. 690–91.