Implications
Group housing of social animals is important for welfare; however, conspecifics can also cause stress and injury. Live weight relative to group mates gave heavier animals an advantage during agonistic encounters in mixed parity groups, whereas success in agonistic encounters correlated with a better live weight gain. Lean and submissive sows should be monitored carefully for their access to feeders in group housing.
Introduction
The use of individual gestation stalls for sows has been restricted since 2013 in the European Union (Council Directive 2008/120/EC), and sows have to be group housed during the majority of the gestation period. Group housing allows gestating sows freedom of movement and the opportunity for social interaction, and thus better prerequisites for improved welfare compared with single confinement (Chapinal et al., Reference Chapinal, Ruiz de la Torre, Cerisuelo, Gasa, Baucells and Manteca2010). However, social interaction is not always positive and increased aggression can cause stress to sows (Ison et al., Reference Ison, Donald, Jarvis, Robson, Lawrence and Rutherford2014). Stress can be caused by pain and wounding from bites, psychological factors like fear and inability to access resources such as favoured resting places and food (O’Connell et al., Reference O’Connell, Beattie and Moss2003; Verdon et al., Reference Verdon, Morrison, Rice and Hemsworth2015). Tear staining or red colouring around eyes is one sign of ill health or welfare in rodents and there is some evidence that tear staining could also be used as an animal welfare indicator in pigs (DeBoer et al., Reference DeBoer, Garner, McCain, Lay, Eicher and Marchant-Forde2015). In addition, frequent social regroupings have been shown to increase the risk for claw lesions (Olsson et al., Reference Olsson, Svendsen, Botermans and Bergsten2016) and lameness (Li and Gonyou, Reference Li and Gonyou2013). Social factors may play a role in reproduction, the effect being most pronounced during weeks 2 to 4 of pregnancy in sows (for a review, see Spoolder et al., Reference Thomsen, Nielsen and Larsen2009). For example, Hoy et al. (Reference Hoy, Bauer, Borberg, Chonsch and Weirich2009) showed that the farrowing rate and litter size were greater for high-ranked than for low-ranked sows.
Competition for limited resources, such as food, may lead to an increase in agonistic interactions (Spoolder et al., Reference Thomsen, Nielsen and Larsen2009). The distribution of food within the pen affects feeding and aggressive behaviour (Brouns and Edwards, Reference Brouns and Edwards1994; Chapinal et al., Reference Chapinal, Ruiz de la Torre, Cerisuelo, Gasa, Baucells and Manteca2010; Thomsen et al., Reference Telkänranta, Marchant-Forde and Valros2010) and success in monopolizing resources affects the social status of a sow within her group (Kranendonk et al., Reference Kranendonk, van der Mheen, Fillerup and Hopster2007; Spoolder et al., Reference Thomsen, Nielsen and Larsen2009). Dominant sows have been shown to feed for longer durations (Martin and Edwards, Reference Martin and Edwards1994) and to eat before low-ranking sows, whereas low-ranking sows are more frequently displaced at feeders (Brouns and Edwards, Reference Brouns and Edwards1994; O’Connell et al., Reference O’Connell, Beattie and Moss2003). The welfare of low-ranking sows is affected by the competitiveness of the feeding system (Brouns and Edwards, Reference Brouns and Edwards1994; Andersen et al., Reference Andersen, Bøe and Kristiansen1999), especially when food is only available for a short period of time each day. When sows get bullied around the feeder or drinker, their lower social status can be considered to have a negative effect on their wellbeing (O’Connell et al., Reference O’Connell, Beattie and Moss2003; Li et al., Reference Li, Wang and Johnston2012; Wang and Li, Reference Wang, Yang, Cao, Lin, Che, Duraipandiyan, Al-Dhabib, Fanga, Xua, Fenga, Liu and Wu2016), and can decrease their weight gain during the gestation period in a competitive feeding system (Brouns and Edwards, Reference Brouns and Edwards1994). However, these effects can be reduced when food is available ad libitum, with low-ranked sows able to adjust their feeding patterns and avoid conflict around the feeder at preferred times of the day (Brouns and Edwards, Reference Brouns and Edwards1994).
Older (Chapinal et al., Reference Chapinal, Ruiz de la Torre, Cerisuelo, Gasa, Baucells and Manteca2010; Li et al., Reference Li, Wang and Johnston2012; Ison et al., Reference Ison, Donald, Jarvis, Robson, Lawrence and Rutherford2014), and especially heavier (Brouns and Edwards, Reference Brouns and Edwards1994; Kranendonk et al., Reference Kranendonk, van der Mheen, Fillerup and Hopster2007) sows are commonly more dominant as demonstrated with mixed parity groups. The relative aggressiveness level and social status of individual sows have been shown to be rather stable in unchanging environments (Parent et al., Reference Parent, Meunier-Salaün, Vasseur and Bergeron2012; Horback and Parsons, Reference Horback and Parsons2016) and familiarity of group mates reduces aggression after mixing (Krauss and Hoy, Reference Krauss and Hoy2011). Farmers are often advised to address the negative consequences of competition and fighting by matching similar individuals to be housed together (Li et al., Reference Li, Wang and Johnston2012). In this study, we assess the function and ability to serve 12 animals, of a feeding system used on a commercial farm that provided two unprotected, single space feeding troughs which was intended to have food available ad libitum. However, it is unclear how the success in competition affects the live weight gain and litter performance on farm.
Our aim was to investigate the associations between agonistic interactions, back fat, live weight and weight gain in mixed parity groups of 12 sows. Further, we examined the effect of parity on weight gain, body condition and back fat at mixing and before farrowing. In addition, we studied relationships between agonistic interactions, body condition and litter size. We looked in more detail at those sows at specific risk in the group, namely thin sows, sows gaining least live weight and submissive sows. Our main hypotheses were that thinner sows show submissive behaviours more often than heavier ones during agonistic encounters and that sows with a lower winning percentage in agonistic encounters gain less weight during gestation than sows that win more often.
Material and methods
Animals, housing and management
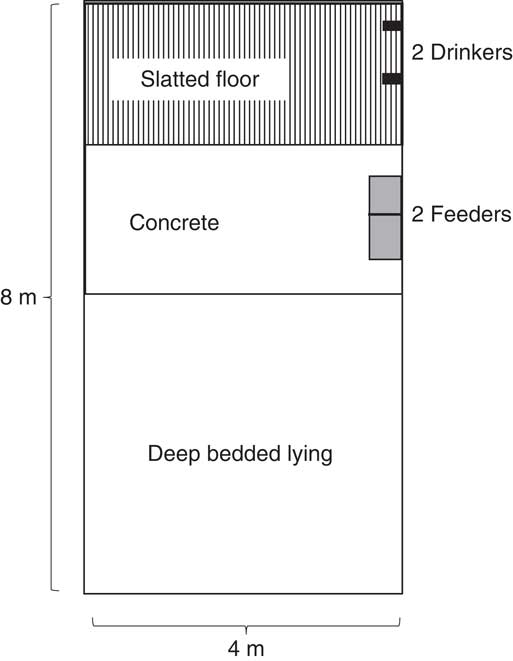
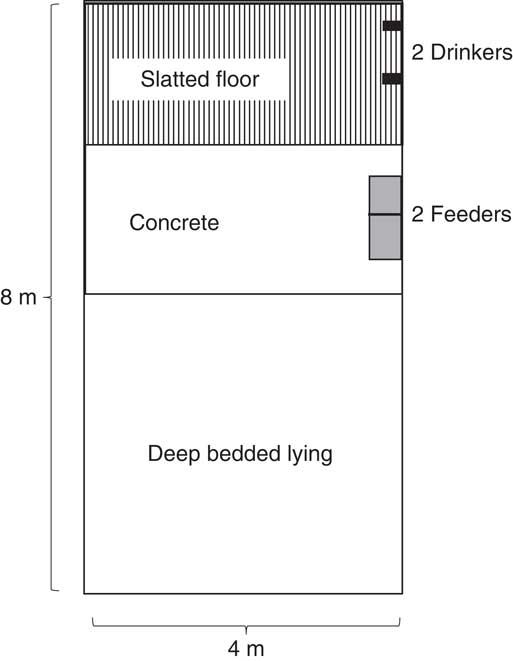
This study adhered to the European Directive on the protection of animals used for scientific purposes (2010/63/EU), induced no additional harm to pigs above the common farm management practices and utilized the housing and feeding system employed on this farm to study the social behaviour of sows. The study was performed on a commercial farm in Western Finland during a 4-month period in the summer of 2015. In total, 298 gestating sows and gilts in 25 mostly mixed parity groups of 11 to 12 animals were included. The average parity of the sows was 3 (ranging from 1 to 8), including 72 sows in their first pregnancy (primiparous gilts). The pen design is shown in Figure 1. The two trough feeders without partitions provided free access to feed and could be accessed by one animal at a time. The hoppers of these feeders were filled to appetite twice a day, first between 0300 and 0700 h and second time between 1000 and 1400 h by an overhead, automated, rail-track conveyor car. Commercial pelleted diet (Tiineys-Pekoni; Suomen Rehu, Hyvinkää, Finland) with 8.1 MJ NE/kg and a high fibre content was fed. Two adjacent nipple drinkers provided ad libitum access to water.
Group pen design showing the deep-bedded lying area and the feeding area (with solid concrete flooring with two feeders and slatted area with two nipple drinkers). The pen dimensions were 4×8 m, thus providing 2.9 or 2.7 m2/sow, depending on whether there were 11 or 12 sows.
Procedures
The sows were moved to the group pens from insemination stalls ~4 weeks after insemination and after pregnancy was confirmed using ultrasound. Animals were grouped by the farm manager according to the farm practice. Each group included sows with similar expected farrowing dates, parity, body condition and history of being housed together. In total, three groups were homogenous for parity; six groups consisted of primiparous gilts and second parity sows; and one group consisted of primiparous gilts and third parity animals. In all, nine pens accommodated sows of second parity with higher (max 3 to 7) parity animals. In two groups of older animals, parity ranged from 3 to 7 and in four groups, parity range was from 4 to 7 or 8. In one group, parity ranged from 5 to 8. The largest range of live weights between the heaviest and lightest sows within a pen was 133 kg and the smallest range was 32 kg, whereas, the mean range of weight in pens was 72 kg. Sows stayed in the group for ~11 weeks and were moved to the farrowing pen about 1 week before the expected farrowing date. Back fat, body condition score and live weight were measured before mixing and again when they left the pen for farrowing. Live weight gain was calculated by taking the difference between the end and start weight of the sow. Relative live weight within the group was calculated as the difference between individual sow’s weight and the respective mean group live weight.
The body condition score of the sows was estimated on a traditional 5-point scale described for example by Li et al. (Reference Li, Wang and Johnston2012). Body condition of sows were scored on the following scale: 1 emaciated (back bone and ribs visible), 2 thin (back bone and ribs can be easily felt), 3 fit (back bone and ribs can barely be felt), 4 fat (back bone and ribs cannot be felt) and 5 very fat (obviously over weight). The body condition score was always recorded by two persons, with one scorer always being the same, and the other scorer being one of the nine assistants. The mean score of both observers was used in the analysis. Back fat thickness was evaluated always by the same person using ultrasonography (Lean-meter; Renco, Minneapolis, MN, USA) at the P2 position 5 cm down from the midline, at the level of the head of the last rib. The mean back fat thickness of both sides was used in the analysis, as well as the change in back fat between the two measurements (at mixing and end of gestation).
Tear staining was scored according to DeBoer et al. (Reference DeBoer, Garner, McCain, Lay, Eicher and Marchant-Forde2015) and Telkänranta et al. (Reference Van der Peet-Schwering, Kemp, Plagge, Vereijken, Den Hartog, Spoolder and Verstegen2016) by one scorer before farrowing in farrowing crates. On the scale, 0 indicated no signs of staining; score 1 indicated barely detectable staining; 2 stained area <50% area compared with size of an eye area; 3 staining of 50%–100% of total eye area; 4 stained area >100% of total eye area; 5 staining >100% of total eye area and staining extends below the mouth line. Both eyes of all animals were scored and the mean score was used in the analysis. The litter size (total born and live born) was recorded.
Behavioural observations
Each pen was equipped with a video camera directed towards feeders, which also showed most of the resting area. The pen was recorded for a week following group formation and a week at the end of gestation (~2 to 3 weeks before farrowing). Before recording, sows were spray-paint marked for individual recognition. Videos were used for analysis of agonistic behaviours from which social status was estimated based on the numbers of won and lost interactions. Observations of agonistic behaviours from the videos began on the next day immediately following grouping and marking of the sows at 0800 h and continued until 1600 h when lights went off. The group was observed until at least 150 agonistic interactions had been recorded per pen at mixing and 100 at the end of gestation. If not enough encounters were seen during 1 day, the observations continued beginning at 0800 h until 1600 h for as many consecutive days as needed to gather enough observations (usually within 2 days except for one group 5 days due to technical reasons). The mean number of interactions observed per group was 155 (min 150, max 201) at mixing and 111 (min 99, max 150) at the end of gestation. The groups were observed in random order.
Two observers were trained to identify distinctive forms of agonistic behaviours in pigs (Jensen, Reference Jensen1980). To determine the outcome of the interaction, agonistic interactions were defined as any form of fight or a displacement initiated by one individual and featuring aggressive behavioural elements followed by any form of submissive behaviours performed by the recipient (Langbein & Puppe, Reference Langbein and Puppe2004). Submissive behaviours were defined if the animal stopped fighting, turned her head away or lowered her head, withdrew by walking away from contact and escaped or was displaced in response to any form of agonistic behaviour. In each interaction, the sow showing submission was marked as the loser and the other sow as the winner. Winning percentage was calculated based on the numbers of won and lost interactions. The number of won interactions was divided by the total number of all interactions in which each sow was involved. Agonistic social contacts were also recorded as physical and non-physical interactions. In physical interactions, there was apparent contact during the encounter. The area where the interaction was initiated – either the feeding or the resting area – was recorded. For all comparisons between winning percentage and other parameters, all interactions, both physical and non-physical, and occurring anywhere in the pen were combined.
Statistical analyses
The association of winning percentage, parity and time in group pen on live weight, body condition score, back fat thickness and relative live weight was analysed as a REML using the linear mixed model. In the model, time (at mixing and end of gestation) was included as repeated statement. Winning percentage and parity (primi/multiparous) were included as fixed factors along with the interaction between time and parity. Pen was considered as a random variable. In the next analysis, the association of achieved winning percentage at mixing with winning percentage at the end of gestation was analysed with mixed model. In this model, winning percentage at mixing was included as fixed factor. Pen was considered as a random variable.
The predictability of the live weight, body condition, back fat, tear staining and winning percentage on litter size was analysed using linear mixed models. Live weight, live weight gain, body condition score, back fat, tear staining and winning percentage were used as independent variables and number of piglets born (total and live born separately) as dependent variables in linear mixed models to evaluate the association between these variables. Parity was included as fixed factor and group was included as random factor in all the models. To avoid the effects of collinearity between measures of weight, body condition, back fat, tear staining and winning percentage, these factors were inserted separately in the models.
To evaluate if sows at high risk of welfare or production problems differed from other sows, high-risk sows were defined as follows: lean sows: sows with a body condition score <3; low-weight-gain sows: sows gaining <10 kg; low-winning sows: sows with low-winning percentage (<20%). These sows were compared with all other sows using separate Mann–Whitney U-tests for each variable. The differences in the winning percentage (at mixing and at the end of gestation) between lean and normal sows was tested. Along the same line, the difference between low-weight-gain sows and normal sows in their winning percentage (at mixing and end of gestation) was analysed. Sows with low winning percentage at mixing were compared with normal sows for their live weight gain and back fat development. Furthermore, sows with a tear staining score over 4 were compared with all other sows for winning percentage using Mann–Whitney U-test. All statistical analyses were carried out using SPSS 23. The limit for statistical significance was P<0.05. Significant P-values along with means and standard errors are reported, whereas standard deviations are reported in connection to descriptive data.
Results
Overall, 6656 agonistic interactions were observed. Most of these interactions were physical (67%) and took place in the feeding area (69%) instead of the resting area. Altogether, eight sows were removed or died during the experimental period. One of those died within hours after grouping, having been bitten around her body. The cause of death was not determined. The winning percentage was positively associated with live weight (F 1,509=5, P=0.027), relative live weight (F1,516=21, P=0.001), body condition score (F 1,451=17, P=0.001) and back fat thickness (F 1,491=8, P=0.006). A 1% increase in winning percentage was associated with a 0.09 kg increase in live weight, with a 0.004 increase in body condition score, with a 0.02 mm increase in back fat and with a 0.1 kg increase in relative live weight. Table 1 shows the live weight, body condition score, back fat and relative live weight development during the experimental period. There was an interaction between experimental phase and parity indicating that multiparous sows weighed more before farrowing than at mixing. There was also an interaction between experimental phase and parity in relative live weights showing primiparous gilts weighted less than their group mates. The back fat was thicker before farrowing compared with at mixing. Primiparous gilts had higher body condition score than multiparous sows, but the overall body condition score was lower prior to farrowing than at mixing. The winning percentage at mixing associated positively with the winning percentage at the end of gestation (F 1,292=366, P=0.001, slope 0.7, 95% confidence interval 0.7 to 0.8).
The development of mean live weight, body condition score (BCS), back fat thickness and live weight relative to group mates throughout the gestation period from week 4 after insemination (at mixing) until before farrowing, and differences between primiparous and multiparous sows over time according to linear mixed models

Ns, not significant.
*P<0.05, ***P<0.001
Litter size
Heavier sows gave birth to a larger number of live born piglets (live weight at mixing F 1,285=12, P=0.001; end F 1,285=9, P=0.003) than lighter sows, but the maternal live weight was not associated with total litter size. Multiparous sows delivered a larger number of live born piglets compared with primiparous gilts (14±0 v. 11±1; F 1,285=25, P=0.001), and the difference was similar for total litter size (16±0 v. 13±1; F 1,285=13, P=0.001). Lower body condition score before farrowing was associated with smaller total litter size (F 1,285=4, P=0.034) but not with live-born piglet number. Live weight gain, back fat thicknesses, tear staining scores or winning percentages were not associated with litter performance. Tear staining scores were on average 2.6, SD 0.8.
High-risk sows
Lean sows (body condition score <3) had a lower winning percentage at mixing compared with other sows (U=3; P=0.021; median (interquartile range) 21 (9 to 40) v. 44 (21 to 69); n=17 v. 277, respectively), but the winning percentage at the end of gestation did not differ between sows that were lean at mixing and other sows. Low-weight-gain sows (live weight gain <10 kg) won a smaller proportion of interactions at mixing (U=5; P=0.001; 19 (9 to 32) v. 46 (22 to 70)%) and in the end of gestation than other sows (U=5; P=0.001; 14 (3 to 41) v. 50 (26 to 74)%; n=22 v. 269). Sows with low winning percentage (<20%) gained less live weight during gestation than other sows (U=11; P=0.001; 30 (15 to 42) v. 43 (30 to 52) kg) and they also gained less back fat than other sows (U=11; P=0.001; 3 (0–6) v. 5 (2 to 8) mm; n=75 v. 217). There was no difference between sows with high tear staining score (>4) and other sows in winning percentage at the end of gestation.
Discussion
Live weight was related to greater success in agonistic encounters in sow groups, with heavier and thus often older sows winning more. Sows that frequently lose also gained less live weight during the study period, indicating disadvantage in feeding competition. Success in agonistic encounters seems to be rather consistent as most sows kept their initial status towards the end of pregnancy, in agreement with the results of Parent et al. (Reference Parent, Meunier-Salaün, Vasseur and Bergeron2012). In addition, winning agonistic encounters was associated with higher body condition and thicker back fat, indicating an advantage in feeding competition. Higher relative live weight within the group seemed to be advantageous in agonistic encounters. Brouns and Edwards (Reference Brouns and Edwards1994) showed that subordinate sows were more often displaced at ad libitum feeders and O’Connell et al. (Reference O’Connell, Beattie and Moss2003) showed that subordinate sows were more often displaced from the feeder queue than dominant ones, and had to wait longer for their turn to feed. High ranking sows were disturbed less, got bitten less at the feeder and spent more time at the feeder (Andersen et al., Reference Andersen, Bøe and Kristiansen1999). Competition for feed has previously been shown to lead to a lower live weight gain of subordinate sows, as compared with more dominants ones (Kranendonk et al., Reference Kranendonk, van der Mheen, Fillerup and Hopster2007; Li et al., Reference Li, Wang and Johnston2012; Verdon et al. Reference Wang and Li2016).
Previous studies have shown that larger body size is advantageous in fights between sows and that therefore heavier individuals end up having higher social status (Brouns and Edwards, Reference Brouns and Edwards1994; Li et al., Reference Li, Wang and Johnston2012; Zhao et al., Reference Verdon, Hansen, Rault, Jongman, Hansen, Plush and Hemsworth2013). Experience with the housing systems and with fights may further support the success of older sows. In the current study, live weight in mixed parity pens was connected to the winning percentage. Relative live weight might, therefore, suffice as a proxy estimate for success in social competition. The sows grouped in the same pen were selected by the farm manager based on the expected farrowing dates, age, body condition and history of being housed together, thus leading to relatively small live weight differences within groups. It is, therefore, interesting that even relatively small differences between sows influenced their winning percentage significantly.
As expected (Van der Peet-Schwering et al., Reference Spoolder, Geudeke, Van der Peet-Schwering and Soede2004; Wang et al., Reference Zhao, Flowers, Saraiva, Yeum and Kim2016), sows gained weight and increased their back fat layer during the last 12 weeks of gestation while kept in group pens. However, their body condition score did not follow this pattern and was lower near farrowing than when entering the group. Body condition scoring has earlier been criticized as an inaccurate method (Charette et al., Reference Charette, Bigras-Poulin and Martineau1996; Maes et al., Reference Maes, Janssens, Delputte, Lammertyn and de Kruif2004); however, it is widely used possibly because it requires no equipment and is fast to accomplish. Indeed, Maes et al. (Reference Maes, Janssens, Delputte, Lammertyn and de Kruif2004) observed lower correlations between body condition scores and back fat at the time of farrowing, indicating the scoring may be dependent of reproduction stage. In the current study, multiparous sows had a lower body condition score compared with primiparous gilts possibly reflecting physically draining lactation or more plentiful feeding of primiparous gilts during early gestation.
It is important from a production point of view to optimize live weight development in sows (reviewed by Maes et al., Reference Maes, Janssens, Delputte, Lammertyn and de Kruif2004; Wang et al., Reference Zhao, Flowers, Saraiva, Yeum and Kim2016). Animal welfare reflects a successful adaptation of the individual, not the population (Ohl and Van der Staay, Reference Ohl and Van der Staay2012), and there is, therefore, a need to focus especially on sows which are doing poorly within the group. The results of this study showed that sows with a body condition score of 1 or 2 in gestation won fewer fights or retreated from social contacts more often compared with other sows, and thus they were at risk of being affected by feed competition the most. This was supported by the fact that the sows with low winning percentage indeed gained less live weight and back fat during gestation compared with other sows. Sows that gained <10 kg won fewer interactions than other sows. It can therefore be suggested that to enhance the good welfare of lean and submissive sows, the group housing design needs to especially support and protect these animals, with the provision of enough space, physical barriers and easy access to food and water points.
Heavier sows delivered a larger number of live born piglets and indeed, multiparous sows had larger litters than primiparous gilts. Higher body condition score was associated with a higher total number of piglets born. Even though we found correlations between winning percentage, body fat, body condition and live weight, winning percentage was not associated with litter performance in the current study. Spoolder et al. (Reference Thomsen, Nielsen and Larsen2009) concluded that social factors in general play a role for sow reproduction, but previous studies have yielded inconclusive results. Several studies have shown no effect of social status on reproduction (Kranendonk et al., Reference Kranendonk, van der Mheen, Fillerup and Hopster2007; Verdon et al., Reference Wang and Li2016; Wang and Li, Reference Wang, Yang, Cao, Lin, Che, Duraipandiyan, Al-Dhabib, Fanga, Xua, Fenga, Liu and Wu2016; Li et al., Reference Li, Wang and Johnston2017, ), whereas Zhao et al. (Reference Verdon, Hansen, Rault, Jongman, Hansen, Plush and Hemsworth2013) reported that higher ranked sows gave birth to fewer live born piglets, and had a higher stillborn rate than low-ranking sows. In contradiction, Hoy et al. (Reference Hoy, Bauer, Borberg, Chonsch and Weirich2009) reported a larger litter size in higher ranked sows.
Tear staining near eyes of pigs has been associated with welfare and welfare-related factors such as barren environment and skin damage (DeBoer et al., Reference DeBoer, Garner, McCain, Lay, Eicher and Marchant-Forde2015; Telkänranta et al., Reference Van der Peet-Schwering, Kemp, Plagge, Vereijken, Den Hartog, Spoolder and Verstegen2016), as well as with social status in nursery-age pigs (Marchant-Forde and Marchant-Forde, Reference Marchant-Forde and Marchant-Forde2014). However, the evidence for robustness of tear staining evaluation as an animal welfare measure is still only developing. Defeat in feeding competition may result in increased fearfulness in sows, thus potentially affecting their welfare (O’Connell et al., Reference O’Connell, Beattie and Moss2003). However, tear staining scores were not associated with winning percentage at the end of gestation in this study, and also not with litter size. It is possible that evaluation of tear staining was inconsistent because of the inclusion of all animals, some of which had dirty faces, making the stains hard to distinguish and record accurately. Previous studies on tear staining as a welfare estimate in pigs have been performed on growing pigs (DeBoer et al., Reference DeBoer, Garner, McCain, Lay, Eicher and Marchant-Forde2015; Telkänranta et al., Reference Van der Peet-Schwering, Kemp, Plagge, Vereijken, Den Hartog, Spoolder and Verstegen2016), and it might be that the link is not as clear in adult sows or tear staining might not reflect the level of social stress in sows.
Two feeders for 12 sows created a relatively competitive feeding system. However, the way interactions were observed in this study did not include details about the nature of all interactions between the sows. The focus was on clear win–lose situations and might have caused an under representation of subtle threats. As the distribution of feed has been shown to affect feeding and aggressive behaviour (Thomsen et al., Reference Telkänranta, Marchant-Forde and Valros2010), it is likely that a larger number of feeders would have decreased the number of fights.
The method to determine hierarchy, where sows are placed in rank order, does not take into account other aspects of social living, nor can it be assumed to provide a complete description about the social structure of the sow groups (Camerlink et al., Reference Camerlink, Turner, Ursinus, Reimert and Bolhuis2014). For example, the method ignores friendly relations like resting together (Durrell et al., Reference Durrell, Sneddon, O’Connell and Whitehead2004; Krauss and Hoy, Reference Krauss and Hoy2011). The current study evaluated the winning percentage of almost 300 sows kept in commercial farm in groups of 12, thus providing substantial data on associations between winning percentage, live weight and back fat deposit compared with other studies (e.g. Brouns and Edwards, Reference Brouns and Edwards1994; O’Connell et al., Reference O’Connell, Beattie and Moss2003; Kranendonk et al., Reference Kranendonk, van der Mheen, Fillerup and Hopster2007). The majority of sows were in good condition when entering this experiment, and they had already had time to recover from possible lactation weight loss during the weeks in individual insemination stalls. In a situation where the initial body condition of the sows at grouping would have varied more, the effect of live weight on winning percentage, and thus on subsequent live weight and back fat gain during gestation, might have been larger. This study, however, does not enable us to separate the effects of body size and age.
In conclusion, under the conditions of this study, relative live weight contributed to winning success in mixed parity groups, giving heavier animals an advantage. This advantage persisted towards the end of gestation, as lower live weight gain individuals had also lower success rate in social encounters, possibly due to less success in competition for feed. Relative live weight within a group seems to be an estimate for success during agonistic encounters and could be used as a proxy measure for social status, for example in studies where agonistic contacts cannot be determined.
Acknowledgements
The Finnish Ministry of Agriculture and Forestry and three Finnish slaughterhouses, Atria Ltd, HK Scan and Oy Snellman Ab, are acknowledged for funding. The authors wish to thank the farmer, farm staff and students for their valuable contribution.
Declaration of interest
None.
Ethics statement
None.
Software and data repository resources
None.