Introduction
As the population ages, many individuals provide informal care to an ageing spouse, parent, friend or relative. In their 2025 report, AARP and the National Alliance for Caregiving found that 59 million care-givers reported providing care to an adult aged 18 or older in the United States (AARP and National Alliance for Caregiving 2025). Although providing care to a child can be stressful, informal care-giving for an older family member who is chronically ill, disabled or has cognitive decline can lead to multifaceted strain known as care-giver burden (Liu et al. Reference Liu, Heffernan and Tan2020). This article focuses on the care-giving burden that an older adult experiences when providing care to another adult.
Informal care-giving is recognized as a chronic stressor with potential adverse physical and emotional consequences for care-givers (Berglund et al. Reference Berglund, Lytsy and Westerling2015; Beach et al. Reference Beach, Schulz, Donovan and Rosland2021; del-Pino-Casado et al. Reference del-Pino-Casado, Priego-Cubero, Lopez-Martinez and Orgeta2021). The strain that care-givers experience is multifaceted and can include negative physical health outcomes from neglecting their own health, emotional distress, disruption in a care-giver’s lifestyle and schedule that limits social activities, and financial stress (Liu et al. Reference Liu, Heffernan and Tan2020). Care-giver burden can be more pronounced when care-giving is prolonged or when the care recipient has severe behavioural problems or diminished cognitive capacity (Lindt et al. Reference Lindt, van Berkel and Mulder2020). Older adult care-givers, who may have health limitations themselves, may face additional challenges in performing their care-giving responsibilities, potentially leading to more care-giver burden.
Based on data from the Behavioral Risk Factor Surveillance System (BRFSS) collected on Americans in 2015–2017, Edwards et al. (Reference Edwards, Bouldin, Taylor, Olivari and McGuire2020) found that about 58 per cent of care-givers were women, 55 per cent were older than 45 years and nearly 20 per cent of care-givers reported fair or poor health. Using data from two US population surveys, Wolff et al. (Reference Wolff, Spillman, Freedman and Kasper2016) found that about 44 per cent of care-givers provided substantial help; these care-givers were on average providing 28 hours of care per week. Among care-givers providing substantial help, they were more likely to experience emotional, physical and financial difficulty, were more likely to experience participation restrictions in valued activities and to experience work productivity loss. Given the physical, emotional and financial stresses experienced by care-givers, it is important to identify ways in which care-giver burden can be reduced.
Some studies have found that care-giving does not always result in negative physical, mental or social health impacts (Roth et al. Reference Roth, Fredman and Haley2015; Liu et al. Reference Liu, Marino, Howard, Haley and Roth2023; Yuan et al. Reference Yuan, Zhang, Samari, Jeyagurunathan, Goveas, Ng and Subramaniam2023). When exploring potential reasons for this positive impact, research has consistently implicated social factors as being critical for reducing adverse mental health outcomes among care-givers (Sibalija et al. Reference Sibalija, Savundranayagam, Orange and Klosek2020; Tough et al. Reference Tough, Brinkhof and Fekete2022; Liu et al. Reference Liu, Marino, Howard, Haley and Roth2023; Le and Ibuka Reference Le and Ibuka2023). While these studies have identified the importance of social ties, social participation and social support for care-givers, they have not fully explored the role of social ties on care-giver burden specifically. Therefore, in this study we examine how social connectivity is associated with care-giver burden among older adults.
Social connections and health
Social disconnectedness is characterized by a lack of contact with others and can be indicated by factors such as a small social network or infrequent interactions with others (Cornwell and Waite Reference Cornwell and Waite2009). Drawing upon this definition, in our study we conceptualize social connectedness as having a large social network or frequent interactions with others. Social engagement is the enactment of social ties through real-life activity, such as attending social functions and participating in occupational or social roles (Berkman et al. Reference Berkman, Glass, Brissette and Seeman2000). Thus, social connectedness and social engagement are distinct concepts – while social connectedness refers to the characteristics of an individual’s social network, social engagement describes participation in social activities.
Social connections play a crucial role in health and wellbeing. Social ties can monitor, regulate or facilitate health behaviours, reduce stress and provide access to psychosocial resources (Umberson and Karas Montez Reference Umberson and Karas Montez2010), including a sense of meaning and purpose in life (Bavarsad and Stephens Reference Bavarsad and Stephens2024). Supportive interactions with others also have physiological impacts, including reducing allostatic load and benefiting immune, endocrine and cardiovascular function (Umberson and Karas Montez Reference Umberson and Karas Montez2010). Indeed, empirical research has shown that having larger social networks, more diverse networks and engaging more frequently in social activities are all independently associated with a reduced risk of mortality among older adults (Becofsky et al. Reference Becofsky, Shook, Sui, Wilcox, Lavie and Blair2015; Ali et al. Reference Ali, Nilsson, Weuve, Rajan and Mendes de Leon2018; Cheng Grand et al. Reference Cheng Grand, Sung, Chan, Ma and Malhotra2022; Holt-Lunstad Reference Holt-Lunstad2022; Lamar et al. Reference Lamar, James, Glover, Capuano, McSorley, Wilson and Barnes2022; Schutter et al. Reference Schutter, Holwerda, Comijs, Stek, Peen and Dekker2022). Although there is an abundance of research on how social connections impact health and wellbeing in general, relatively little research has focused on determining how social connections affect care-giver burden.
The few studies that have examined the effect of social connections on care-giver burden have focused almost exclusively on social support, finding that care-givers’ wellbeing was associated with various dimensions of social support (Clay et al. Reference Clay, Roth, Wadley and Haley2008; Chiou et al. Reference Chiou, Chang, Chen and Wang2009; Rodakowski et al. Reference Rodakowski, Skidmore, Rogers and Schulz2012; Lee and Choi Reference Lee and Choi2013; Ruisoto et al. Reference Ruisoto, Contador, Fernández-Ccalvo, Serra, Jenaro, Flores, Ramos and Rivera-Navarro2020; Xu et al. Reference Xu, Liu, He, Fields, Ivey and Kan2021). Although social support is important in helping people weather hardships, structural characteristics of social networks, such as the network’s size and diversity, have been known to influence an individual’s overall physical and mental health (Schutter et al. Reference Schutter, Holwerda, Comijs, Stek, Peen and Dekker2022; Flores et al. Reference Flores, O’Neill, Boyd, Uchino and Ruiz2023) and is also likely to matter for care-givers’ wellbeing. Although some studies have suggested that a limited social network was predictive of higher burden among care-givers (Manskow et al. Reference Manskow, Sigurdardottir, Røe, Andelic, Skandsen, Damsgård, Elmståhl and Anke2015) and that social networks can buffer against the impact that long care-giving hours have on burden (Xu et al. Reference Xu, Liu, He, Fields, Ivey and Kan2021), outside of these few studies, the literature on how social networks affect care-giver burden among older adults is rather sparse.
Core confidants and casual acquaintances
Although social networks are important for health and wellbeing, there is a growing recognition that older adults’ social networks change over time. For instance, Cornwell et al. (Reference Cornwell, Schumm, Laumann, Kim and Kim2014) reported that most older adults experienced a loss of a close confidant over a five-year period, with disadvantaged older adults more likely to lose confidants owing to death (Cornwell Reference Cornwell2015). Older adults who became a care-giver are particularly vulnerable to social network turnover and both lost and added social network ties at higher rates than non-care-givers (Roth Reference Roth2020). Given that older adult care-givers have a fluctuating egocentric social network, it is unclear whether they are able to derive health benefits from their social network to the same extent as the general population. Therefore, our first aim in this study is to examine how a social network composed of core confidants is associated with care-giver burden among older adults.
Core confidants are not the only social ties that can benefit health. Considerable research has pointed out that fleeting interactions with casual acquaintances support people’s wellbeing (Sandstrom and Dunn Reference Sandstrom and Dunn2014a, Reference Sandstrom and Dunn2014b; Moreton et al. Reference Moreton, Kelly and Sandstrom2023). Given the fact that older informal care-givers experience more turnover within their social network, it is possible that casual acquaintances may play a large role in helping these individuals meet their psychosocial needs. However, whether these casual ties can help to reduce care-giver burden has not yet been studied.
Conceptually, these incidental relationships are distinct from social network ties in several ways. Weak ties tend to have more formal role interactions and are characterized by less intimacy and fewer personal disclosures and mutual obligations (Sprecher Reference Sprecher2022). Yet, daily interactions with acquaintances in the form of brief conversations, or even sharing smiles with strangers, have been found to bolster people’s social and emotional wellbeing by generating positive emotions and creating a sense of belonging (Sandstrom and Dunn Reference Sandstrom and Dunn2014a, Reference Sandstrom and Dunn2014b).
The benefits of casual acquaintances extend to the receipt of support. There is evidence that people sometimes prefer to get instrumental or emotional support from weak ties rather than strong ties (Moreton et al. Reference Moreton, Kelly and Sandstrom2023), perhaps because those who constitute a weak tie might be more knowledgeable about a topic than those who represent strong ties (Small Reference Small2013). Additionally, people are pragmatic about the way they seek help, and weak ties may simply be more readily available to provide support when help is needed (Small Reference Small2013). For instance, casual acquaintances (e.g. a trusted hairdresser, colleague, pastor or book club member) may be more predictably available by appointment or weekly scheduled meetings, with whom one can talk to about daily stressors, than are core confidants. Moreover, older adult care-givers who are providing care to their spouses, who likely were a core confidant, may no longer be able to receive psychosocial support from their spouses during the care-giving experience; this may lead to increased reliance on casual acquaintances for emotional and social support.
Because of the important emotional and mental benefits that casual interactions provide, studies have shown that the presence of weak ties is correlated with better health and wellbeing for older adults. For example, Huxhold et al. (Reference Huxhold, Fiori, Webster and Antonucci2020) found that the number of weak ties was more strongly predictive of more positive affect and less depressed affect among older adults than the number of close ties. Lam et al. (Reference Lam, Broccatelli and Baxter2023) reported that a greater number of weak ties was associated with lower levels of loneliness. In the qualitative component of their study, they noted that strong ties were susceptible to relationship loss, conflict and geographic distances. In contrast, weak ties may be more available for support and engagement, generate a higher likelihood of social invitations and provide access to new networks. Pan and Chee (Reference Pan and Chee2020) found that weekly participation in at least one social activity was associated with better mental status and memory among Chinese older adults and that participation in a greater number of social activities was also beneficial for memory. These studies all highlight the importance of weak ties to the wellbeing of older adults.
While there is growing evidence of the importance of casual interactions to the emotional wellbeing and cognitive health of older adults, the impact of casual ties on the health and wellbeing of older adult care-givers who face chronic stresses from providing care to the very people with whom they have strong ties has not yet been adequately studied. Acquaintances, which by definition fall outside a person’s social network of close confidants, may help alleviate care-giver burden by providing immediate emotional support, advice on how to manage care-giving responsibilities or simply by offering a pleasant, comforting, in-person interaction. Despite the rationale we have just presented, few studies have examined the association between casual interactions and care-giver wellbeing. To address this gap, the second aim in this article is to examine whether more opportunities for casual interactions help to reduce care-giver burden.
To empirically study how core confidants and casual interactions are associated with care-giver burden, we use data from the National Social Life, Health, and Aging Project (NSHAP), a nationally representative sample of community-dwelling older adults in the US. We use the egocentric social network roster as a measure of the size, diversity and composition of the network of core confidants. The NSHAP network module was designed to identify the set of persons (alters) around each respondent (ego) and to describe the relationships that link the alters to the ego and to each other. Network data collected in this way are referred to as an egocentric social network (Cornwell et al. Reference Cornwell, Schumm, Laumann and Graber2009).
We use frequency of participating in a variety of group activities (e.g. attending group meetings, volunteering, attending religious services) to quantify the opportunities for casual interactions a care-giver may have. Although individuals may be motivated by religious or altruistic reasons to participate in some of these activities, being in a shared social space, regardless of the motivation for attendance, may result in feelings of camaraderie. Moreover, being in a shared social space creates opportunities for casual conversations, a sense of belonging, engagement with peripheral others and greeting hugs, all of which can lead to positive feelings that can help to maintain emotional wellbeing. More frequent attendance in social activities and attendance in many different types of social activity both can increase opportunities to benefit from these psychosocial resources, potentially helping to reduce care-giver burden.
Thus, we pose the following research questions: (1) does having larger social networks reduce care-giver burden and (2) does more social engagement reduce care-giver burden? If social engagement does matter, then, secondarily, we also examine how the frequency and the diversity of social engagement reduce care-giver burden. By examining how different dimensions of social connectivity are associated with care-giver burden, we consider the way care-givers’ differing levels of embeddedness within their social environment might mitigate the negative effects of care-giving.
Data and methods
Data
The NSHAP is a nationally representative sample of community-dwelling older adults in the United States. Round 1 of data collection occurred in 2005–2006 among a probability sample of 3,005 adults aged 57–86 (or born 1920–1947) (O’Muircheartaigh et al. Reference O’Muircheartaigh, Eckman and Smith2009). Round 2 was collected in 2010–2011 among surviving respondents and their co-resident spouses or partners, regardless of age (N = 3,377) (O’Muircheartaigh et al. Reference O’Muircheartaigh, English, Pedlow and Kwok2014). Round 3 was collected in 2015–2016 among all surviving respondents and introduced a new sample of adults born 1948–1965 and their partners (O’Muircheartaigh et al. Reference O’Muircheartaigh, English, Pedlow and Schumm2021). Round 4 was completed in 2023 with all surviving respondents from Rounds 1–3 as well as new partners.
In Rounds 1–3, the majority of the survey questions were administered through in-home interviews conducted using computer-assisted personal interviewing (CAPI). To reduce the time burden on respondents, a subset of questions, including several of our key measures, were asked through a leave-behind questionnaire (LBQ), which respondents were invited to complete and return by mail. In Round 4, the NSHAP administered the survey through three additional remote data collection methods (web, phone, pencil and paper) to a subset of respondents.
Respondents were asked whether they were providing care-giving assistance in the LBQ in Rounds 1–3 of data collection. In Round 4, respondents were asked if they were providing care-giving assistance in all the different modes of data collection. Care-giver burden was assessed only in the LBQ in Round 2 and in the web and phone data collection modes in Round 4. The social network roster was administered during the in-person interviews in Rounds 1–4 as well as in all the remote modes in Round 4. The social engagement variables that measure opportunities to interact with peripheral others (volunteering, attending group meetings) were asked in the LBQ in all rounds of data collection. The questions assessing the number of friends and religious service attendance were asked during the in-person interview in Rounds 1 and 2 and were moved to the LBQ in Rounds 3 and 4.
Analytic sample
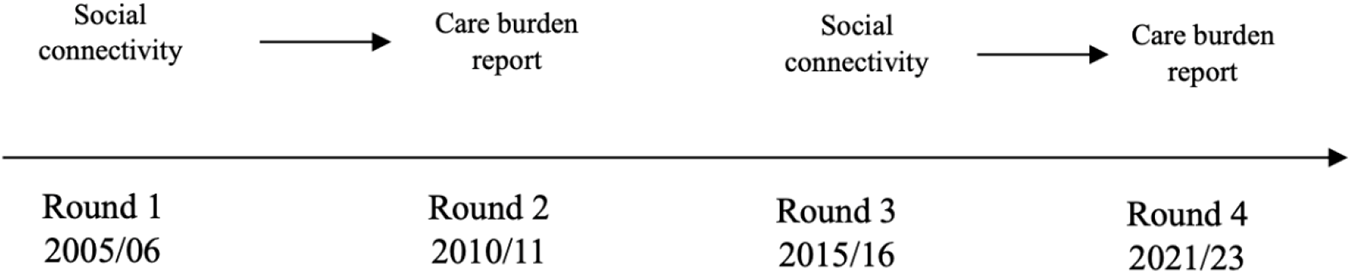
Because care-giver burden was assessed by the NSHAP only in Rounds 2 and 4, we included care-givers only from these two rounds for our analyses. To minimize potential bi-directionality between social connectivity and care-giver burden, we used the social network and social engagement variables (i.e. our independent variables) from the previous round (i.e. t-1) to predict care-giver burden in a particular round (i.e. time t). For instance, data on social network size from Round 1 were used to predict the likelihood of experiencing care-giver burden in Round 2. We applied a similar approach using social connectivity measures from Round 3 to predict care-giver burden in Round 4.
Respondents reported being a care-giver in 1,133 person-waves in Rounds 2 and 4 (N = 432 in Round 2, N = 701 in Round 4). Because our focus is on older adult care-givers, we included only respondents who were 55+ years old (N = 802). Of these, N = 757 provided reports of their care burden in the LBQ. We listwise deleted cases with missing data for covariates (N = 19), personal network characteristics (N = 148), social engagement (N = 117) and social support (N = 7) measures; missingness on all of these measures was weakly correlated with care-giver burden (r ≤ 0.13).
Finally, owing to the longitudinal nature of the data, it is possible that respondents could be included in the analytic sample twice if they provided data in all four rounds of the NSHAP; in other words, if they provided social connectivity measures in Rounds 1 and 3 and care-giver burden reports in Rounds 2 and 4. Only 2 per cent of respondents provided data across all four rounds (N = 11). To account for potential within-person correlation, we dropped these respondents from the analysis, resulting in a final analytic sample of N = 468 respondents. The age range of the final analytic sample is 60–91 years. Results including the full N = 479 yielded near identical results.
Measures
Care-giving
In Round 2, respondents were asked whether they are ‘currently assisting an adult who needs help with day-to-day activities because of age or disability’, with response options ‘yes’ or ‘no’. In Round 4 respondents were asked whether they are ‘currently helping a relative, partner or friend aged 18 or older take care of themselves because of a chronic illness or disability’, with response options ‘yes’ or ‘no’. In Round 4, if respondents offered unprompted details around the number of care-recipients or mentioned that they were providing care in a professional capacity, they were further recorded as ‘yes, more than 1 person’ and ‘yes, a client or patient’. We coded respondents as being a care-giver if they responded ‘yes’ in Round 2 and ‘yes’ or ‘yes, more than 1 person’ in Round 4. Because we are interested in understanding the experiences of informal care-givers, we excluded respondents who reported that they were providing care in a professional capacity in Round 4.
Care-giver burden
This variable was available only in Rounds 2 and 4 of the NSHAP dataset. Respondents who reported being a care-giver in Round 2 were asked in two separate questions whether they experienced financial and mental/emotional strain from care-giving. Response items ranged from 0 = ‘no strain’ to 2 = ‘a lot of strain’. In Round 4, respondents who answered ‘yes’ to the care-giving question were asked ‘Taken all things together, how much of a burden is this care-giving role for you?’, with response options including 1 = ‘not a burden at all’, 2 = ‘somewhat of a burden’, 3 = ‘a moderate burden’ and 4 = ‘very much a burden’. To ease comparability across care-giver burden measures, we dichotomize responses in both rounds of data collection to reflect any care-giver burden. Respondents were coded as experiencing care-giver burden in Round 2 if they reported 1 = ‘some strain’ or 2 = ‘a lot of strain’ for financial (28% of Round 2 care-givers) and/or mental/emotional strain (56% of Round 2 care-givers). Fifty-nine per cent of Round 2 care-givers experienced either or both types of strain. Respondents in Round 4 were similarly coded as experiencing care-giver burden if they reported any burden (> 1) (54% of Round 4 care-givers).
Social connectivity
We focus on two dimensions of social connection: personal network characteristics and broad social engagement. First, in relation to personal network characteristics, we derived network characteristics from the NSHAP’s ‘important matters’ name generator. For Rounds 1 and 3, respondents were asked to name up to five network members, or ‘alters’, with whom ‘you most often discussed things that were important to you’ over the past year. These alters represent strong ties. Then, respondents were asked to identify their relationship with each alter, choosing from 19 relationship categories (e.g. spouse/partner, friend, neighbour, etc.) and to report how frequently they interact with each alter and whether they currently co-reside with them. From these data, we constructed four network characteristics – size, diversity, proportion of co-residency and frequency of interaction – that collectively represent the structure of the respondent’s core discussion network.
Network size is the total number of alters named in the roster, ranging from 0 (no one named) to 5 (the maximum number allowable) (Cornwell et al. Reference Cornwell, Schumm, Laumann and Graber2009). Network diversity was calculated as the number of distinct relationship types captured among alters named in each respondents’ network, ranging from 0 (no alters named) to 5 (maximum number named, each representing a distinct relationship type). This measure is often used to operationalize network diversity – the number of different relationships among an individual’s core confidants – each of which is conceptualized as bringing unique social roles, environments and activities (Cohen et al. Reference Cohen, Doyle, Skoner, Rabin and Gwaltney1997; Ellwardt et al. Reference Ellwardt, Van Tilburg and Aartsen2015). Proportion of network that co-resides was calculated as the number of network alters who live with the respondent divided by total number of network alters named. We include this measure because living with social network members is associated with an increased likelihood of becoming a care-giver (Tennstedt et al. Reference Tennstedt, Crawford and McKinlay1993), and therefore is likely to be correlated with care-giver burden. Last, we calculated the average frequency of interaction by using respondents’ reports of ‘how often they talk’ to each named alter through any medium, with response items including 1 = ‘every day’, 2 = ‘several times a week’, 3 = ‘once a week’, 4 = ‘once every two weeks’, 5 = ‘once a month’, 6 = ‘a couple times a year’, 7 = ‘once a year’, 8 = ‘less than once a year’. We averaged the frequency of interaction across all named alters. We then reverse-coded the measure so that higher values reflect more frequent interaction.
Second, in relation to social engagement, we conceptualized social engagement as an indication of opportunities for interactions with casual acquaintances; thus, we included a series of items that collectively captured the level of each respondent’s broader social engagement. First, number of friends was assessed by asking respondents ‘about how many’ friends they think they have, with response options including 0 = ‘none’, 1 = ‘1’, 2 = ‘2–3’, 3 = ‘4–9’, 4 = ‘10–20’ and 5 = ‘more than 20’. Next, three separate items asked respondents ‘In the past 12 months, how often did you …?’, then assessed respondents’ frequency of (1) ‘volunteering work for religious, charitable, political, health-related or other organizations’; (2) ‘attending meetings of any organized group (e.g. a choir, a committee or board, a support group, a sports or exercise group, a hobby group or a professional society)’; and (3) ‘attending religious services’. Response options ranged from 1 to 7 to denote 1 = ‘several times a week’, 2 = ‘every week’, 3 = ‘about once a month’, 4 = ‘several times a year’, 5 = ‘about once or twice a year’, 6 = ‘less than once a year’ and 7 = ‘never’. We reverse-coded and re-scaled these measures so that larger values indicate more frequent social engagement (6 = ‘several times a week’) and smaller values indicate less frequent social engagement (0 = ‘never’).
To address Research Question 2 (Do breadth and depth of social engagement matter?), we created dichotomous measures for each of the four social engagement variables to indicate high frequency: for number of friends, 1 indicates ‘10 or more friends’ and 0 indicates ‘fewer than 10 friends’. We chose 10 as a cut-off for number of friends for analytical reasons. Very few respondents reported having none (2%) or one (2%) friend and about 18 per cent of respondents reported having more than 20 friends. The category ‘10 or more’ friends captures about 40 per cent of the sample (data available upon request). For frequency of engaging in each of the three social activities, 1 indicates at least weekly engagement in ‘meetings with organised groups’, ‘volunteering’ and ‘attending religious activities’ and 0 indicates anything less than weekly engagement. We used a weekly threshold to identify participants with a high level of informal social participation (Yang et al. Reference Yang, Kotwal, Lisha, Wong and Huang2021; Schafer et al. Reference Schafer, Sun and Lee2022). To examine participation in diverse social activities, we created a continuous measure that sums up the number of social activities in which the respondent engages at least weekly; this measure ranges from 0 to 3.
Regarding key covariates, we included the following key covariates that are known to be associated with social connectivity and care-giving experiences in our models. In relation to social support, all models included measures of respondents’ perceptions of social support from both friends and family. Respondents were asked how often they could open up to their friends and how often they could rely on them. Respondents were asked these same two questions about their family members. Response options for each question ranged from 1 = ‘hardly ever (or never)’ to 3 = ‘often’. We averaged the scores for friend support and averaged the scores for family support.
We calculated age in years as the difference between respondents’ self-reported date of birth and the date of the interview. We included a dichotomous measure indicating whether a respondent was ‘married or living with a partner’, with ‘not married/not living with a partner’ at the time of the interview as reference. We also included interviewer-coded respondent ‘gender’, with ‘male’ as the reference category. Race/ethnicity was coded as ‘Black/African American’ and ‘Hispanic’, with ‘White’ as reference. Those coded as ‘other’ (2% of the care-giver sample) were dropped from the analyses owing to the small sample size. Educational attainment was self-reported and included ‘less than high school’ (reference), ‘high school or equivalent’, ‘some college/associate degree’ and ‘Bachelor’s or more’. We also accounted for self-reported physical health, which was rated on a scale of 1 = ‘poor’ to 5 = ‘excellent’, as well as an indicator variable for whether the respondent was currently working. Last, we included a dichotomous measure indicating round of data collection (Round 2 as reference).
Analytic approach
We modelled the probability of older adults experiencing care-giver burden using logistic regression models. We tested how distinct dimensions of social connectivity (social network characteristics and social engagement) were associated with the likelihood of care-giving adults aged 60 years or older experiencing care-giver burden in separate models owing to multi-collinearity effects between the social connectedness measures. We also control for social support and other key factors in the models. To estimate our models, we used logistic regression in the form of the following:
 \begin{equation*}ln\left({\begin{array}{*{20}{c}}
p \\
{1 - p}
\end{array}}\right) = {{\alpha }} + \mathop \sum \left({\beta _{k}} \right)\left( {X_{k}} \right)\end{equation*}
where p is the probability of experiencing care-giver burden, p/1-p is the odds of experiencing care-giver burden, α is a constant term, βk are the effects parameters of the explanatory variables (e.g. social network characteristics) and Xk are the explanatory variables in the model. Results are presented as odds ratios, with an odds ratio greater than 1 indicating greater odds of experiencing care-giver burden and a ratio less than 1 indicating lesser odds.
Figure 1 illustrates the temporal relationship between the main measures of interest. The primary independent variables are measures of social connectivity, specifically social network characteristics and social engagement. These measures were lagged one round (t-1) relative to the focal measure of care-giver burden status (t).
Depiction of the temporal ordering of key measures of interest.

Additionally, respondents’ reports of social support were also lagged one data collection round. This lagging technique helps ensure that we captured the social experiences that occurred prior to reports of care-giver burden, thus reducing the potential for reverse causation effects. Owing to slight differences in the question wording to capture care-giving status and care-giver burden between Round 2 and Round 4, we also estimated additional models among a subset of responses from Rounds 1 and 2 (analyses not shown but available upon request). These models produced results nearly identical to the larger dataset. Consequently, we present results from the pooled data of both rounds to benefit from a larger sample size.
The personal network characteristic variables and the four social engagement variables were included as continuous measures in separate models displayed in Table 2 given the nature of Research Question 1 (does social connectivity matter in general). In the models described in Table 3 that examine the breadth and depth of social engagement on care-giver burden, we used the dichotomous social engagement variables. For the final model examining how participation in diverse social activities was correlated with care-giver burden, we included a continuous measure of the number of social activities in which the respondent engages at least weekly.
Results
Descriptive and bivariate statistics
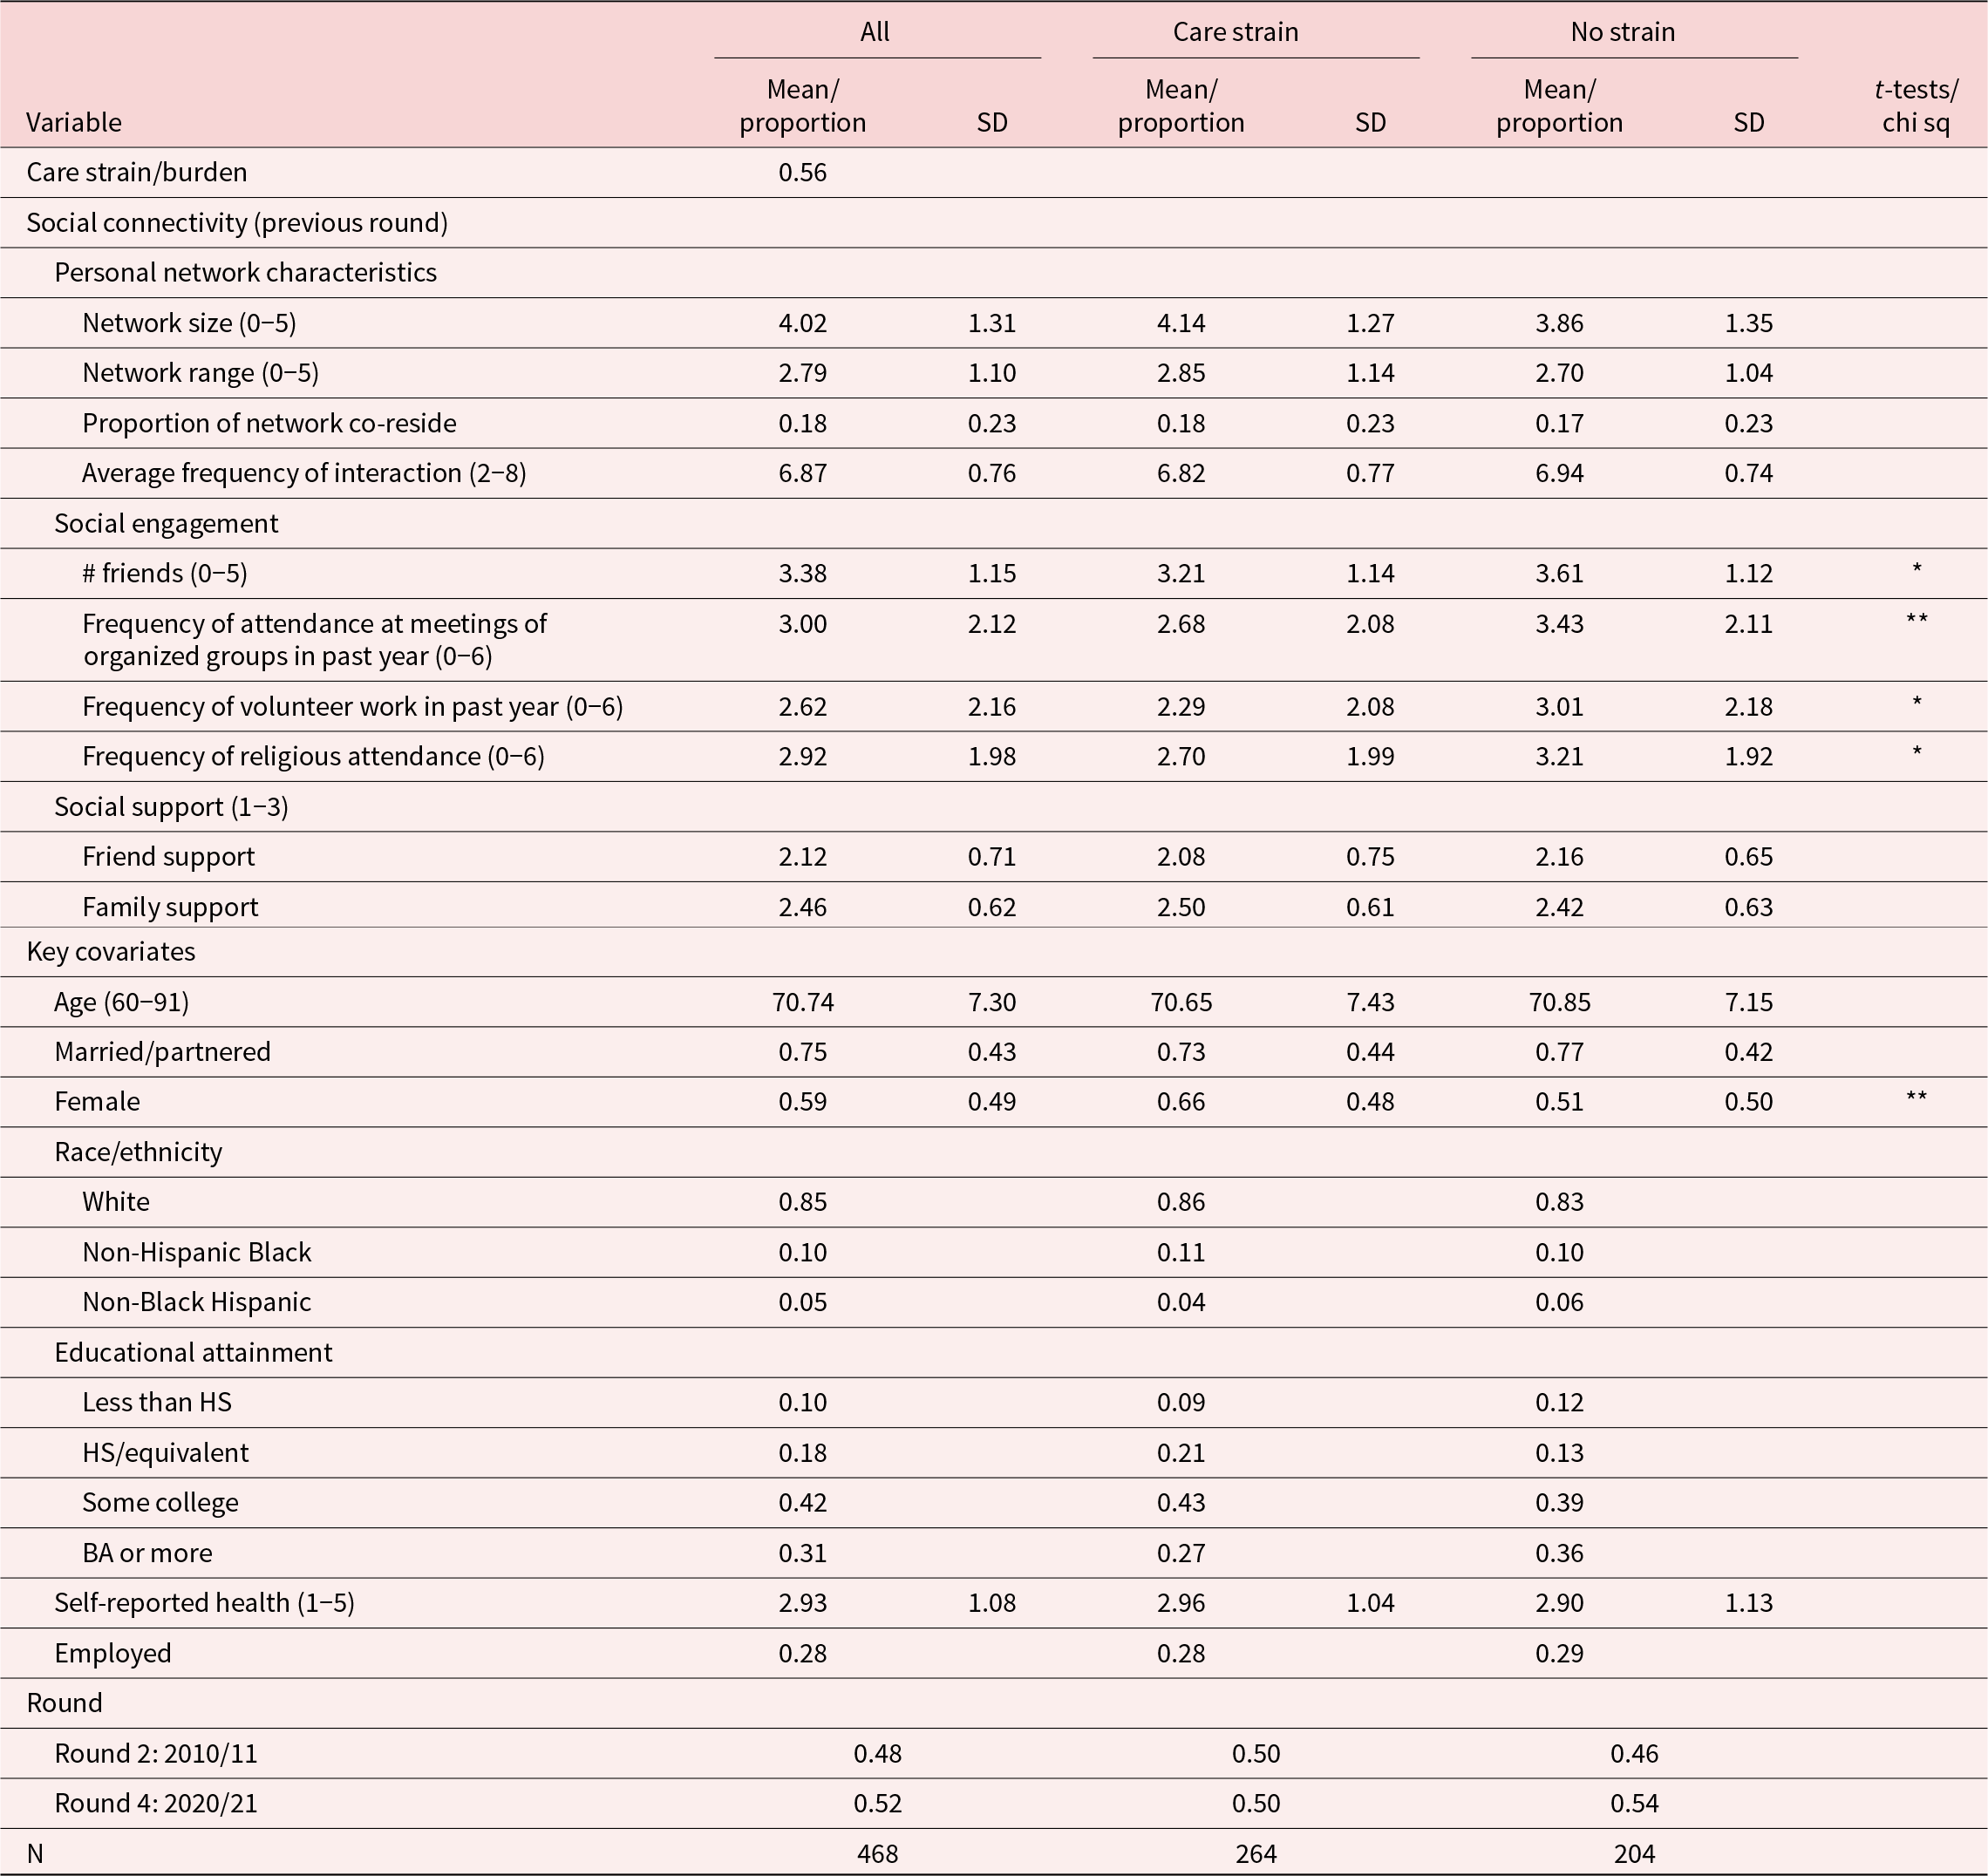
Table 1 presents baseline descriptive statistics for all care-givers (left-most columns) and by care burden status; statistics for respondents who reported experiencing any burden are in the middle columns and those who reported no burden are in the right-most columns. Overall, 56 per cent of care-givers reported some burden. The mean age for all care-givers was 70.7 years (SD = 7.3). Seventy-five per cent of the sample was married or living with a partner and 59 per cent were female. The majority of respondents identified as White (85%), 10 per cent reported being Black, and 5 per cent identified as Hispanic. Forty-two per cent of respondents attained some college, followed by BA or more (31%), high school or equivalent (18%) and less than high school (10%). Respondents reported being in ‘good’ health on average (M = 2.93, SD = 1.08), and 28 per cent were employed. Across the full sample (N = 468), 52 per cent of care-giving reports occurred in Round 4. Across care burden status, only gender was statistically significant (p < 0.01); 66 per cent of those experiencing any care-giver burden were female.
Descriptive statistics of care burden, social network characteristics, social engagement and key covariates for the entire sample and by care-giving experiences (N = 468)

Table 1 Long description
Descriptive statistics compare care-givers reporting any care strain (N = 264) versus no strain (N = 204), plus results for the overall sample (N = 468), across social connectivity, engagement, support, and demographics. Care strain prevalence is 0.56 overall. Personal network characteristics are similar across groups: network size about 4.14 with strain versus 3.86 without, network range about 2.85 versus 2.70, co-residence proportion about 0.18 versus 0.17, and interaction frequency about 6.82 versus 6.94. Social engagement is consistently lower among those with care strain, with fewer friends (3.21 versus 3.61) and lower participation in organized groups (2.68 versus 3.43), volunteering (2.29 versus 3.01), and religious attendance (2.70 versus 3.21); these differences are marked as statistically significant. Friend and family support scores are close between groups (friend support 2.08 versus 2.16; family support 2.50 versus 2.42). Age is similar (about 71 years), while the care strain group has a higher proportion female (0.66 versus 0.51), also marked as statistically significant. Race, education, health, employment, and survey round distributions are provided as proportions and show no flagged group differences in this table. Significance markers indicate group mean differences from standard tests, but the table is descriptive and does not establish causation.
Notes: SD = standard deviation. Results are from t-tests and chi-square tests of significance of group means between care-giving respondents who do and do not experience care burden.
Significance levels: *p < 0.05, **p < 0.01, ***p < 0.001.
Regarding social network characteristics, care-givers in general reported an average network size of 4.02 (SD = 1.31), an average of 2.79 (SD = 1.10) different relationship types, and co-residing with 18 per cent of named network alters. They reported an average frequency of interaction with network members of 6.78 (SD = 0.76), or between once a week and several times a week. For broader social engagement, respondents reported having an average of somewhere between 4–9 and 10–20 friends (M = 3.38, SD = 1.15). In the last year, they reported attending meetings of organized groups several times a year (M = 3.00, SD = 2.12), volunteering between once or twice a year and several times a year (M = 2.62, SD = 2.16) and attending religious activities close to several times a year (M = 2.92, SD = 1.98). Lastly, they reported some friend (M = 2.12, SD = 0.71) and slightly more family support (M = 2.46, SD = 0.62).
Across care burden status, those who experienced burden reported significantly fewer friends (M = 3.21 {closest to 2–3 friends} versus M = 3.61{closer to 4–9 friends}; p < 0.05) and participated significantly less frequently in meetings of organized groups (M = 2.68 { < several times a year} versus M = 3.43 { > several times a year}; p < 0.01) and volunteering (M = 2.29 {about once or twice a year} versus M = 3.01 {several times a year}; p < 0.05). They also attended significantly fewer religious activities (M = 2.70 versus 3.21; p < 0.05) than those who did not experience burden.
Multivariable models
Research Question 1 (social connectivity in general)
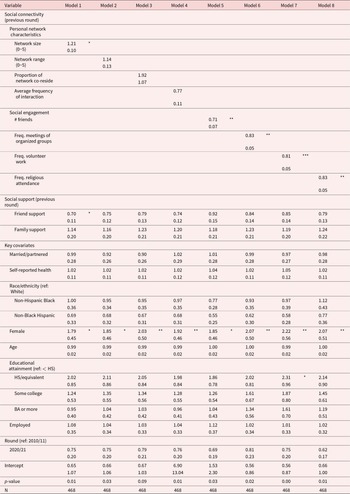
We then tested the associations between social network characteristics and social engagement and the likelihood that older adult care-givers experienced care-giver burden. Table 2 presents results from a series of logistic regression models testing the association of care-giver burden with separate, distinct dimensions of strong in-network social ties (Models 1–4) and social engagement (Models 5–8). We estimated separate models owing to strong collinearity between many of our predictors of interest: the correlation between network size and network diversity was r = 0.66 and the correlation between attending meetings and volunteering was r = 0.65. We also estimated separate models owing to the nature of our first research question, which was to assess these associations generally, rather than compare their relative predictive power.
Logistic regression models regressing the likelihood of experiencing care burden onto social connectivity and key covariates among care-givers (Research Question 1: any association), converted into odds ratios

Table 2 Long description
Eight logistic regression models estimate odds of experiencing caregiver burden from prior-round social connectivity and support, adjusting for demographics and survey round. Social engagement measures show consistent protective associations and are associated with lower odds of reporting care burden: more friends in Model 5 (odds ratio 0.71, statistically significant), organized group meeting frequency in Model 6 (0.83, significant), volunteering frequency in Model 7 (0.81, significant), and religious attendance in Model 8 (0.83, significant). Regarding personal network structure, only network size was associated with care burden and larger network size increased the odds of reporting greater care burden: network size in Model 1 (1.21, significant) Network range (1.14), co-residence proportion (1.92), and interaction frequency (0.77) are not significant. Friend support is associated with lower odds in Model 1 (0.70, significant) but is not significant in other models; family support is not asscociated with care burden across models. Female caregivers have higher odds of care burden in every model (about 1.79 to 2.22, significant), while marital status, age, employment, race and ethnicity, and self-rated health show n association. Sample size is 468 in all models, and results should be interpreted as associations rather than causal effects.
Notes: Standard errors are presented below odds ratios.
Significance levels: *p < 0.05, **p < 0.01, ***p < 0.001.
Regarding strong in-network social ties, having larger personal networks was statistically significantly associated with increased odds of experiencing care-giver burden. Specifically for each additional network alter, the odds increased by 21 per cent (Model 1, p < 0.05). None of the other social network variables were statistically significantly associated with care-giver burden (Models 2–4).
Regarding broader social engagement, all types decreased care-givers’ odds of experiencing care-giver burden. Specifically, a greater number of friends decreased the odds of care-giver burden by 29 per cent (Model 5; p < 0.01), more frequent attendance in organized groups decreased the odds by 17 per cent (Model 6; p < 0.01), more frequent volunteering decreased the odds by 19 per cent (Model 7; p < 0.001) and more frequent religious attendance decreased the odds by 17 per cent (p < 0.01). Regarding the covariates, only gender was statistically significantly associated with older adult care-givers’ odds of experiencing care-giver burden, with female respondents having much larger odds (p < 0.01 or p < 0.001 across all models in Table 2).
Research Question 2 (breadth and depth of social engagement)
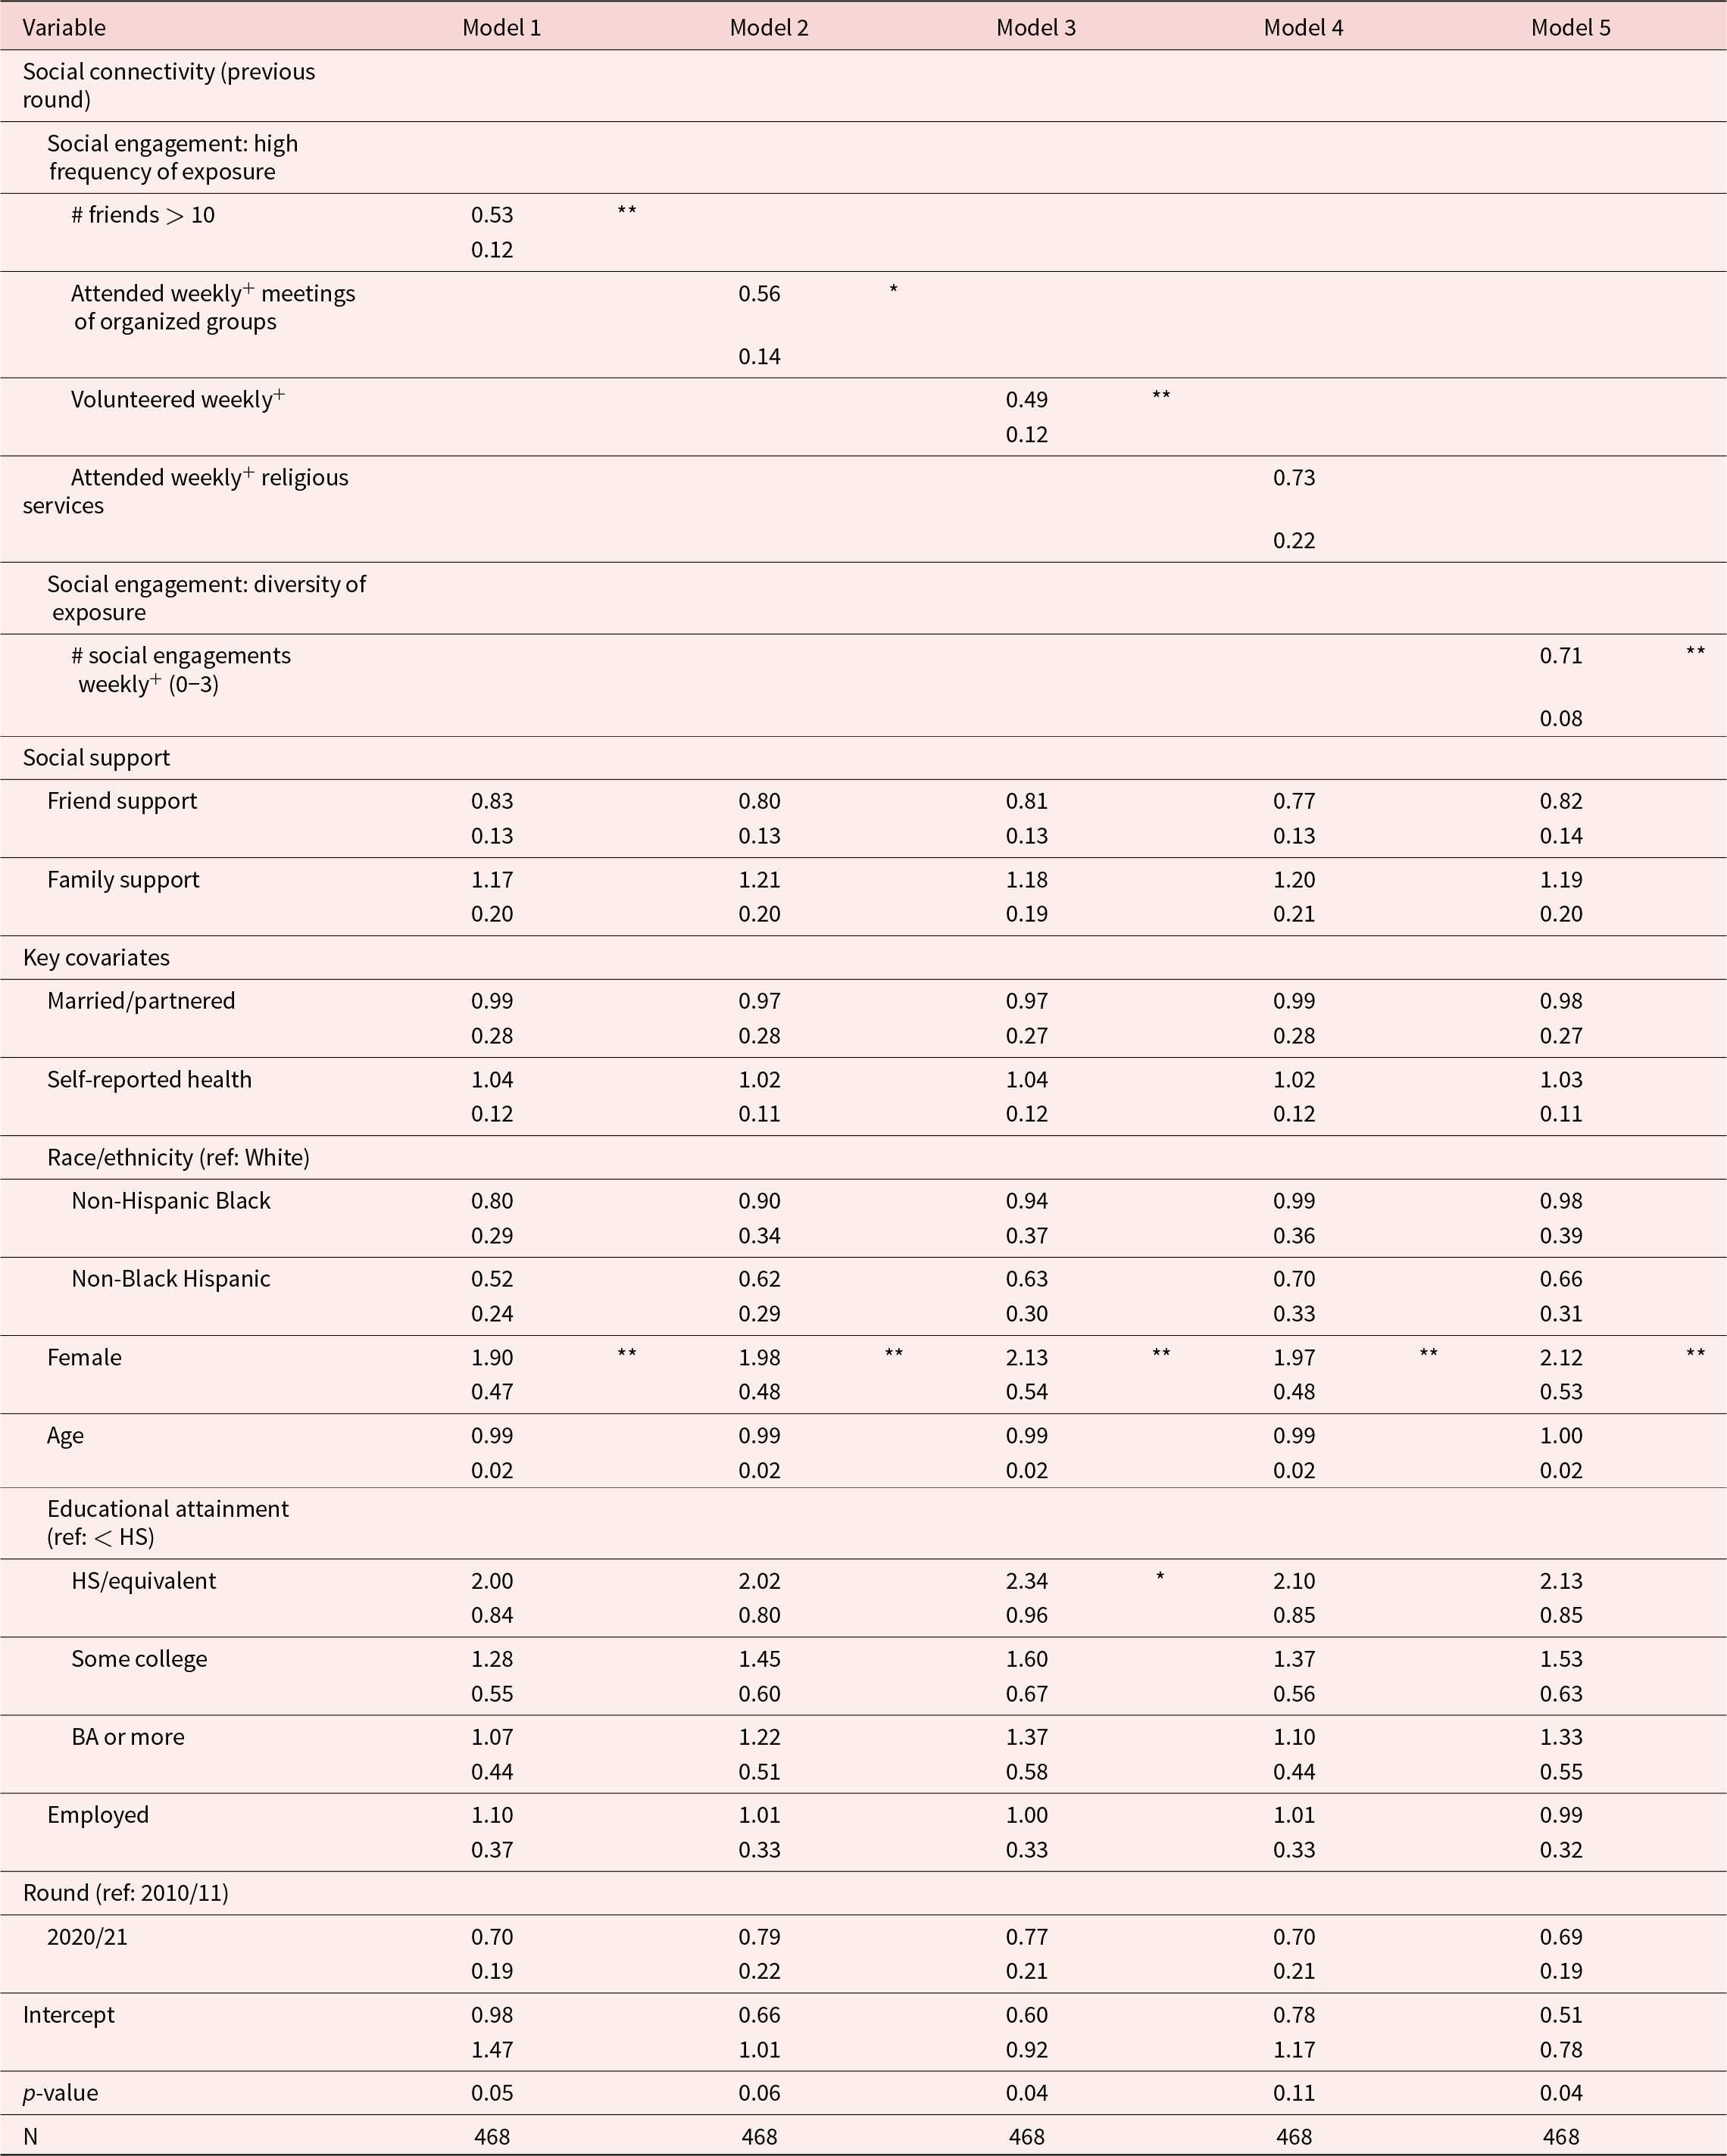
Table 3 addresses our second research question: given that social engagement matters, does the breadth and/or depth of social engagement matter for care-giver burden? We focus first on high frequency of exposure, estimating how 10+ friends (Model 1) and at least weekly engagement in meetings of organized groups (Model 2), volunteering (Model 3) and religious activities (Model 4) shaped the odds of experiencing care-giving burden.
Logistic regression models regressing the likelihood of experiencing care burden onto social connectivity and key covariates among care-givers (Research Question 2: do breadth and depth of social engagement matter), converted into odds ratios

Table 3 Long description
Odds ratios from five logistic regression models estimate care-givers’ likelihood of experiencing care burden as a function of prior-round social connectivity measures plus covariates. High-frequency engagement is linked to lower burden: having more than 10 friends is associated with lower odds in Model 1 (0.53, statistically significant), attending organized group meetings weekly or more is associated with lower odds in Model 2 (0.56, significant), and volunteering weekly or more is associated with lower odds in Model 3 (0.49, significant). Weekly or more religious attendance in Model 4 was not statistically significantly associated with lower odds of care burdern (0.73). Greater diversity of social engagement is protective: each additional type of weekly social engagement (range 0 to 3) is associated with lower odds in Model 5 (0.71, significant). Friend support and family support show odds ratios near 1 across models and are not marked significant. Among covariates, being female is consistently associated with higher odds of care burden across all models (about 1.90 to 2.13, significant), while most other covariates, including marital status, health, age, employment, race and ethnicity, and survey round, are not marked significant. All models use the same sample size of 468, and standard errors are reported beneath each odds ratio.
Notes: Standard errors are presented below odds ratios.
Significance levels: *p < 0.05, **p < 0.01, ***p < 0.001.
Results suggest that high frequency – many friends or weekly engagement – does indeed matter: older adults with 10+ friends have decreased odds of experiencing care-giver burden (47% lower odds; p < 0.01) compared with those with fewer than 10 friends. Similarly, compared to those who engaged less frequently, those who participated at least weekly in meetings of organized groups (44% lower odds; p < 0.05) and volunteering (51% lower odds; p < 0.01) have significantly decreased odds of experiencing care-giver burden. Attending religious services at least weekly was not significantly associated with care-giver burden (Model 4). Key covariates operated similarly as in Table 2, with significantly increased odds for women to experience care-giver burden across all models.
We focus next on diversity of exposure, testing whether the count of activities in which a respondent engages weekly influences care-giver burden. Results in Model 5 suggest that being highly engaged in a variety of social activities (i.e. a higher number) protects against an older adult care-giver’s likelihood of experiencing care-giver burden: with each additional activity in which an older adult care-giver engages at least weekly, their odds of reporting care-giver burden decreased by 29 per cent (p < 0.01).
Discussion
While strong social network ties have been documented to promote health among older adults, results from the current study demonstrate that this is not true for the burden experienced by care-givers. We have shown that having a larger number of strong network ties, ironically, increases the likelihood of a care-giver experiencing burden. In contrast, opportunities to interact with peripheral others, as measured through participation in a variety of different social activities, were much more likely to reduce care-giver burden, even when we controlled for friend and family support. While previous research on social variables and care-giver burden has primarily focused on the role of social support in mitigating burden (Chiou et al. Reference Chiou, Chang, Chen and Wang2009; Clay et al. Reference Clay, Roth, Wadley and Haley2008; Lee and Choi Reference Lee and Choi2013; Rodakowski et al. Reference Rodakowski, Skidmore, Rogers and Schulz2012; Ruisoto et al. Reference Ruisoto, Contador, Fernández-Ccalvo, Serra, Jenaro, Flores, Ramos and Rivera-Navarro2020; Xu et al. Reference Xu, Liu, He, Fields, Ivey and Kan2021), our findings highlight the importance of considering other social resources – such as social engagement and, by extension, weak ties – in care-givers’ wellbeing.
Our findings demonstrate the important role that casual interactions play in promoting care-giver wellbeing, corroborating research on the important psychosocial resources that weak ties provide (Sandstrom and Dunn Reference Sandstrom and Dunn2014a, Reference Sandstrom and Dunn2014b; Moreton et al. Reference Moreton, Kelly and Sandstrom2023) and aligning with research on the importance of weak ties for older adults’ wellbeing (Huxhold et al. Reference Huxhold, Fiori, Webster and Antonucci2020; Pan and Chee Reference Pan and Chee2020; Lam et al. Reference Lam, Broccatelli and Baxter2023). The difference in how social network ties and social engagement are associated with care-giver burden is striking. Although we do not have the data to test all these possibilities, we provide several potential explanations for why social network ties and social engagement are associated with care-giver burden in divergent ways.
First, because care-giving is often provided to core network members (Broese van Groenou and De Boer Reference Broese van Groenou and De Boer2016), these strong social ties may create the experience of care burden. As both an individual and their social network members age, it is increasingly likely that a network member will need care-giving assistance. Thus, older adults that have a greater number of confidants may experience greater burden because of the greater need to function as a care-giver for a larger number of individuals.
Second, it is also possible that for care burden, core social network members may not be the most effective source of social support. If a core network member is the care recipient, this network member may no longer be able to offer psychological, emotional or material support to the care-giver, especially if they require care-giving assistance owing to cognitive decline or physical disability. In addition, care-givers may be reluctant to discuss the nature of the care they are providing with other core network members who may also know the care recipient. Another possibility is that the role that strong ties play in social support is complex; Small et al. (Reference Small, Brant and Fekete2024) found that individuals are equally likely to avoid strong ties as they are to talk to them. An individual may be reluctant to confide in network members whose opinions they care about most owing to reputational concerns and the desire to preserve face and avoid stigma (Small et al. Reference Small, Brant and Fekete2024). We do not have the data to test these potential explanations; however, future research could examine whether the increased odds of experiencing care-giver burden associated with a larger social network of close ties stems from the fact that care-givers are providing care to those ties, or if close ties are simply less helpful in alleviating care-giver burden.
Third, social engagement may be associated with reduced odds of care-giver burden because regular in-person interactions with peripheral others may help to alleviate the stresses that care-givers face. Care-giving responsibilities and stresses may fluctuate from week to week, and having scheduled weekly social meetings may allow care-givers to talk about these stresses with others or to momentarily forget about these stresses by engaging in a meaningful activity.
We also found that more frequent and more diverse social engagement is protective of care-giver wellbeing. Frequent social activities may be especially helpful for care-givers as they have more opportunities to engage in an activity with others to alleviate stress. Diversity of social activities may also matter because the social ties who participate in each separate sphere of social activity are likely to be different; engaging in multiple social activities can allow individuals to connect to a diverse set of weak ties, enhancing access to novel information and resources. This also helps explain why strong ties do not reduce care-giver burden – since their social circles overlap, they may not be able to connect care-givers to resources that support them in their role as care-givers (e.g. support groups, a reputable assisted living facility, skilled in-home nursing care, etc.).
There are limitations to our findings. First, we assumed that social engagement involves interactions with casual acquaintances and that the benefit of social engagement is owing to the increased opportunity to socially engage with weak ties. It is possible that there are other mechanisms that drive the association between social engagement and lower levels of care-giver burden. Future research can examine the mechanisms by which social engagement reduces care-giver burden.
Second, socio-economic status is associated with the likelihood of volunteering (Wilson and Musick Reference Wilson and Musick1998; Tang Reference Tang2008) and informal care provision (Quashie et al. Reference Quashie, Wagner, Verbakel and Deindl2022). Acknowledging the impact of socio-economic status on our independent and dependent variables, we controlled for educational attainment and employment status in our models as a proxy for socio-economic status. Among older adults, some of whom are retired, income does not adequately reflect financial resources, and the measure contains a lot of missing data. Therefore, we included educational attainment as a proxy for socio-economic status and included employment status to reflect financial need and the amount of free time available to attend social activities and to provide care. Even when we controlled for employment status and educational level, our results showed that social engagement was associated with reduced odds of experiencing care-giver burden among those who became a care-giver in our sample.
Third, an individual’s tendency to socially engage may also shape how they perceive their care-giving responsibilities – this was not controlled for in our study. For instance, individuals who volunteer or attend religious services may be motivated to engage in social activities because of altruism and spirituality – this altruism may also incline these individuals to take on the role of an informal care-giver and help them derive meaning from their care-giving role, which may help to buffer against care-giver burden. Indeed, empirical research has found that older adult care-givers are more likely to volunteer than are non-care-givers (Burr et al. Reference Burr, Choi, Mutchler and Caro2005), and that care-givers have found that their volunteering activity can benefit their care-giving role (Crittenden et al. Reference Crittenden, Coleman and Butler2022).
While there is a possibility that internal motivations that predispose an individual to socially engage and to become a care-giver explain the finding that social engagement reduces care-giver burden, our results show that all social activities, including attending group meetings (which may include hobby groups), are associated with lower odds of experiencing care-giver burden. This suggests that there is something about attending social activities – regardless of the content of the activity or the motivation for attending – that provides psychosocial resources to help care-givers cope with their role. Being in a social space exposes individuals to opportunities to interact, to receive psychosocial support from others and to help bolster feelings of belonging, all of which can help care-givers weather the stresses of their responsibilities.
Fourth, care-giver burden was assessed with a non-standardized tool, and the survey question wording differed slightly between Round 2 and Round 4. Although a standardized tool would provide more nuanced and valid data about the burden that care-givers experience, the questions in the NSHAP ask care-givers about their overall subjective experience of burden, which can nevertheless provide useful information about care-givers’ overall perceptions of their care-giving experience. However, future research can use a validated care-giver burden measure to replicate our findings.
Additionally, although the NSHAP asked respondents about providing care to an adult who required assistance, the survey did not assess whether respondents were also providing grandparenting care. Simultaneously caring for both an adult and a young child may increase care-giver burden; however, we were unable to examine or control for the potential effects of grandparenting responsibilities on care-giver burden. Future research should investigate how grandparenting responsibilities influence older adults’ care-giving experiences.
Lastly, there is a five-year interval between the reports of social engagement and social network characteristics and the report of care-giver burden. Within this time frame, there could have been changes in levels of social engagement, social network characteristics and care-giving responsibilities that confounded our findings. Future research can use shorter time intervals to replicate these findings.
Despite these limitations, our results enable us to propose a conceptual shift in thinking about care-giver burden as the product of differing levels of social embeddedness. Strong social ties are the precipitating factors that start the transition into care-giving (Broese van Groenou and De Boer Reference Broese van Groenou and De Boer2016) and, as our results indicate, are also associated with increased care burden. On the other hand, social engagement and interactions with peripheral others help to offset care-giver burden.
Although studies have highlighted the importance of social support for care-givers’ wellbeing, little attention has been paid to which social ties provide support. Our findings suggest that peripheral ties that individuals engage with during social activities may be salient sources of support. These results highlight the need for policy recommendations to encourage care-givers to regularly engage in social activities. Additionally, services assessing the wellbeing of care-givers can include a consideration of care-givers’ level of social engagement as a risk factor for experiencing burden and perform outreach to those with low levels of social engagement.
Peripheral social ties may play a larger role in promoting care-giver wellbeing than strong ties because they provide valuable psychosocial resources without making the same reciprocal demands as strong ties. Because strong and weak social ties play different, and sometimes contradictory, roles in care-givers’ wellbeing, we suggest that research focused on examining the role of the social environment in care-givers’ health should take into consideration the totality of an individual’s social network and their broader social environment, including levels of social engagement. Examining the broader social networks of care-givers will contribute to our understanding of how care-giver burden is created, alleviated and the role of the social world in these processes.
Financial support
All research reported in this article was supported by the National Institute on Aging of the National Institutes of Health (grant numbers: R01AG048511 and R01AG043538; PI: Waite, and R56AG083174; PI: Piedra) and by a grant from the Center for Healthy Aging Behaviors and Longitudinal Investigations (1P30 AG066619). Lissette M Piedra was also supported by an administrative supplement (3R01AG048511-08S1). The content is solely the responsibility of the authors and does not necessarily represent the official views of the National Institutes of Health, the Center for Healthy Aging Behaviors and Longitudinal Investigations, or NORC at the University of Chicago.
Competing interests
The authors declare none.
Ethical standards
The survey data used for our analyses are publicly available through NACDA. Because we used secondary data, no ethical approval was necessary.