We analyzed publication patterns in 96 leading political science journals between 1990 and 2013 and extracted a co-author network capturing the social structure of the international political science community. Other than outlining how political scientists’ publishing has changed in nearly a quarter-century, this is the first study that maps out how the individuals who comprise our profession actually collaborate to achieve scientific progress. Of course, two points regarding the scope of the research must be mentioned: (1) monographs and chapters in edited volumes are also important outlets for research but we chose to devote our attention to journals because they are regularly regarded as the discipline’s “gold standard” and (more mundane) because comprehensive information on chapters (somewhat less on monographs) is still unavailable in digital form; and (2) because focusing on leading journals means focusing on English-speaking journals, the role of scientists publishing predominantly in other languages or in specific national communities is certainly undervalued in our work. However, the fact remains that the bigger impact of English publications implies that our study most likely will still capture the core of our discipline.
Several bibliometric analyses examined publication patterns in political science (Brush Reference Brush1996; Keeler Reference Keeler2005) and in subgroups including female researchers (Williams et al. Reference Williams, Bates, Jenkins, Luke and Rogers2015), national communities (Plümper and Radaelli Reference Plümper and Radaelli2004), and university departments (Forrester Reference Forrester1996). Other studies found collaboration to be increasing, particularly in quantitative work and American politics (but not political theory) and between female and male researchers (but less among women) (Fisher et al. Reference Fisher, Cobane, Vander Ven and Cullen1998; McDermott and Hatemi Reference McDermott and Hatemi2010). Yet, network approaches still remain scarce, focusing regularly on international relations alone and mostly linking publications via common cited sources (Kristensen Reference Kristensen2012; Russett and Arnold Reference Metz and Jäckle2010) thus portraying the interrelationship of ideas but not of the individuals who propose them. To date, only three studies have analyzed co-authorships (Arzheimer and Schoen Reference Arzheimer and Schoen2009; Metz and Jäckle Reference Metz and Jäckle2013; Leifeld and Ingold Reference Leifeld and Ingold2015); however, they analyzed only political science communities in Germany, Switzerland, Austria, and the United Kingdom—in contrast to the natural sciences, in which this type of analysis is both more common and more global (Barabási et al. Reference Barabási, Jeong, Néda, Ravasz, Schubert and Vicsek2002; Newman Reference Newman2004).
THE DATASET
Our dataset consisted of 67,414 articles published between 1990 and 2013 in 96 journals classified as “political science” in the Social Sciences Citation Index (SSCI) that, in 2011, had either a one- or a five-year impact factor of 1.0 or greater. Footnote 1 Authors’ names were edited and normalized to ensure a consistent dataset and an accurate network. Footnote 2 To obtain an impression of the matters on which a researcher works, we also surveyed the journals’ aim and scope. From these, we coded how much the journals subscribed to the fields of (1) comparative or domestic politics (CP); (2) political theory and philosophy (PT); and (3) international relations, regional and European studies (IR). Footnote 3 Additionally, we ranked journals according to whether their authors were mainly political scientists or whether political scientists were only one group among others. Footnote 4 Assigning a color to each subfield (i.e., CP = red, PT = green, IR = blue) allowed us to treat an author’s papers as a specific contribution, the mixture of which resulted in the author’s overall “color” (i.e., subfield association). For example, authors publishing only in CP were coded red, whereas those working exclusively in IR were blue; writers contributing equally to both fields were purple. Authors in all fields and/or publishing in general-purpose (GP) journals with no clear subfield association were white (i.e., an equal mixture of red, green, and blue).
BIBLIOMETRIC ANALYSIS
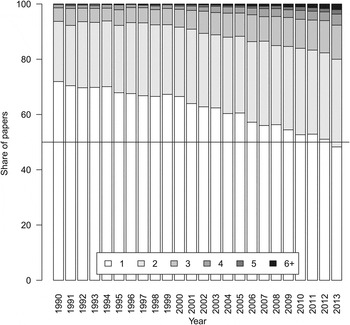
Of all the papers in our database, 60.5% were written by a single author (i.e., 27.6% by two authors, 8.3% by three authors, and 2.2% by four authors). The largest paper had 55 authors and was titled “Medical Planning and Response for a Nuclear Detonation: A Practical Guide” in Biosecurity and Bioterrorism. However, these aggregate figures mask a strong trend toward interconnection (figure 1): whereas in 1990, the average number of authors’ names on a paper was still 1.36, it has risen steadily to 1.93 names in 2013, the first year in which papers published in co-authorship became the modal category.
Number of Authors Per Paper, 1990–2013

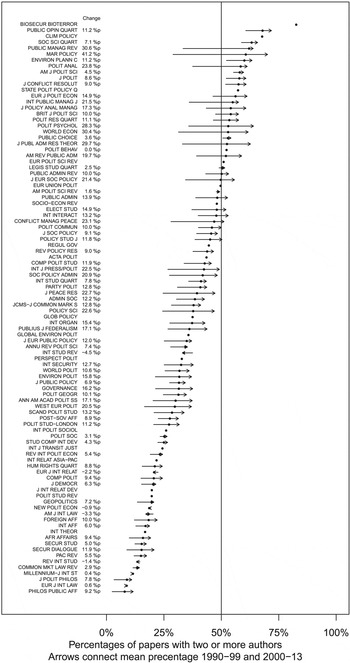
Across journals, there is a significant variation in co-authorship. Whereas only 7.9% of papers published in Philosophy and Public Affairs were written by multiple authors, the corresponding figure is 82.6% for Biosecurity and Bioterrorism. However, a trend toward multiple authors is visible across all journals (figure 2). In all but five cases, co-authorship has increased, yet the pace is different across the spectrum. This trend is strongest in empirically and/or economically oriented publications but also in GP journals and periodicals read by natural scientists. Although the norms of authorship are already diverse across political science, it seems that they are increasingly diverging. Yet, although increased quality of research often is considered a reason for collaboration (McDermott and Hatemi Reference McDermott and Hatemi2010, 50), we could not relate it to co-authorship—that is, correlating the number of authors on a paper with a journal’s impact shows that it is not easier for research teams to publish in higher-ranked journals (r = 0.04 for 1-year impact; 0.09 for 5-year impact). Applying the Gini index to the number of different authors in a journal indicated considerable variation relative to the concentration of a journal’s author base (i.e., from 0.06 for Annual Review of Political Science to 0.34 for Electoral Studies).
Development of the Share of Co-Authored Papers (By Journal)

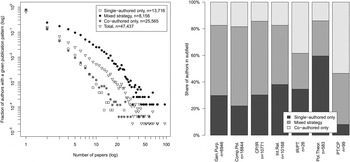
Our dataset contained 47,437 individual authors that, on average, had their name on 2.26 papers (i.e., the mean number published by one author is 0.86; for those written with others, it is 1.40). The distribution of output across authors is highly skewed. Whereas 64.3% published only a single paper during our observation period, 15.2% had written two and 6.6% had written three. The distribution for authors who only published alone, only published with others, and have done both (figure 3) reveals that the skew is similar across subgroups: authors following the mixed strategy are clearly the most productive, whereas there is no major difference in the output of the other two groups. We can only guess why publication activity within the field of political science was so highly transient, with most authors appearing only once before leaving the dataset. It is possible that they were graduate or PhD students publishing parts of their work before leaving for other professions or it may reflect difficulties in getting established in academia. When we subdivided the three different styles of publication across the different subfields (derived from journal scopes), it became clear that co-authorship is particularly popular in comparative politics.
Productivity by Publication Mode (Left) and Publication Mode by Subfield (Right)

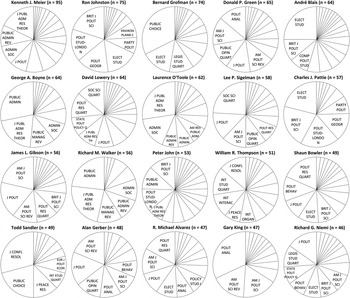
Of all the authors, the most productive individuals were Kenneth J. Meier (95 papers), Ron Johnson (75), and Bernard Grofman (74), all of whom have written with other authors. Among those always working alone, the numbers were lower but still highly impressive; the most productive researcher was Kurt Weyland (25 papers). Figure 4 indicates how the 20 most productive authors distributed their papers across journals. Most used a mixture of specialization (by submitting to a smaller set of core journals in their field) and generalization (by also submitting work to a variety of different periodicals).
For the remaining nodes, the distribution of the number of co-authors was significantly skewed: 27.2% of all nodes were connected to only one other scientist (in network parlance, they had a “degree of one”), 16.7% had two neighbors, and 8.9% had three; 2,235 individuals had 10 or more co-authors.
Publication Strategies of 20 Most Productive Authors

NETWORK ANALYSIS
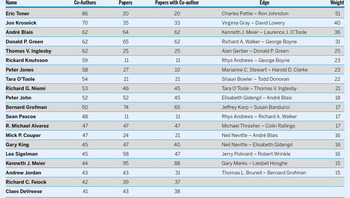
To derive the network of collaborations, we connected two authors whenever they had written a paper together. This yielded a network of 47,437 nodes (i.e., authors) linked by 57,916 edges (i.e., collaborations); 28.9% had never written a paper with a co-author, which made them isolated nodes. For the remaining nodes, the distribution of the number of co-authors was significantly skewed: 27.2% of all nodes were connected to only one other scientist (in network parlance, they had a “degree of one”), 16.7% had two neighbors, and 8.9% had three; 2,235 individuals had 10 or more co-authors. On average, individuals were connected to 2.44 others (3.44 for those who never work alone). Also, the network was weakly connected: of all edges, 89.4% stemmed from a single co-publication (in network terms, they had a “weight of one”). Another 7.1% came from two papers written together and 1.9% from three. However, certain edges stemmed from numerous papers, signaling that some researchers form stable teams. Table 1 lists those authors with the most connections and shows the heaviest edges in the network (only nodes with 10 or more papers were included). Authors with numerous connections predominantly write their papers with others. Occasionally, we found authors such as Peter Jones who wrote the majority of his papers alone but still had numerous co-authors on other papers. Concerning edges, the cooperation between Charles Pattie and Ron Johnson was the most stable by far, with 51 joint papers. Also, we found that edges do not only denote “scientific couples” but also outline stable research teams, such as André Blais, Elisabeth Gidengil, and Neil Nevitte. For PT, degrees and weights were substantially smaller than for the other two subdisciplines.
Authors with Most Co-Authors and Most Productive Edges

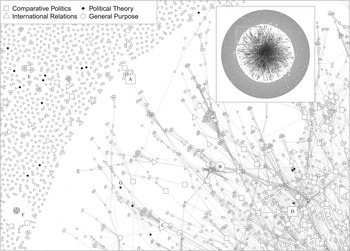
Figure 5 depicts a section of the network, with the inset in the upper right showing the structure in its entirety. Footnote 5 Nodes were drawn in three sizes (i.e., 1–5, 6–20, and 21 or more papers) and edge width was made proportional to weight. The dense structure in the middle of the inset is the metaphorical “heart” of the community: a giant component in which all scientists are connected (through their co-authors, their co-authors’ co-authors, and so on) to one another. This component consisted of 17,118 researchers (36.1% of authors; the second-largest component was only 36 people) and mainly contained scholars with a foothold in CP (depicted as squares; e.g., Erik-Hans Klijn, labeled D); IR (triangles; e.g., Tim Gray, labeled C); or in all three subfields (circles; e.g., Peter Jones, labeled B). There were only a few and widely interspersed PT authors (black diamonds; e.g., Tommie Shelby, labeled G). Many of the nodes were connected to the component’s giant central region through long tendril-like structures, which indicated that many elements of the component were not strongly intertwined with the remaining authors. Although there was a general tendency for more productive authors to gravitate to the center of the component, several large nodes were also situated more peripherally (e.g., Peter Taylor-Gooby, labeled A). The large circle around the giant component contains mostly single authors but also groups stemming from larger one-time collaborations (e.g., a 24-author paper in Marine Policy, labeled F) and the components, consisting of several smaller nodes and a larger one, that connects them (e.g., Charles Goodsell, labeled E).
Section of the Co-Authorship Network (Inset: Entire Network)

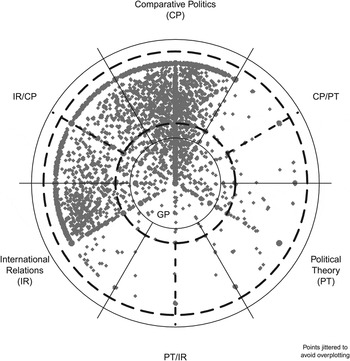
Figure 6 presents the distribution of authors across subfields as assigned from the journals’ scope (for an easier interpretation, see the color version in online appendix table O4). We mapped the subfield color to an angle capturing the hue of a color and the distance from the origin that contains saturation. The closer authors fell into the circle’s center, the more they published in GP journals or equally in all three subfields; those at the outer end specialized in one of the three subfields or their respective overlaps. The figure includes both a broad four-type classification of CP, IR, PT, and GP (i.e., dashed lines) and a more detailed seven-type classification that considers the overlaps of IR/CP, PT/IR, and CP/PT (i.e., solid lines). Again, the strong representation of IR and CP (and IR/CP) is indicated. For those located closer to the center of the circle, we found several authors situated in the area between CP and PT. The area between PT and IR, however, was populated only sparsely, and the absence of authors close to the GP circle in this slice indicates that the field included mostly highly specialized individuals.
Regarding the number of co-authors, our network showed a strongly positive degree assortativity of r = 0.678, indicating that well-connected “big shots” tend to cooperate with one another, whereas less connected researchers associate among themselves.
Distribution of Authors across Subfields

A question to consider at the network level is whether nodes with a given attribute preferred to connect to others with the same attribute—a property measured by the assortativity coefficient that ranges from 1 (when only like nodes connect) to -1 (when like nodes avoid one another). Regarding the number of co-authors, our network showed a strongly positive degree assortativity of r = 0.678, indicating that well-connected “big shots” tend to cooperate with one another, whereas less connected researchers associate among themselves. This number is even more impressive if we consider that assortativity by subfield (the value of which was partly a function of our coding) registered in a similar range (r = 0.745). The assortativity coefficient for the number of papers written is clearly lower (r = 0.205), yet it is still noticeable and positive, which indicates that authors who publish many papers have at least somewhat of a tendency to cooperate with one another. Another interesting point is that our network had a global-clustering coefficient (i.e., “transitivity” in network parlance) of C = 0.626. This value may range from 0 to a maximum of 1, capturing the tendency that two of a scientist’s co-authors are also connected by a common publication. This value is well in excess of anything expected by chance Footnote 6 and is also considerably higher than for other sciences (Newman Reference Newman2004, table 1). Just as we introduce our friends to one another, political scientists apparently establish contact among their co-authors as well.
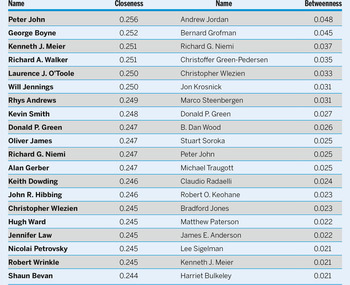
Another question most likely on readers’ minds is: Who are the most central scientists in the network? Table 2 lists them according to two different definitions. Closeness centrality calculates the shortest paths of one author (i.e., hops along edges) to all other authors in the network. The shorter the average shortest path to all other authors, the higher is the closeness score. Thus, authors scoring high on this index are central in the sense of being “in the middle of the network.” Betweenness centrality determines for a given author how many of the shortest paths between all other authors intersect with the given author. Thus, authors scoring high on this index are central in the sense that they may broker information if nodes communicate along the edges. Both measures considered the strength of edges and were normalized to the range [0;1] to eliminate the coefficients’ dependency on network size.
Most Central Authors in the Network

There are differences among the highest-ranked nodes depending on the definition of centrality; Peter John came in first with respect to being situated near all others, whereas Andrew Jordan was situated on the most potential communication paths between researchers. Yet, several authors—including Donald P. Green and Richard G. Niemi—appeared high on both lists, indicating that they are among the most central in the political science social network regardless of the definition. To investigate the evolution of the network over time, we singled out journals that appeared during the entire observation period and constructed three different networks for the periods 1990–1997, 1998–2005, and 2006–2013. Table 3 indicates that the network grew strongly during the last period not only in terms of authors and size of the giant component but also in the average number of co-authors and network density. Together, this indicates that political science as an academic discipline has expanded substantially and grown more interconnected. However, the unchanging edge weight signals that collaborations have not become more stable or lasting in the sense that two co-authors are more likely to continue publishing more papers together than in the 1990s.
Network Development over Time

EXAMPLE OF DIFFERENT SUBCOMMUNITIES IN THE NETWORK
Based on the papers’ abstracts, we also identified specific subcommunities within political science and investigated their structure in more detail. For example, we extracted the network of authors working on elections and voting behavior by searching for papers that had the lemmata “elect,” “vot(e/ing),” “turnout,” “turn out,” and “ballot” in the title or abstract. This community of election researchers contained 8,185 nodes connected by only 7,798 edges and 2,087 isolated nodes always working alone. As in the full network, this community also featured a giant component consisting of 2,823 individuals (34.5%; the second largest component consisted of only 25 people). André Blais and R. Michael Alvarez were the two authors with the highest number of connections (i.e., 52 and 38 co-authors, respectively). Although the network of election researchers is also sparse in absolute terms, it is denser than the entire network—its giant component had a density 4.7 times higher than that of the full network, which describes a relatively well-integrated community. The component also consists of productive researchers: on average, an election researcher registered 4.60 publications versus 3.55 for authors in the giant component of the full network. To assess how strongly a community organized itself around its leading journal, we derived another network that contained all papers published in Electoral Studies. This network had a size of 1,179 nodes with 1,130 of its members within the electoral research community, as identified by us. This meant that, during our observation period, Electoral Studies encompassed about 13.8% of the community. The authors of Electoral Studies contributed 662 nodes (23.5%) to the giant component of the electoral network, which indicates that the journal’s position is even better at the highly interconnected core of the field. However, the largest component in the Electoral Studies network had only 237 nodes, meaning that many of the links among the 662 nodes did not stem from work disseminated through the journal.
Whereas publishing without co-authors was more common during the 1990s, the current standard for many journals is to publish the work of multiple authors working together.
SUMMARY AND CONCLUSION
Based on an original dataset consisting of 67,414 papers published between 1990 and 2013 in 96 high-impact political science journals, we analyzed publication patterns in the international political science community. Whereas publishing without co-authors was more common during the 1990s, the current standard for many journals is to publish the work of multiple authors working together. This trend is especially visible in general-purpose (GP) journals and for those that are empirically (and/or economically) oriented or that feature a substantial proportion of publications from natural scientists. By contrast, in political theory, single authorship remains the norm. Productivity is highly skewed, with a few authors producing numerous papers whereas many authors write only one or two before disappearing from the dataset. From this perspective, the political science community seems to be in a considerable state of flux. In terms of publications, comparative politics (CP) and international relations (IR) are the two dominant (and often also mixed) areas, whereas political theory (PT) is a smaller subcommunity that is less strongly intertwined with the other two.
Constructing a co-author network revealed numerous unconnected individuals as well as a giant component that forms the heart of the discipline. Compared to all authors, within this component, authors from CP and researchers without a clear association were overrepresented, suggesting that the tendency to collaborate is more relevant here. The virtual absence of philosophically oriented colleagues, in line with their rare appearance in the journals surveyed, fits the notion that other forms of publication (i.e., books and edited volumes) probably have a larger role as research outlets. In more general terms, our results raise the question of whether the differences found with regard to the mode of publication—and thus the working patterns within political science—exacerbate the already existing divides with which we are struggling (i.e., quantitative versus qualitative and political theory versus empirical studies).
Our study so far has only scratched the surface of our dataset. Among the many possibilities for further use of this information are reversing the bipartite mapping, deriving a network of texts that are connected by a common author, and exploring whether and how such a network might contribute to the field that uses only citation studies. Also, we barely explored how the publishing community actually interconnects. Future studies therefore could investigate more closely certain subfields, showing to what extent the scholarly discussion in these subcommunities is focused in specific journals and which types of scientists connect with different fields. In this regard, it may also make sense to apply a more detailed classification than the four types (i.e., IR, CP, PT, and GP) that we used in our study. Another interesting option would be to investigate non-US authors in more detail. For example, political scientists identified as part of other national co-authorship networks (e.g., the German network mentioned previously) could be searched for in our database to illustrate the extent to which they are included in the English-speaking, international political science community and whether cross-border collaboration is available to them. Given the widely found gender differences in co-authoring behavior, an obvious question is how these differences appear in the social structure of the community. Investigating whether national, theoretical, or methodological camps also figure in the organization of the network is a worthwhile question as well. The dataset could be used to test the extent to which cooperation among political scientists is driven by collaborative grants across institutions, thereby evaluating the effectiveness of these research grants. Connecting our results and our network approach to the broader research tradition in the development of academic disciplines could help to better understand political science, compared to closer disciplines such as sociology, as well as to those that in many regards are different from political science (e.g., biology and physics).
SUPPLEMENTARY MATERIAL
To view supplementary material for this article, please visit https://doi.org/10.1017/S1049096516002341.