

1. Introduction
This paper presents an institutional history of U.S. fiscal policy, drawing directly on three key aspects of Doug North's approach to institutions: (1) institutions are rules that structure people's incentives; (2) both formal and informal institutions matter to outcomes; and (3) institutional analysis applies usefully to political as well as economic contexts.Footnote 1 This approach has supported strands of empirical research across a range of topics in political economy. This paper directs North's approach to the topic of long-term fiscal sustainability (LTFS) in the United States. The problem of public debt has recently attracted new attention in the literature. Two general questions occupy the attention of most contributions: (1) what explains deficits (important to understanding the problem); and (2) what constrains spending (important to policy analysis of reforms). On the first question, an important approach has been to start with an optimal taxation rule and attempt to explain deviations from the optimal by testing effects of fiscal rules, political institutions, polarization, voter preferences, and strategies such as wars of attrition and macroeconomic stabilization.Footnote 2 A related approach has been to model short- and long-run fiscal policy using DSGE and RBC models, and to account empirically for deviations from optimal macroeconomic stabilization policies in the short run, and optimal size of government in the long-run.Footnote 3 Several strands of empirical literature have developed to examine various fiscal indicators (annual deficits, debt held by the public, sovereign risk premia, etc.) as functions of fiscal rules, institutions, voter preferences, and more. As a whole, the literature helps understand the combination of the two questions above, and therefore is poised to provide useful policy implications.
This paper seeks to contribute to a neglected aspect of this literature. In addressing both questions above, there is a predominant focus on formal rules such as statutory constraints, budget processes, government organizational forms, and other ‘hard’ variables. Relatively few contributions examine ‘soft’ variables or informal institutions such as unwritten yet binding rules and fiscal norms. The constraining power of informal rules has been examined in recent work (Heinemann et al., Reference Heinemann, Osterloh and Kalb2014; Hou and Smith, Reference Hou and Smith2010). Yet, the literature lacks a systematic treatment of informal rules and fiscal norms to answer the first question above: How can informal rules be understood not as constraints on deficits, but as the reasons why chronic deficits emerge in the first place? This is the aim of the paper. With workable answers in hand, institutional economics research on deficits can be better poised to shed light on the second question, how deficits can be meaningfully constrained.
Following standard usage in social science, we define institutions as mutually recognized rules of interaction that inform decision makers about the rewards and punishments associated with their choices.Footnote 4 Similar to Hodgson (Reference Hodgson2015: 501), we argue that institutions are ‘systems of rules that structure social interactions’. These institutions create a structure of incentives for a particular decision context. In the context of U.S. fiscal policy, institutions are the incentive structure facing voters and elected officials when deciding on tax and expenditure policies. Formal institutions are rules that are established through official channels such as bylaws or legislation, and also enforced through official channels such as courts of law. Constitutional debt ceilings, the size and composition of tax and budget committees, official scoring methodologies, and the electoral mechanism are examples of formal fiscal rules. By contrast, informal institutions are rules established through emergent channels such as word of mouth and repeated interaction, and also enforced through unofficial channels such as social stigma and banishment.Footnote 5 An informal fiscal institution is a predominance of normative views in the polity about which functions government should be financing. This type of fiscal norm is like a boundary line for judging the acceptable scope of government spending activity.Footnote 6 In any particular period, certain budget items will fall clearly on either side of the boundary line. For instance, in the United States today, national defense has almost universal agreement as being a proper function of the central government; however, using defense funds to secretly spy on citizens is something that almost all voters deplore and some courts have prohibited. Other items fall into gray areas, such as the arts, foreign aid, and congressional pay raises. Over time, as predominant fiscal norms change, these boundary lines can shift, creating new fiscal gray areas while converting certain items from politically verboten to politically expected.
North's institutional approach focuses attention on this sort of incremental institutional change, yielding a general proposition for examining fiscal policy over a long span of time. As formal and informal fiscal policy rules evolve to decrease (increase), the net costs to fiscal policy decision makers of deficit-financed spending, the frequency and magnitude of deficits is expected to increase (decrease) as a result. This proposition provides the theoretical basis for the paper's historical investigation into the evolution of fiscal policy rules. The received empirical literature has investigated this proposition at length; however, to the relative neglect of informal rules, especially informal rules that act as motivators for deficits rather than as constraints against them.
Our historical investigation traces today's U.S. fiscal policy challenges to two shifts of fiscal norms from about 1880 to 1930. First, there emerged new demands on federal spending to support economic security at the household level and economic stability at the macro level. Second, the industrial organization of supplying federal spending became professionalized and competitive, as elected office transformed from a temporary public service to a pursuit of career-long ambition. We describe the combination of these two shifts – the demand-side spending norm and the supply-side professionalization norm – as the American polity's shift away from a balanced-budget norm in favor of a deficit-as-policy norm. Under a balanced-budget norm, deficits were tolerated only under periods of genuine national emergency and only if followed by surpluses to pay down the accumulated debt.Footnote 7 Under a deficit-as-policy norm, meeting new demands on spending takes priority and deficits are tolerated even during non-emergency periods. This new deficit-as-policy norm would then be codified in the first half of the 20th century into formal institutions, creating increasingly powerful incentives for policymakers to systematically spend through deficit finance. Deficits gradually became more frequent after WWII, and by the late 1960s had become chronic while growing in magnitude. For the next four decades, Congress would enact a series of attempts to constrain spending, while deficits would trend increasingly upward in magnitude. The institutional approach of this paper offers an explanation: Informal norms to expand the scope of the federal budget have trumped formal constraints attempting to restore fiscal sustainability.
We organize the paper into six sections. Section 2 briefly recounts the well-known problem of LTFS. Section 3 documents the transition from the balanced-budget norm to the deficit-as-policy norm. Section 4 documents the early 20th century evolution of formal fiscal rules, namely the codification of the deficit-as-policy norm, followed by legislative attempts to constrain spending post World War II. Section 5 presents a series of political economy explanations why four decades of legislative attempts to constrain spending have failed. Section 6 offers concluding remarks.
2. Today's fiscal challenges
It is well known that federal debt held by the public has reached peacetime highs after increasing from 39% of GDP in 2008 to 74% in 2014, with Congressional Budget Office (CBO) projections exceeding 100% by 2040. Longer term projections based on the CBO's most recent estimates of the fiscal gap would require reducing non-interest spending by 5.5% or increasing revenues by 6%, starting in 2016 and continuing annually, just to keep the debt-to-GDP at its 2014 level of 74% (CBO 2015: 13–14). Absent such extensive changes in fiscal policy, one expects debt levels to adversely affect national saving, interest rates, economic growth, and the government's flexibility in responding to short-run cycles (CBO, 2015: 11). The fiscal policy-making process has also become more complex and myopic since the 1998–2001 period of surplus, as documented in Rubin (Reference Rubin2007).
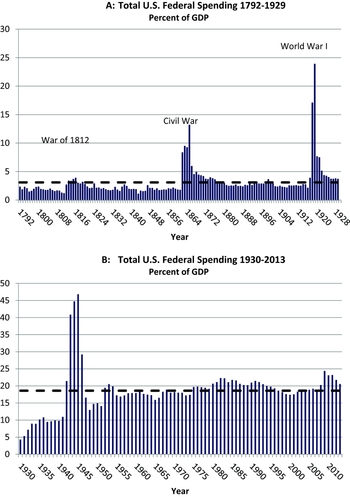
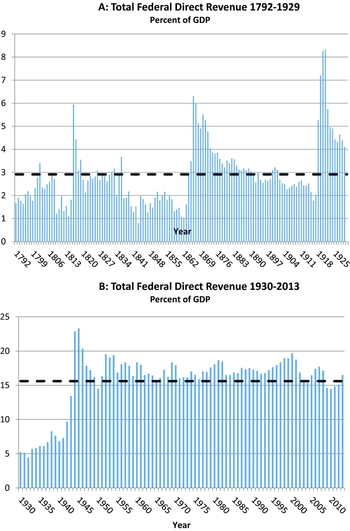
The long-term fiscal problem has been driven by expenditures growing at faster rates than tax revenues. Figure 1A shows government spending as a percentage of GDP from 1792–1929. Large and rapid increases occur during national emergencies, most notably wars, peaking at nearly 24% in WWI. From 1930–2013, in Figure 1B, spikes are similarly evident during national emergencies; however, beyond 1952, federal spending settles into an average level of about 19% of GDP well above its pre-WWII trend. Federal spending has been greater during normal times in the post WWII era than its emergency peaks in the 19th and early 20th centuries. Figures 2A and 2B present total direct revenue as a percentage of GDP for the same periods, respectively. As with the spending side, the early pattern of spikes surrounding genuine national emergencies gives way to a level shift after WWII, from about 3% to 16% of GDP. Even though spending and taxes experience permanent shifts after WWII, the increase in federal spending was of greater magnitude (3% to 18.5% compared to 3% to 16%).
Federal spending as percent of GDP, 1792–2013.

Federal revenue as percent of GDP, 1792–2013.

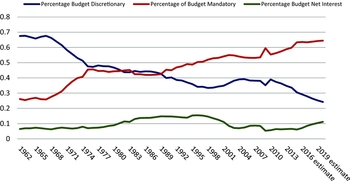
Mandatory spending on entitlement program crowds out discretionary spending and puts upward pressure on the burden of debt service. Figure 3 presents discretionary, mandatory, and net interest spending as percentages of the total federal budget from 1962 to present. Mandatory spending increased from 25% to 65% of the budget, whereas discretionary spending dropped from 68% to 34%, with official projections of discretionary decreasing to 24% by 2020. As for debt service, during the 1980s and 1990s net interest occupied between 10%–15% of the budget. It decreased to less than 7% as of 2014 but is projected to exceed 11% by 2020, thus reducing the share of discretionary spending even if the share of mandatory spending does not increase.
Discretionary, mandatory, and net interest spending as a percent of total federal spending, 1962–Present.

Thus, the U.S. LTFS is troubled by chronic deficits and unsustainably mounting debt, driven largely by increases in spending rather than decreases in taxes, especially increases in mandatory spending on entitlement programs. Furthermore, as detailed below, the fiscal policy-making process has become increasingly complex.
3. The evolution of fiscal policy rules: key shifts in norms
The evolution of fiscal policy rules in the United States has featured two gradual shifts of informal norms. First, citizens have shifted from expecting a balanced federal budget to expecting that the federal budget will be used as a policy instrument even at the cost of deficit-finance. This is what we describe as replacing the balanced-budget norm with a deficit-as-policy norm. Note that the balanced-budget norm tolerates deficits during periods of genuine national emergency, but expects surpluses later to reduce the debt. Note also that the deficit-as-policy norm is not a public preference for deficits. Instead, the deficit-as-policy norm reflects new and steadily increasing demands for federal expenditures even at the cost of fiscal unsustainability.Footnote 8 Second, norms have shifted from viewing elected office as a temporary duty of public service to a career-long endeavor of professional ambition.
Shift of norms part 1: from balanced-budget to deficit-as-policy
North (Reference North1990) claims that informal rules emerge based on the formal rules that exist, and they fill in the gaps of the formal rules. With the creation of the U.S. constitution, the formal rules of spending between the branches of government were established; however, the formal constitution only outlined the spending powers. From the American founding through the 19th century, voters and politicians predominantly shared the informal norm that emerged from these formal rules that the federal government's budget ought to be in balance.Footnote 9 During times of genuine national emergency – defined as war or severe economic depression – it was viewed as acceptable for the federal government to increase spending through deficit finance. At the end of an emergency period, one could expect that government spending would then be restrained creating surpluses that could be used to pay down the recently accumulated debt.
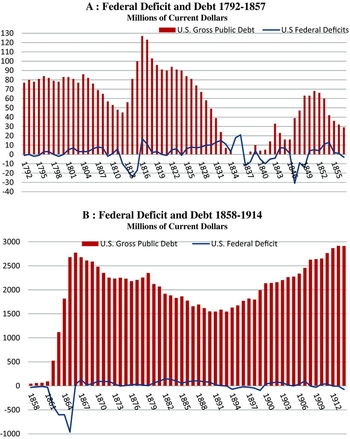
Figures 4A and 4B show annual deficits and gross federal debt for the periods 1792–1857 and 1858–1914, respectively.Footnote 10 We present the data in nominal levels, not inflation-adjusted or percent of GDP for the purposes of this paper, examining the nominal data in levels provides a method for making comparisons of short-term patterns over a long span of years.Footnote 11 For instance, the early years of Figure 4A illustrate adherence to the balanced-budget norm in fiscal policy decisions. In the 1790s, Revolutionary War debt levels remained elevated as military spending continued to increase, owing to conflicts along the American frontiers and the Barbary Coast. By 1801, Congress had restored a surplus, and debt levels began to decline sharply, until the War of 1812. Deficit spending increased sharply in 1812 and 1813, and the federal debt reached $125 million. Following that was a long period of fiscal discipline, as large deficits during the war transformed into large surpluses, and debt levels began to decline sharply. For 50 years starting in 1816, only two years of deficits occurred, and by 1835, the federal debt had been entirely paid down. The next national emergency occurred with the 1837 financial panic, creating an economic depression that lasted nearly a decade. A 7-year stretch of deficits led to an accumulated $33 million debt. However, surpluses again followed the emergency period, and debt levels again began their decline. The Mexican–American War (1846–48) repeated the pattern, with the debt rising to $68 million by 1851 then declining to $29 million by 1857. As Figure 4B shows, the pattern of fiscal discipline continues from 1858–1914, albeit on a larger scale. In the first year of the Civil War, the deficit was $30 million, exceeding all previous years except 1845. By 1863, the deficit had increased 20-fold to $600 million, and by 1865, it was $963 million, leaving the federal government with a debt of $2.7 billion at the end of the Civil War. Yet, what followed were 28 consecutive years of budget surplus and a near halving of the debt to $1.5 billion by 1894. Overall, the pattern of fiscal policy in the 19th century exhibited adherence to a balanced-budget norm. As Lane (Reference Lane2014) argues politicians and citizens were tolerant of deficits during times of national emergency, but favored debt freedom. The founding generation held an ideological view that public debt would lead to corruption of public officials. Similarly, White (Reference White2014) refers to the ‘American Fiscal Tradition’, an understanding of the ‘informal constitution’ that debt was tolerated if necessary during times of war and national emergencies.
Federal deficits and debt, 1792–1914.

During the decades surrounding the turn of the 20th century, there was increasing pressure by citizens and interest groups to spend federal dollars on safety net and economic insurance programs.Footnote 12 For instance, cash payments to Civil War veterans set a precedent that would exert significant pressure on the federal budget. The precedent would encourage other parochial interest groups to seek transfers from the federal government (Holcombe, Reference Holcombe1999). Throughout the latter decades of the 19th century, interest group competition intensified as agriculture, railroads, industry, and others vied for subsidies and regulations (Higgs, Reference Higgs1987). Meanwhile, advocacy groups pushed for federal dollars to fund local aid, basic services, and an administrative state to manage a new structure of economic regulations. Thus, the decades surrounding the turn of the 20th century saw a proliferation of ways in which the federal budget was used to finance economic security programs in the form of transfer payments to well-defined groups.
The decades surrounding the turn of the 20th century also saw increasing pressure to elevate macroeconomic management as a policy objective to pursue through the federal budget. Although the idea of stimulus spending is associated with Keynes (Reference Keynes1936), stimulus arguments were widely proposed and debated as early as the Hoover Administration. Barber (Reference Barber1985) describes the Hoover years as involving the discussion of expansionary spending, multiplier effects, and toleration of deficits. Hoover thought that deficit spending could help the United States out of the Great Depression (Powell, Reference Powell2003). He was channeling the work of pre-Keynesian scholars such as Hobson and Durbin (Reference Hobson and Durbin1933), who developed the theory of under consumption.
Shift of norms part 2: from voluntary rotation to professional politicians
During this same period, norms were also shifting within government. Elected office was transforming from a term of public service with high rates of turnover under norms of voluntary rotation, to a profession with increasing economic value of holding office. The organizational structures of Congress, the political parties, and the executive branch were changing in ways that accommodated increasing division of labor within and among the various government bodies involved with the fiscal policy making process. In addition, a rising value of holding elected or appointed office began to draw intense competition, favoring and rewarding individuals with comparative advantages in responding to the deficit-as-policy norm.
Throughout most of the 18th and 19th century, elected officials adhered to the norm of voluntary rotation. George Washington famously endorsed this belief by declining a third term as president of the United States – a norm that subsequent presidents upheld voluntarily until the 1930s. Similarly, members of Congress would typically serve only two terms. Since congressional districts overlap several counties and municipalities, officials from local governments used the norm of rotation as a means of giving each other a turn at representing the district in Congress (Kernell, Reference Kernell1977; Miller, Reference Miller2011). Abraham Lincoln entered the House of Representatives under this norm when his predecessor adhered to voluntary rotation. One term later, Lincoln did not seek re-election, allowing another person to take his Illinois seventh district seat (Miller, Reference Miller2011). Rotation broke down in the late 19th century as the party-line ballot began replacing the candidate ballot and, perhaps more importantly, as the career value of holding national office began to increase (Rusk, Reference Rusk1970).
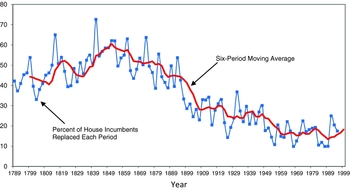
Several concurrent factors were driving the rising value of holding congressional office, starting with pay. In 1855, the per diem stipend system was replaced with annual salaries, which increased between 1855 and 1925 from $3,000 (approximately $78,000 in 2013 dollars) to $10,000 (about $131,000 in 2013 dollars) (Brudnick, Reference Brudnick2014; Taylor, Reference Taylor2013). Along with greater pay came increasing staff allotments, perquisites such as franking, and benefits from increased lobbying. Finally, incumbents began increasing their advantages over challengers, in part due to the convergence toward the two-party system (López, Reference López2003). As the value of holding office rose and politicians began abandoning the norm of voluntary rotation, there was a major decline in congressional turnover. As Figure 5 shows, the proportion of new members in each Congress went from above 40% in the 19th century to less than 20% in the 20th century. Most pronounced is the stretch from 1883 to 1910, during which turnover was declining by an average of 2.1% annually.
Turnover rate of the U.S. house of representatives, 1st–104th Congresses.

The organizational structure of Congress also became more professional, as members of Congress became more experienced and tenured. The number of committees and sub-committees flourished, further creating the need for greater specialization (Polsby, Reference Polsby1968). Internally, party leaders began adopting the seniority system for allocating valuable committee assignments. Kernell (Reference Kernell1977: 671) notes, ‘From the Civil War through the 1920’s. . .there appears to have been near linear growth of congressional careerism. . .’. The professionalization of the political system during this period set in place an important component of the long-term trend away from fiscal sustainability: Namely, the systematic selection of policymakers who could respond to interest group and public demands under the deficit-as-policy norm.Footnote 13
4. From codifying deficits to constraining over-spending: evolution of the formal fiscal rules
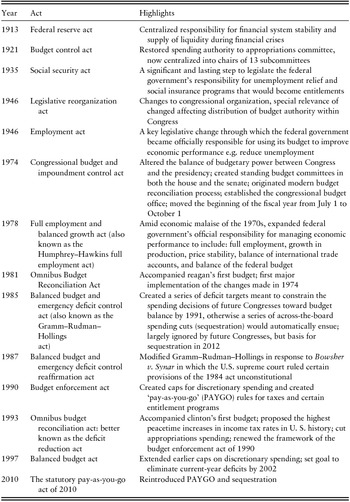
The evolution of fiscal policy rules continued with numerous changes to formal fiscal institutions in the first half of the 20th century. As conveyed in the Introduction, we define formal institutions as rules established and enforced through official channels. Table 1 presents the key legislative changes discussed in this section, listed chronologically with brief summaries. We group these legislative changes into four main areas: codifying the deficit-as-policy norm, modernizing the fiscal policy process, attempting to constrain over-spending through formal institutions, and arriving at complexity in budget analysis.
Major legislative changes to formal fiscal policy rules

Codifying deficit-as-policy norm part 1: permanent demands on spending
The past century has seen the federal budget expand in scope to various economic outcomes, both at the household and economy-wide levels. At the household level, the single change with the greatest long-term impact on the federal budget was the 1935 Social Security Act (SSA). At its enacting, the SSA provided old age insurance, welfare assistance, and unemployment insurance in the event of economic downturns. The U. S. Supreme Court upheld the constitutionality of the SSA (Helvering v. Davis 301 U.S. 619 1937), concluding that federal spending on unemployment and old-age benefits satisfied the general welfare clause of Article 1 Section 8 (DeWitt, Reference DeWitt1999). The long-term fiscal effect of the SSA would be to centralize responsibility for public assistance and social insurance programs, and to create a permanent demand for increased spending on economic security programs. Initial coverage included old age, welfare, and unemployment. Survivors, children, and disabled people gradually became eligible groups, and programs expanded to cover health care, supplemental income, housing, and food. Further expansion continued with the creation of Medicaid in 1965, Children's Health Insurance Program in 1997, and prescription drug coverage under the Medicare Modernization Act of 2003. These programs evolved into a comprehensive range of social insurance and public assistance programs, putting steady pressure on the federal government's annual budget.
At the macro level, the Federal Reserve Act of 1913 centralized responsibility for financial stability and the supply of liquidity during financial crises. The 1946 Employment Act set the objectives of stabilizing unemployment, output, and inflation. The Act also institutionalized the role of economists in policy making by founding the President's Council of Economic Advisors and the Congress's Joint Economic Committee. Furthermore, the act initiated the annual Economic Report of the President, through which economic policy advisors would forecast employment and other macro conditions, use these diagnostics to set goals for the macroeconomy, and recommend fiscal and monetary policy actions for achieving those goals. With the onset of economic malaise of the 1970s, Congress and the president enacted the 1978 Full Employment and Balanced Growth Act, also known as the Humphrey–Hawkins Full Employment Act. The act further extended the federal government's responsibility for macroeconomic management, requiring federal policy to pursue the goals of full employment, output growth, price stability, balance of international trade accounts, and balance of the federal budget.
With the SSA of 1935, the Federal Reserve Act of 1913, the Employment Act of 1946, and the Humphrey–Hawkins Act of 1978, the federal government's new economic responsibilities were set, and the deficit-as-policy norm had been codified into law. As new generations arrived, the public began to view deficits as understandable and even necessary during periods of emergency, but also acceptable as a matter of routine in efforts to stabilize the economy and provide household economic security. The balanced-budget norm, which had been adhered to from the time of the American founding through most of the 19th century, had been formally as well as informally stamped out.
Codifying deficit-as-policy part 2: organizational changes and the fiscal commons problem
The evolution of the formal rules includes changes to organizational structure, both within and external to Congress, and to the budget process. These changes were intended to modernize Congress for the professionalized era, yet they also had the effect of shaping fiscal policymaker's incentives toward creating systematic deficits. Similar to the codifying legislation above, these changes have their roots in the events of the late 19th century.
First, the structure of the Appropriations Committee changed in ways that led to a diffusion of spending authority within Congress. Throughout most of the 19th century, a single committee in each chamber made nearly all the spending decisions (Cogan, Reference Cogan, Cogan, Muris and Schick1994). Created in 1794, the House Ways and Means Committee originally had authority to initiate both taxing and spending bills. In 1865, Congress separated these functions, vesting the newly created House Appropriations Committee with the authority to originate spending bills and leaving the power to originate tax law with House Committee on Ways and Means. With fairly strict rules on new spending proposals, the Appropriations Committee began to draw increasing jurisdictional competition from other committees seeking to secure authority for their own spending projects. In 1877, Congress gave the Commerce Committee jurisdiction over appropriations for rivers and harbors, thus completely sidestepping the Appropriations Committee. By the mid-1880s, the structure of the Appropriations Committee had been expanded to feature 12 subcommittees, each of which took control of spending in distinct policy areas. Under this diffusion of budget authority, Fenno (Reference Fenno1966: 168) explains, ‘they are the lords with their fiefs and their duchys each with power over his own area of appropriations. . . . There's a power elite on this Committee. And these subcommittee chairmen are as powerful as other legislative chairmen’. In 1921, Congress passed The Budget Control Act, which restored most of the spending authority to the Appropriations Committee and its newly gathered 13 subcommittees. However, by the end of the 1920s, the committees again began to diffuse budget authority, both inside and outside the Appropriations Committee. Tollestrup (Reference Tollestrup2013) explains that through the mid-1970s, the number of subcommittees varied between 10 and 15, as the diffusion of budget authority within Congress continued.Footnote 14
In addition, the diffusion of budget authority extended outside Congress. In 1932, Congress created the Reconstruction Finance Corporation, an entity vested with the authority to borrow directly from the U.S. Treasury. Congress soon created several other entities, including the Tennessee Valley Authority, Homeowners Loan Corporation, and Rural Electrification Administration. These entities could avoid the appropriations process, instead introducing tax-financed trust funds, enabling tax-writing committees to use trust fund revenues in place of general fund revenues (Cogan, Reference Cogan, Cogan, Muris and Schick1994).
Congress also enacted broader structural changes. The 1946 Legislative Reorganization Act (LRA) consisted of 10 components that modernized the congressional committee structure while allowing for greater professionalization within Congress (Galloway, Reference Galloway1951).Footnote 15 The LRA reshuffled the congressional committee structure, reducing the number of overall committees in both chambers yet increasing the average number of seats on each committee. The new structure narrowed the jurisdictional scope of many committees, thus creating greater specialization of duties within Congress. The LRA indirectly encouraged the professionalization of Congress by increasing the size and pay of congressional staffs, increasing compensation for members, and requiring lobbying organizations to register and file quarterly financial statements.Footnote 16 The latter was an effort to create more transparency; however, revealing the identity of special-interest groups and how much they were spending only further increased the value of holding a congressional seat. Meanwhile, the expanded committee structure established in the decades from the 1930s to 1970s, and the diffusion of budget authority within and beyond Congress, allowed members to spend on their ‘pet projects’, an attractive option for those competing as professional officeholders. On the fiscal policy side, the LRA was supposed to strengthen the powers of Congress by establishing a legislative budget, standardizing the appropriations classifications, requiring greater analysis by the comptroller general, and providing regular studies on the permanent appropriations of both chambers. Galloway (Reference Galloway1951: 62) claims, that ‘many of the fiscal reforms embodied in the Act have been virtually ignored or failed to work’.
The growth in spending and deficits during the 1960s and early 1970s gave rise to a standoff between President Nixon and Congress to curtail spending, which led to the 1974 Congressional Budget and Impoundment Control Act, commonly known as the Congressional Budget Act (CBA), which put the final touches on the modern federal budget process (Hogan, Reference Hogan1985). Most of the LRA's expanded committee structure would remain, but a newly created Budget Committee in each house would supervise and facilitate the formal budget process. The CBA created the CBO, which gave Congress the ability to have its own annual budget analysis separate from the executive branch. The CBA tasked CBO with generating 5-year projections of outlays, revenues, and surplus or deficit figures. CBO works under the assumption that existing levels of government activity will continue absent express changes. These projections became the origins of modern baseline budgeting (Cogan, Reference Cogan, Cogan, Muris and Schick1994).
These organizational changes married well with the shift from balanced-budget to deficit-as-policy, together raising the political gains to policymakers of providing more durable expenditure benefits to constituents and interest groups. Being able to deliver a one-time allocation of spending is one thing; however, a long-term or even permanent flow of spending each year is of much greater value to professional politicians offering political exchange opportunities. Entitlement programs with built-in claims on the stream of future budgets became more politically feasible under the twin forces of a codified deficit-as-policy norm and a diffusion of budget authority. Persson and Tabelini (Reference Persson and Tabellini2000) argue that the diffusion of power in the congressional appropriations structure creates a dynamic commons wherein each subcommittee increases its spending but has no control over the aggregate. These effects can be seen in the shrinking portion of the overall budget that remains directly in the hands of the Appropriations Committee, combined with a growing share of automatic spending increases for entitlements. In 1974, appropriations controlled only 44% of the budget, and by the early 1980s, the share was down to 40%. Meanwhile, seven other committees shared 55% of the budget (Cogan, Reference Cogan and Henderson2008). As discussed above, Figure 3 shows the changes in discretionary, mandatory, and net interest spending, and along with chronic deficits and mounting debt, the inversion of discretionary and mandatory spending began in the late 1960s and became more pronounced in the 1980s. Consequently, proponents of fiscal discipline have been trying to reform and constrain an ever-smaller portion of the overall budget, another symptom of the underlying institutional evolution.
Responding to deficits: formal institutions to constrain over-spending
In more recent decades, the evolution of formal fiscal rules has included various legislative reforms explicitly intended to constrain spending. As noted, Congress largely ignored the fiscal measures in the LRA. With the emergence of systematic deficits, the CBA was then the first comprehensive attempt to restrain federal spending. The CBA limited the borrowing authority of the commodity corporations established in the 1930s. In addition, it introduced restrictions on creating new entitlements, but left the existing programs intact (Cogan, Reference Cogan, Cogan, Muris and Schick1994). The overall effect of the CBA on the budgetary outcomes was modest to non-existent due in part to the vague language of the act, which created fiscal policy debates but not actual fiscal restraint (Kamlet and Mowrey, Reference Kamlet and Mowrey1985). This led to passage of the Omnibus Budget Reconciliation Act in 1981. The 1981 act had the explicit goal of reducing government spending; however, CBO and OMB had separate baseline projections, so the degree of spending reductions became dependent on which estimates Congress was evaluating (Ellwood, Reference Ellwood1982). Thus, there is debate over whether the 1981 act actually cut spending (Hogan, Reference Hogan1985).
In 1985, Congress passed a bill that increased the debt ceiling by over $2 billion, which included as an amendment the Balanced Budget and Emergency Deficit Control Act. Known as Gramm–Rudman–Hollings (GRH), the act attempted to create a balanced budget within 5 years by using deficit decreasing targets, with the plan of passing a balanced budget by fiscal year 1991. LeLoup et al. (Reference LeLoup, Graham and Barwick1987) argue that it was the rise of entitlement spending and the decline of discretionary spending (i.e., the pattern seen in Figure 3) that led to the emergence of GRH. Congress had been increasingly presenting authorizations and appropriations in omnibus bills, threats of government shutdowns were becoming a common way to deal with gridlock, and basic control of the budget process was beginning to prove difficult for individual congresses to achieve. Therefore, fiscal policymakers began violating House and Senate rules (House Rule XXI clause 2(a) and Senate Rule XVI) by enacting increases in appropriations without formal authorization (LeLoup et al., Reference LeLoup, Graham and Barwick1987). GRH's intention was to add discipline to the process and hold future congresses accountable for over spending. If Congress did not meet a given year's deficit goals, automatic spending cuts or ‘sequestration’ would occur, cutting half from domestic discretionary spending and defense.Footnote 17
However, GRH was not a true balanced budget rule. Exempt from the automatic cuts were entitlement programs and interest on the debt. In addition, the automatic budget cuts would not occur if the country entered a period of recession, or in time of war (Lynch, Reference Lynch2011).Footnote 18 Finally, GRH allowed for a cushion of 10 billion over the deficit reduction target (LeLoup et al., Reference LeLoup, Graham and Barwick1987). Lynch (Reference Lynch2011) notes that exempting certain programs from sequestration created incentives to not even attempt budget reductions on those protected areas. Thus, GRH had something of a loud bark, but its teeth were removed under the pressure of built-in loopholes combined with the constitutional and practical difficulties of one Congress to constrain spending of subsequent Congresses. Indeed, it would not be long before GRH was challenged on constitutional grounds, sending the case to the U.S. Supreme Court. In Bowsher v. Synar (1986), GRH was ruled unconstitutional on the violation of separation of powers doctrine.Footnote 19 In response, Congress passed the Balanced Budget and Emergency Deficit Control Reaffirmation Act of 1987 (known as GRH II). In 1990, the Budget Enforcement Act (BEA) made further modifications that formally ended GRH (Wagner, Reference Wagner1992).
The BEA created two avenues to control spending: Pay-As-You-Go (PAYGO) and discretionary spending caps (Lynch, Reference Lynch2011). The intention of PAYGO was to offset any increases in spending with spending cuts or tax increases, thus not adding to the deficit. OMB would access the PAYGO scorecard on an annual basis to determine if it would have to trigger sequestration. The BEA allowed Congress to adjust the limits set on discretionary spending up to three times in a fiscal year.Footnote 20 As with previous bills, emergency spending was exempt. The Omnibus Budget Reconciliation Act of 1993 extended PAYGO and discretionary spending caps through 1998. All the while, the steadily increasing fiscal pressure of entitlement programs remained untouched. In other words, at every turn, the demands on the budget under a deficit-as-policy norm consistently thwarted efforts to constrain spending.Footnote 21
Arriving at complexity in the budget process
In first codifying the deficit-as-policy norm, then modernizing the budget process through organizational changes, then enacting explicit attempts to constrain over spending, the evolution of the formal fiscal rules has incrementally added layers of complexity to the fiscal policy process. Complexity in fiscal policy raises the difficulty for individual voters, taxpayers, and policymakers to grasp or control the policymaking process, and to perceive the actual consequences. Individuals can grasp, control, and perceive only pieces of the whole, but not the process in its entirety. Hebert and Wagner (Reference Hebert and Wagner2013) argue that policymakers and the public often treat macro level polices as though there is a central agent making orderly decisions. However, faced with complexity, it is more realistic instead to treat fiscal policy as a process of dispersed decision making among the various voters, taxpayers, and policymakers who each control a small piece of the whole and who each have their own political objectives (Hebert, Reference Hebert2014). Focusing on the tax side of government budgeting, Hebert and Wagner (Reference Hebert and Wagner2013) argue that a process of multiple decision makers with conflicting objectives and limited information creates ‘a certain degree of incoherence’ in the tax code. Similarly, the complexity of the expenditures side of fiscal policy makes it difficult for people to understand or control systematic deficits.
The evolution of formal rules that we have highlighted fits this analysis. Starting with organizational changes to the Appropriations Committee structure, the creation of trust fund corporations with borrowing authority, continuing with passage of the CBA and its creation of chamber budget committees, and on through the whole list of subsequent budget reforms that followed. Layers of organizational complexity were incrementally added, and multiple methods of analysis were made part of the formal process. Several authorities now examine and review the federal budget. The Employment Act of 1946 created the President's Council of Economic Advisors, which provides economic forecasts and advice that influences the president's budget. OMB reviews the budget and provides reports for the executive branch. Once in Congress, the Budget Committee is given agenda setting power shepherding the appropriations through both houses. CBO reviews the budget for the legislative branch. OMB and CBO work independently; thus, their methods and assumptions of analysis have historically differed. GRH gave the trigger authority for sequestration to the comptroller general upon review of OMB and CBO reports, but GRH II gave the authority to OMB and the executive branch. Only since 1987 have OMB and CBO used the same set of assumptions as a baseline. With the introduction of the PAYGO scorecard, OMB would use this report, along with the discretionary spending caps to determine if it should enact sequesters. The composition of discretionary spending caps and other constraints has also been changing, and has involved various methods of analysis by various committees, agencies, and branches of government. Overall, the evolution of fiscal rules has morphed into a process that requires expertise to grasp and that creates space for opportunistic distortions.
The heightened complexity has interacted with increasing party polarization to create myopia and dysfunction in recent decades. As Republicans and Democrats have diverged, particularly on fiscal policy (López and Ramírez, Reference López and Ramírez2008; Poole and Rosenthal, Reference Poole and Rosenthal1991), policymakers have increasingly gamed the formal process, often through parliamentary and political tactics like shutting down the Washington Monument and manufacturing crises or emergencies. Recall that the GRH and subsequent attempts to reduce deficits exempt emergency spending. Thus, to avoid the scrutiny of the formal budget process, both Congress and the president benefit by introducing emergency or supplemental spending bills that are not subject to the budgetary restrictions of PAYGO or deficit spending caps. Congress missed every deadline set by GRH, in part because it left enforcement to the use of easily gamed parliamentary procedures. GRH II and the ensuing series of budget reforms all had shortcomings, loopholes, and exemptions written into them (LeLoup et al., Reference LeLoup, Graham and Barwick1987).Footnote 22 Every reform exempted emergency and entitlement spending. Congress eliminated PAYGO procedures in December 2002, setting all PAYGO balances to zero and thereby avoiding sequesters after 2003 (Lynch, Reference Lynch2011). In parallel, supplemental spending and emergency spending, which are both excluded from ordinary budgetary rules, began increasing, especially after 1998 (de Rugy and Kasic, Reference de Rugy and Kasic2011). The tide receded somewhat in 2010, when Congress reinstated PAYGO and sequestration under 5-and 10-year scorecards to be prepared by OMB. Yet off-budget entitlements such as Social Security and Medicare as well as emergency spending were once again exempt.
As a result, the CBA, GRH, and the subsequent attempts to control chronic deficits have all failed. Responding to the expectations of the deficit-as-policy norm, and working within the structure of expanded budgetary authorities, congressional spending committees have found ways around virtually every new constraint and procedure designed to limit spending. In the 1970s, it was baseline scoring tactics, in the 1980s, it was omnibus bills, in the late 1990s, it became earmarks, more recently, it has been supplemental and emergency spending.Footnote 23 The complexity of the overall process has contributed to avoidance of the formal rules, thus legitimizing an environment of government shut downs, partisan and inter-branch stand offs, an effectively permanent crisis mode, and therefore routine reliance on temporary tax and spending measures filled with political tactics instead of actual on time passage of proper budgets. The shift from balanced-budget to deficit-as-policy, followed by the codification of those norms versus attempts to constrain spending, has created a level of complexity that may not be obvious to taxpayers or members of Congress, but nonetheless subtly and powerfully shapes the incentives for fiscal policymakers to continue making decisions that lead to systematic deficits and fiscal unsustainability.
The sum effect
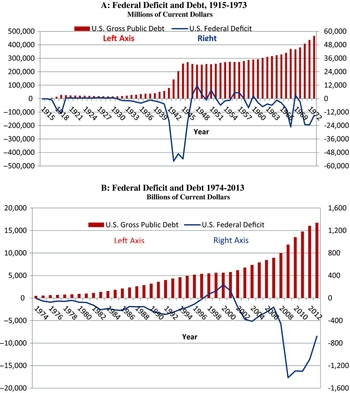
Figures 6A and 6B show deficits and accumulated debt for the periods 1915–1973 and 1974–2014, respectively. As with Figure 4, we present nominal dollars in levels, and we purposefully divide the data at 1973–74 and emphasize the vertical scale difference. By the 1970s, the fiscal reality began to feature chronic deficits and mounting debt. The 1915–1973 interval in particular reveals the transition from a pattern consistent with the balanced-budget norm to instead a deficit-as-policy type of pattern. In the early years of this stretch, the federal budget resembled 19th century patterns under the balanced-budget norm. The largest deficits surrounded national emergencies, namely World War I, World War II, the Korean, and Vietnam Wars. With World War I, the pattern resembles that of the 19th century, as the federal budget showed surpluses anywhere from $450 to $950 million each year from 1920 to 1930 and total debt decreased from $2.6 to $1.6 billion. After 1930, however, there was a change in the pattern. Deficit spending began in 1931 and continued in much larger magnitudes through World War II. Post-crisis period, however, there are only minor decreases in accumulated debt (beginning in 1948), and the budget began alternating between periods of deficit and surplus even in non-emergency periods. From 1953–1973, there were only 4 years of surplus, despite the absence of war or severe recession during that 21 year stretch.Footnote 24 Recall that the late 1940s and 1950s, the federal government began exercising more macroeconomic management, pursuant to the 1946 Employment Act. In parallel, entitlement spending continued to expand as well. By 1973, the stage was set for chronic deficits and mounting debt to become the nation's new fiscal reality.
Federal deficits and debt, 1915–2013.

In Figure 6B, we see deficits and debt becoming the dominant pattern of the modern budget era – starting almost exactly with passage of the CBA in 1974. This modern period features a long span of peacetime activity with a relative absence of genuine national emergency until 2001. Yet, despite four decades of new legislation to constrain spending and reform the budget process, every annual budget since 1974 has experienced a unified budget deficit, with the exception of 1998–2001. Total debt has increased in every year during the modern budget era, with a few exceptions of insubstantial decline. In sum, by the time Congress was beginning to take serious steps to rein in the budget, these systematic tendencies toward deficit-financed over spending had already been solidified and the data would begin to persistently reflect that.
5. Why the deficit-as-policy norm trumps formal spending constraints
The most elementary prediction from public choice theory is that in the absence of moral or constitutional constraints democracies will finance some share of current public consumption from debt issue rather than from taxation and that, in consequence, spending rates will be higher than would accrue under budget balance.
James M. Buchanan, The Ethics of Debt Default, 1987
Suppose the federal government seeks to finance an additional dollar of spending. It can do so in one of three ways: raise current taxes by one dollar, borrow a dollar, or print a new dollar.Footnote 25 Under a balanced-budget norm as in the 19th century, it would not be feasible politically for policymakers to use debt to finance the additional dollar of spending except during a period of genuine national emergency, and then only if future surpluses are accumulated to quickly pay down the debt. On the other hand, under a deficit-as-policy norm, it is politically acceptable (in fact, expected) for fiscal policymakers to utilize any of the three finance methods. Examining the policymaker and voter incentives as shaped by the evolution of fiscal institutions, the economic rationale for systematic over-spending through debt finance becomes clear.
The spending side of the fiscal ledger
One effect of the shift of norms was to treat the spending side of the fiscal ledger more like a commons. Velasco (Reference Velasco2000) demonstrates theoretically that when fiscal authority is fragmented a fiscal commons emerges and the macro implications are higher transfers, deficits, and debt than would emerge with a single source of decision-making. Wagner (Reference Wagner1992) argues that three groups compete for the budgetary commons. Each committee maximizes spending, but interest groups and worthy causes put continued pressure on funds from these committees, as do their respective government agencies. All three groups understand that if they do not fight for their share of the funding it will go to other committees, interest groups, or agencies. The result is each committee allocates funds for its segment of the budget – e.g., agriculture, defense, commerce – but when the several appropriations are aggregated the sum is greater than any of the participants would have intended and more than the available revenues can afford. Thus, deficits become a matter of routine, regardless of whether emergency conditions are at hand.
The shift to a deficit-as-policy norm, its codification, and the overall complexity of the budget process that has evolved, all contribute to a fiscal commons problem in Congress. As noted, Cogan (Reference Cogan, Cogan, Muris and Schick1994) argues that since the 1930s Congress has expanded the number of committees that have spending authority. Yet, the power to exclude must be delegated alongside the diffusion of access rights, otherwise the resource extraction rate will soon exceed its natural replacement rate, and a commons problem will emerge. When a single committee had the appropriations decision, budget authority was concentrated in Congress, essentially providing a stronger ability to exclude access to the additional dollar of federal spending. A relatively small number of legislators (those on the appropriations committees in their respective chambers) had effective property rights over the budget. However, as more committees, finance corporations, and trust fund authorities emerged from the 1930s to 1970s – each with its own fiscal sub-constituency within the overall polity – this served to expand budget authority within and even outside Congress. Each additional decision maker with budget authority, along with a fiscal constituency, could now receive the benefits of allocating an additional dollar of federal spending while spreading the costs among taxpayers. None of the legislative attempts to constrain spending effectively addresses this fundamental ‘fiscal commons’ aspect of the budgetary process. These attempts set targets for better outcomes but with too little attention to the processes that have been generating those outcomes.
Outside Congress, the federal budget has also become a fiscal commons among the voters. Social insurance programs for the elderly, children, health, and unemployment have evolved into permanent entitlements that are politically treacherous and occupy two thirds of federal spending. Industry groups across the economic landscape make their cases for subsidy. Economic experts argue for deficit spending while Treasury yields and debt service levels are attractively low (Krugman, Reference Krugman2009). Interest groups have the further incentive to tout their causes as critical and in states of emergency, creating an urgency to various demands for spending which exacerbates the fiscal commons problem.
Certain groups in the general public do advocate for more fiscal restraint. Watchdog organizations represent taxpayer interests, some of which have their roots in the tax revolts of the 1930s (e.g., the National Taxpayers Union). A number of organizations advocate for future generations, arguing that we cannot continue to impose the costs of current spending on tomorrow's taxpayers. These groups do have some representation in Congress, with a minority of policymakers working in varying degrees toward fiscal discipline. On net, the groups that advocate for fiscal restraint have been no match for the deficit-as-policy norm, both in Congress and among the general public.
The finance side of the fiscal ledger
Just as there is political competition to secure the benefits of an additional dollar of federal spending, there is competition to avoid the burden of financing additional expenditures. This puts future taxpayers at a disadvantage, because future taxpayers have only indirect representation in current spending decisions. One set of indirect representation consists of people who believe that intergenerational redistribution is immoral; these are often the same people mentioned above who advocate for fiscal discipline. Another source of future representation works in the opposite direction. This second set consists of people who argue for increasing current spending because the economic growth that it creates will increase future living standards and thereby broaden future tax bases, thus decreasing the burden on future taxpayers. The latter group joins forces with interests who benefit from spending more now, plus current taxpayers who resist more taxes now. The net effect is a relative weakness of future taxpayers in current fiscal policy choices. This relative weakness interacts with fiscal commons to reinforce pressure toward systematically increasing spending. Further, it introduces a second, dynamic bias toward debt-finance: Future taxpayers will eventually be then-current voters. This gives future taxpayers some degree of recourse, so long as the deficit-as-policy norm still prevails once they become current voters. If so, when their day comes they will have the incentive to choose (and no binding constraint against choosing) continued debt-finance of then-current spending. Over the long-term, the deficit-as-policy norm creates biases toward greater deficit accumulation in each period; it encourages each generation of voter–taxpayers to continue the pattern of intergenerational redistribution, a pattern that is detectable in the modern budget era as shown in Figure 6.
Incentives of the policymaker
Since career politicians have a strong motivation to get reelected (or elected to higher office), they have a professional interest in taking credit for the benefits of additional budget outlays. Interacting with the fiscal commons problem, this incentive creates a systematic tendency toward increased spending, in good and in bad times. The deficit-as-policy norm allows professionalized elected officials to reap political support by supplying conspicuous and durable expenditures to constituents without increasing their taxes. Furthermore, because future taxpayers have weak representation in any current time's fiscal policy decisions, this also creates a systematic bias toward financing current spending out of debt instead of current taxes. These forces overpower the opposition arguing for fiscal discipline, thus reducing any real attempts to constrain deficit spending. Instead, policymakers have the professional incentive to engage in nominal fiscal discipline – passing powerfully named legislation with targets to balance the budget by certain dates in the not too distant future – only to preserve flexibility to continue debt-financed spending through various exemptions.
Those unproductive policymaker incentives are reinforced by voter perceptions of fiscal discipline, known as fiscal illusion.Footnote 26 A more complex tax and budget process raises the difficulty for voters to imagine the benefits of deficit reduction. Policymakers have professional interests in further blurring the connection between a dollar of deficit-spending today and its eventual tax price tomorrow. An effective strategy for blurring this connection is to make the tax code and budget process more complex – so complex that citizens cannot fathom the way federal tax and budget processes work, much less how they interact. Professional politicians, operating under a deficit-as-policy norm, can benefit from the set of fiscal policy rules becoming increasingly complex over time.
Perceptions of deficit reduction
Fiscal illusion also diminishes voter support for deficit reduction efforts. Suppose the benefits of real deficit reduction (as opposed to nominal signaling) consist of better long-term economic performance, a more sustainable fiscal policymaking process, and perhaps an overall improved political climate. These benefits can be real and significant, yet under a deficit-as-policy norm, there would still be little incentive for the electorate to demand a move toward deficit reduction. This is partly driven by how current voters perceive the trade-offs associated with deficit reduction. Buchanan and Wagner (Reference Buchanan and Wagner1977, chapter 8) and Wagner (Reference Wagner2012) portray today's voters as associating both costs and benefits with deficit reduction proposals. On the cost side, deficit reduction either means there are fewer current benefits of federal spending or greater burdens on current taxpayers. They perceive these costs as being direct and certain consequences of any deficit reduction proposal. The perception is these costs are incurred in the present by individual groups and special interests that either receive less spending or have more taxes imposed on them. The perceived costs of deficit reduction are biased relative to its perceived benefits because even if those benefits are real and substantial, they will be perceived as accruing indirectly (widely among citizens and taxpayers), at some time in the distant future. Furthermore, it will be difficult to say that the future economy will have been performing better because of past fiscal discipline and not because of some other set of reasons. Finally, unlike the current costs of real fiscal discipline, which are borne by specific groups that receive less spending today, the benefits of fiscal discipline are going to be widely shared across the whole future population. It is difficult to enact any reforms with diffuse benefits and even more difficult when those reforms have concentrated costs. Properly introduced in this way, fiscal illusion is a contributing factor even if there is abundant information and pervasive discourse about public debt, austerity measures, and the potential costs of deficits (Alesina and Passalacqua, Reference Alesina, Passalacqua, Taylor and Uhlig2015).
These political economy reasons for the shift to deficit-as-policy norm and its institutional codification has given voters and politicians incentives to make decisions that systematically lead to deficits, thus creating today's fiscal policy challenges. Under a deficit-as-policy norm, professionalized elected officials have an incentive to support interest group and constituent demands for spending, as doing so will increase their chances of re-election. Similarly, voters and interest groups have the incentive to support deficit-spending proposals partly because the benefits are clear and present while the costs are opaque and appear to be easily shifted onto future taxpayers who are not part of the fiscal decision process.
6. Conclusion
Previous research has invoked informal rules as a potential constraint on deficit spending. This paper has instead demonstrated how changing informal rules can explain the gradual emergence of systematic deficits, even despite the enactment of formal rules that are expressly intended to constrain spending. The fundamental dynamic that we have identified is the shift from the balanced-budget norm to the deficit-as-policy norm between 1880 and 1930, followed by the instantiation of the norm into formal fiscal institutions. New demands on federal spending emerged in areas that incrementally expanded the scope of the federal budget. Meanwhile, the industrial organization of supplying federal spending became professionalized and competitive, selecting officials with comparative advantages in responding to the deficit-as-policy norm. By the middle of the 20th century, formal fiscal institutions had come to embody the norm. This incremental evolution of fiscal institutions increasingly created incentives toward deficit-finance; therefore, the shift of norms continues to shape U.S. fiscal policy outcomes. Under the deficit-as-policy norm, fiscal institutions shape the incentive structures of career politicians in elected office such that they are politically punished for saying no to a cacophony of worthy sounding proposals, and they are politically rewarded for making spending promises that are durable in the sense that they cannot easily be undone by future policymakers. In addition, the financing of spending has become a fiscal commons. Whether voters or policymakers intend or realize it, the evolution of fiscal rules has led to chronic deficits, mounting debt, greater complexity of tax and budget procedures, and unsustainably large unfunded obligations, all toward an overall unsustainable and worsening fiscal outlook. In recent decades, attempts to constrain spending have been written into the formal rules, but these formal constraints have not been enough to overcome the circumnavigating forces of the deficit-as-policy norm. In short, informal norms have trumped formal constraints.
As North (Reference North1990: 53) explains, ‘a mixture of informal norms, rules, and enforcement characteristics together defines the choice set and results in outcomes. Looking only at the formal rules themselves, therefore, gives us an inadequate and frequently misleading notion about the relationship between formal constraints and performance’. When applied to the problem of LTFS in the United States, North's emphasis on the evolution of formal and informal rules demonstrates how shifting informal rules can account for the reasons why chronic deficits of rising magnitude have been the persistent pattern during the modern budget era.
Acknowledgements
We thank two anonymous referees and the editors for valuable comments that significantly improved the paper. We also thank session participants at the 2015 Public Choice Society and Southern Economic Association meetings, Chris Coyne, John Dove, David Hebert, Jeff Hummel, Phil Magness, Lotta Moberg, and Alex Salter. Meredith McKeever and Candace McTeer provided excellent research assistance. The Mercatus Center at George Mason University provided support for an earlier version of this paper, including the helpful comments of four anonymous referees. Errors and omissions remain the authors’ responsibility.