I. INTRODUCTION
Poly(ether-b-ester) copolymers have numerous applications as engineering materials due to their attractive combination of strength, high elasticity, melt stability and high crystallization rates. These elastomers are block copolymers that contain alternatively crystallizable (hard) and noncrystallizable (soft) chain segments, resulting in a material with high melting temperature crystallites (hard segments)—dispersed in a soft component and low glass transition temperature matrix. High melting temperatures are pertinent in quest for polymers, which can survive temperature cycling over wide temperature ranges for applications in thermoelectric (TE) devices.Reference Goldsmid1, Reference Rowe2 Our segmented poly(ether-b-ester) copolymers of poly(butyl terephthalate) (PBT) and oxytetramethylene (PTMO) belong to the family of such thermoplastic elastomers.Reference Broza, Schulte, Baltá Calleja and Roslaniec3 The nanometric structure of segregated hard and soft segments is mainly responsible for the outstanding mechanical properties of these materials.Reference Schroeder and Cella4
Generally and as well known, properties of polymers can be modified and improved by addition of fillers with sizes in the nm rangeReference Rabello5–Reference Brostow, Chonkaew, Datashvili and Menard19 including carbon nanotubes (CNTs).Reference Lourie and Wagner20–Reference Vail, Burris and Sawyer33 CNTs exhibit a high elastic modulus, strong electrical and high thermal conductivity. CNTs are an appreciated filler material for creation of composites due to unique or advantageous properties they impart to polymers.
Most of the literature on CNT-containing composites does not deal with tribological properties. This lack of investigations into the tribological properties should be seen in the context of eloquent discussions of RabinowiczReference Rabinowicz34 on the huge losses suffered by industry caused by scratchability and wear of various kinds. In this work we have studies tribological and mechanical properties—looking for connections between them. We recall that in 2006 when some of us defined brittleness BReference Brostow, Hagg Lobland and Narkis35 we have also connected it to the viscoelastic recovery f in sliding wear determination. Subsequent work has shown that our B(f) relationship applies to even more polymers and polymer-based composites.Reference Brostow and Hagg Lobland36, Reference Brostow, Hagg Lobland and Narkis37 In this work we are looking at even more connections between mechanical and tribological properties.
We have applied both single wall CNTs (SWCNTs) and multiwall CNTs (MWCNTs) subjecting them to a functionalization process. We have developed a method of making nanohybrids from oxidized CNTs in copolymer matrices by using an in situ polycondensation process. Such a process was first introduced for multiblock copoly(ether-b-ester)s based on semicrystalline PBT blocks with amorphous PTMO blocks.Reference Broza, Kwiatkowska, Roslaniec and Schulte27 The name nanohybrids is more specific than nanocomposites since it includes the fact that the former involve both inorganic and organic constituents; by contrast, a nanocomposite can for instance consist of nanoparticles of a metal in a ceramic and thus be fully inorganic. The level of nanotube aggregation within the polymer matrix depends on the procedure followed to synthesize the PBT/PTMO with CNT nanohybrid. A better dispersion can be achieved when CNTs are added to dimethyl terephthalate (DMT) + butanediol (BD) monomers before transesterification.Reference Broza28 We have decided to explore among others whether CNTs can improve tribological properties of PBT/PTMO.
II. EXPERIMENTAL AND MATERIALS
A. Synthesis of carbon nanotubes
We have used high-purity and high-quality CNTs. SWCNTs were supplied by CNI Technology Co., Norman, OK, synthesized by the HIPCO method.Reference Broza30 According to the manufacturer, the diameter of the SWCNTs was from 0.6 to 1.8 nm with the length of several μm and purity >97 wt%. Thin MWCNTs were supplied by Nanocyl S.A., Sambreville, Belgium, synthesized using chemical vapor deposition (CVD) technique.Reference Broza30 The average diameter of the MWCNTs was about 10 nm with the length of 10–50 μm.
B. Functionalization of carbon nanotubes
There is a diversity of chemical reactions that can modify the surfaces of CNTs.Reference Broza30 To achieve a good dispersion of CNTs in the polymeric matrix and strong interface adhesion, the surfaces of CNTs should be chemically functionalized.Reference Xie, Mai and Zhou29 Kopczynska and Ehrenstein discuss the importance of interfaces for properties of multiphase composites.Reference Kopczynska and Ehrenstein38 Chemical modification of filler can even produce lowering of viscosity of the melt as compared with the neat molten polymer without filler.Reference Blaszczak, Brostow, Datashvili and Hagg Lobland39 The typical tendency is the opposite, that is, a viscosity increase caused by the filler.
The process of functionalization of CNTs consists of the following three steps. The first step is oxidation. In our case, 4.1 g of CNTs were put into 200 mL distilled water and the suspension introduced into a three-necked flask placed in an oil bath. Thereafter, 200 mL of 65% aq. nitric acid were added, thus in the 1:1 proportion. The mixture was slowly heated up to 100 °C under ambient pressure and constant mixing to render a homogeneous dispersion. Helium gas was used to entrain gases formed during the reaction. This reaction took 20 h.
In the second stage we first turned off the heating. 300 mL of dimethyl sulfoxide (DMSO) and 10 mL thionyl chloride were added very slowly to the reaction mixture. The second step took 20 additional hours. Afterward, 20 mL of N,N-dimethylformamide and 8 mL of butylene glycol (1,4-butanediol) were mixed together in a beaker and this composition was added to the flask (step 3). The temperature was maintained around 80 °C and then our mixture was left for 24 h. Afterward, we had washed carbon nanotubes in a suction flask with N,N-dimethylformamide until pH ≈ 7 was reached. The expected result was functionalization of the surfaces of the CNTs.
C. Reaction of functionalized CNTs with PBT/PTMO copolymers
As described in,Reference Broza, Schulte, Baltá Calleja and Roslaniec3 one can create block copoly(ether-b-ester)s based on semicrystalline hard segments of PBT and amorphous soft segments of PTMO. Such block copolymers were treated with varying amounts of functionalized CNTs in a two-stage process. Thus, DMT, BD, functionalized carbon nanotubes (fCNTs) dispersed in BD + DMT and the catalyst were poured into a reactor and mixed (90 rpm) at 175 °C under normal pressure. The second step was polycondensation when liquid PTMO and a stabilizer were added (250 °C, 40 rpm). Then the pressure was reduced to 50 Pa. These processes result in formation of two by-products: methanol (transesterification) and butylene glycol (polycondensation). Progress of functionalization has been followed by Raman spectroscopy but we have not included those results in this article for brevity’s sake. We note that Raman spectroscopy does not discriminate between functionalization types.
D. Microscopy
We have used a LEO Gemini 1530 scanning electron microscope (SEM; Oberkochen, Germany). Samples were fractured in liquid nitrogen. A range of accelerating voltages, 3–10 kV, was applied. Because of the low conductivity of the specimens, a thin layer of gold was sputtered onto the surfaces, with the thickness of the gold layer ≈ 10 nm. This in turn enabled the use of low beam energies.
E. Tensile testing
Specimens were prepared by injection molding. The DIN EN ISO 527-2 standard was followed. A Zwick universal testing machine (Ulm, Germany) was used. The tests were conducted at the rate of 25 mm/min while the starting clamp distance was 32 mm. Young’s modulus was calculated for the elongation range between 0.05—0.25% at a constant crosshead rate of 25 mm/min. Five tests have been made for each type of samples; we report averages here.
F. Dynamic mechanical analysis (DMA)
DMA testing was performed using a PerkinElmer DMA7 machine (Waltham, MA). Specimens were analyzed in rectangular form using a three-point bending fixture in the temperature T scan mode from 25 °C to 170 °C at the heating rate of 3 K/min. The frequency applied was 1.0 Hz. We have recorded the storage (solid-like) modulus E′, the loss (liquid-like) modulus E′′ and tan δ = E′′/E′.
G. Scratch resistance and sliding wear
Scratch tests were carried out on tensile test specimens using a CSM microscratch tester (Peseux, Switzerland) with a conical diamond indenter (200 mm diameter and 120° cone angle) following the procedure described in review articles.Reference Brostow, Deborde, Jaklewicz and Olszynski40, Reference Brostow, Kovacevic, Vrsaljko and Whitworth41 Both single scratches and sliding wear testing (= 15 scratches along the same groove) were performed under the following conditions: normal load 5.0, 10.0, 15.0 and 20.0 N; scratch length 5.0 mm, 5.0 mm/min scratch speed at room temperature (25 °C). For each test, the instantaneous penetration depth Rp and the residual depth Rh after healing were recorded. Rh values have in each case been determined 2 min after recording the Rp values–sufficient time for full recovery to occur. The percentage of viscoelastic recovery f was calculated from Rp and Rh for the 15th scratch as

H. Volumetric wear
For determination of the wear and wear mechanisms of these materials, a Nanovea series pin–on–disk tribometer from Microphotonics Inc. (Allentown, PA) was used. Using a stainless steel ball, tests were conducted for 50 min, at 100 revolutions per min, thus up to 5000 revolutions. The force applied was 5.0 N at ≈21 °C.
Cross-section areas of wear tracks remaining after the pin–on–disk tribometry were determined using a Veeco Dektak 150 profilometer.
The wear volume Vm of the tracks produced by the pin–on–disk testing was determined using the average cross-sectional area Am obtained from the profilometer. The obtained cross-section area is multiplied by wear track length, namely

where Rm is the radius of the wear track. The wear rate is then calculated as

Here W is the normal load while x is the sliding distance.
III. MICROSCOPY RESULTS
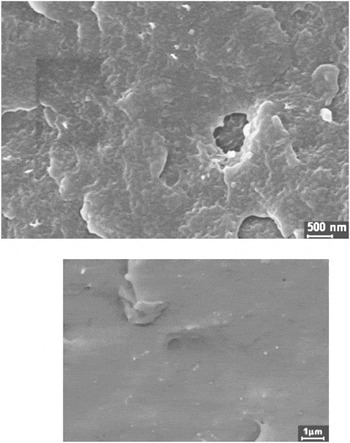
Scanning electron micrographs of PBT/PTMO nanohybrids with 0.5 wt% of fMWCNTs and with 0.3 wt% of fSWCNTs are presented in Fig. 1. In both cases a fairly homogeneous distribution of the CNTs in the PBT/PTMO matrix, which is produced by the in situ polycondensation, is seen. The results shown are representative of all the nanohybrids prepared.
SEM micrographs of fracture surfaces of the PBT/PTMO nanohybrids with 0.5 wt% fMWCNTs (top) and of the nanohybrids with 0.3 wt% fSWCNTs (bottom), in both cases with a gold layer of 10 nm thickness.

IV. TENSILE TESTING AND CYCLIC STRESSING RESULTS
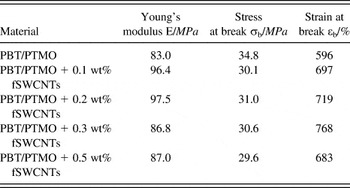
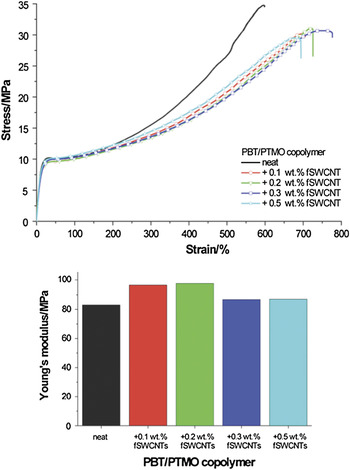
Consider first results for SWCNTs. Results of mechanical testing for pure PBT/PTMO and for nanohybrids with varying amounts of fSWCNTs are presented in Table I. The corresponding stress versus strain diagrams are shown in Fig. 2 (top).
Summary of tensile properties of PBT/PTMO block copolymers with fSWCNTs.

Stress versus strain curves for neat PBT/PTMO and PBT/PTMO nanohybrids with different amounts of fSWCNTs (top); also the respective Young’s modulus (bottom).

A comparison of the Young’s modulus values for the different compositions is shown in Fig. 2 (bottom). We have: for neat copolymer E = 83 MPa, for 0.1% CNTs is E = 96.4 MPa, for 0.2% CNTs is E = 97.5 MPa. At 0.2 wt% of CNTs there is a maximum, at higher CNT concentrations the modulus decreases—but it is still higher than for the neat copolymer. Among the nanohybrids the lowest value E = 87 MPa is for 0.5 wt% CNTs, only 4 MPa higher than for pure copolymer. At E = 86.7 MPa, the value for 0.3% CNTs is virtually the same as for 0.5% CNTs.
Aggregation of CNTs taking place at higher concentrations cannot be excluded. To explain results in Fig. 2 above, we have to consider at least two more effects. As expected, more CNTs should give more reinforcement. At the same time, more CNTs result in less cohesion in the matrix. We recall a discussion by Pisanova and ZhandarovReference Pisanova, Zhandarov and Brostow42 about the behavior of cylindrical or fiber-shaped reinforcement under load. The stress imposed can lead to local debonding of the fiber from the matrix—starting at the fiber ends. More CNTs provide more nanotube ends where debonding can begin. A combined result of these effects is a maximum of E. We note also the results of Szymczyk et al.Reference Szymczyk, Roslaniec, Zenker, Garcia-Gutierrez, Hernandez, Rueda, Nogales and Ezquerra43 on poly(trimethylene terepthalate) + MWCTNs materials. These authors report maxima of tensile modulus, of tensile stress at break and of storage modulus in dynamic mechanical testing as a function of CNTs concentration.
The elongation at break is the highest for PBT/PTMO with 0.3 wt% fSWCNTs and has the value of 768%, which is more than 170% higher than for the neat copolymer.
The highest stress at break σb is for the neat copolymer, ≈35 MPa. It is about 16% higher than for our nanohybrids. By contrast, the strain at break εs is larger for nanohybrids than for the neat copolymer. Thus, the functionalized single-walled CNTs in nanohybrids provide a plasticization effect.
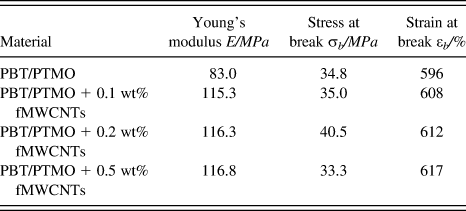
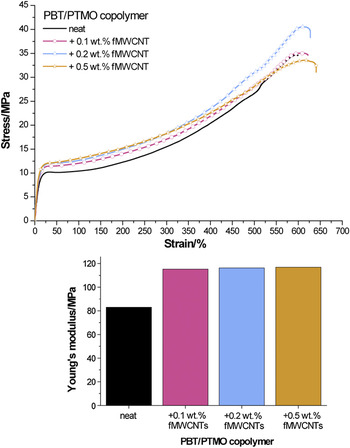
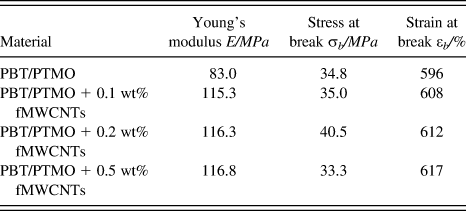
We now consider the nanohybrids containing fMWCNTs. Numerical data are presented in Table II. The respective stress versus strain curves are shown in Fig. 3 (top). Young’s modulus values are compared in Fig. 3 (bottom).
Summary of tensile properties of PBT/PTMO block copolymers with fMWCNTs.
Stress versus strain curves for neat PBT/PTMO and PBT/PTMO nanohybrids with different amounts of fMWCNTs (top); also the respective Young’s modulus (bottom).

We see an increase of Young’s modulus for nanohybrids with fMWCNTs compared with the neat copolymer. The values are about 20% higher than for nanohybrids containing fSWCNTs. Thus, MW tubes provide more reinforcement—as expected. The highest stress at break σb is for 0.2 wt% CNTs (40.5 MPa).
The strain at break values are not as high as for nanohybrids with SWCNTs, in the range 580–610%, approximately 100% lower than in SWCNTs systems. Thus, there is a plasticizing effect but a much weaker one than for single-wall nanotubes. We have already quoted the discussion by Kopczynska and EhrensteinReference Kopczynska and Ehrenstein38 on the role of interfaces in properties of multiphase polymer-based materials. Consider now the effects of tensile force application on our nanohybrids. SWCNTs have smoother surfaces than MWCNTs. Thus, polymeric chains slide along SW nanotube surfaces fairly easily, hence plasticization. MW nanotubes also provide some sliding capability to the chains—but less than SW tubes. Consider contact points between the chains and the nanotube surfaces. Whether one considers the so-called parchment model of MW tubes or the so-called Russian doll model of these tubes, in general the MW tubes have more contact points per unit surface area than SW tubes. These points offer resistance to chain movements. While the contact point model is appealing, there is no experimental procedure for determination of their numbers per unit surface area. Possibly future molecular dynamics simulations of multiphase polymers subjected to external forcesReference Brostow, Cunha, Quintanilla and Simões44, Reference Brostow and Simões45 might provide a way of dealing with this model. We also note that SW tubes are more flexible than MW tubes, hence one more reason for a stronger plasticization effect provided by the former.
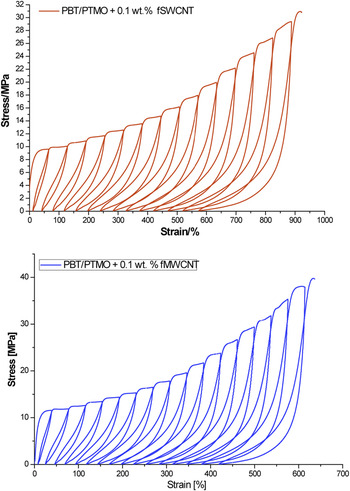
We have also performed repetitive or cyclic tensile stressing tests. Examples are shown in Fig. 4 for 0.1 wt% of fSWCNTs and for the same concentration of fMWCNTs.
Results of repetitive tensile cycling: (a) 0.1 wt% fSWCNTs and (b) 0.1 wt% fMWCNTs.

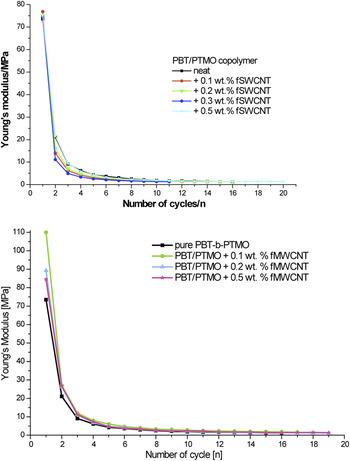
In general, multiple loading provides results similar to and confirming those from one-time tensile testing. Thus, MW tubes provide more reinforcement. This, while SW tubes provide more plasticization, hence higher strain values. We see that each loading cycle results in “lowering” the tensile modulus. We summarize cycling loading results in Fig. 5. There is a dramatic drop in E during the first few cycles for each composition for both SW and MW nanotubes.
Variation of Young’s modulus as a result of the number of load cycles: (top) fSWCNTs; (bottom) fMWCNTs.

V. SCRATCH TESTING AND SLIDING WEAR RESULTS
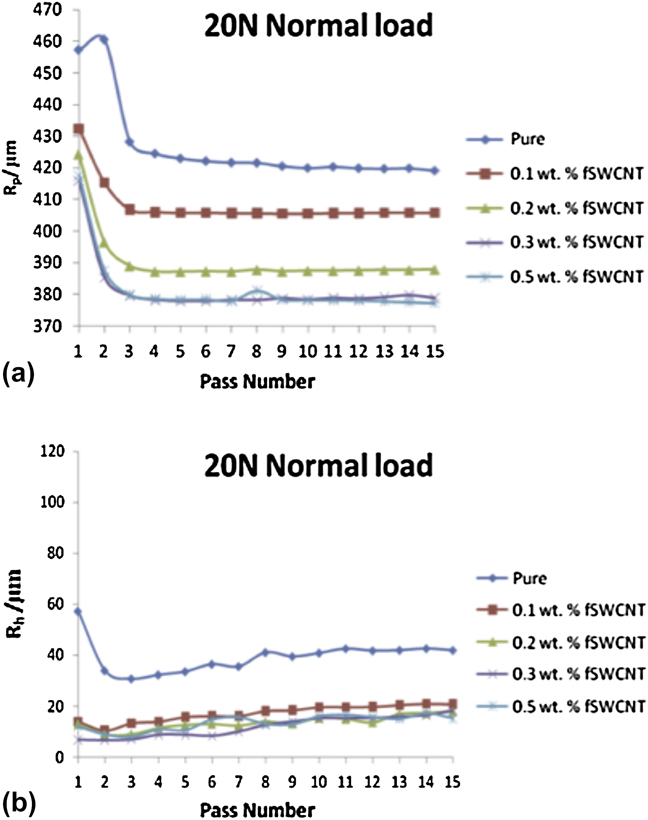
We show in Fig. 6 sliding wear results as penetration (instantaneous) depth Rp and residual (healing) depth Rh values for fSWCNTs at the load of 20.0 N. We recall that the consecutive passes of the indenter go along the original groove created during the pass number 1. Results for other loads and for fMWCNTs are omitted for brevity’s sake. However, we note that—as expected—smaller Rp and Rh depths are seen under lower loads. Larger differences between samples of different compositions are seen at higher loads. SW tubes provide between 2 and 3% higher viscoelastic recovery f values; see again Eq. (1). This confirms the hypothesis of more plasticization by SW nanotubes than by MW tubes—already used to explain results of one-time tensile testing and also of cyclic loading. We shall return to the f results later in this article.
Sliding wear results as a function of the pass number: (a) penetration depths Rp and (b) residual healing depths Rh for 20.0 N.
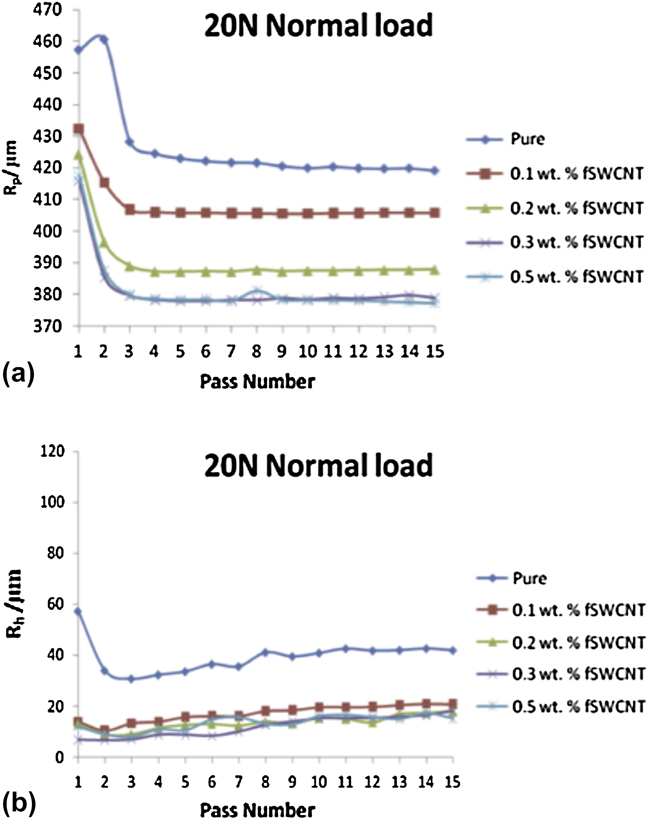
We see in Fig. 6 that strain hardening in sliding wear discovered beforeReference Brostow, Damarla, Howe and Pietkiewicz46 takes place in these materials also. Most polymers and polymer-based composites investigated so far exhibit this phenomenon. Polystyrene does not, a fact that has led to the definition of brittleness of materials:Reference Brostow, Hagg Lobland and Narkis35

A combined discussion of B and viscoelastic recovery f will be provided in Sec. VI.
VI. DYNAMIC MECHANICAL ANALYSIS AND BRITTLENESS
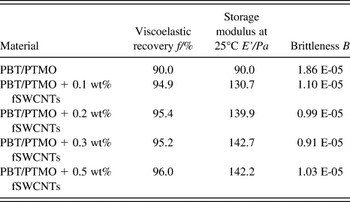
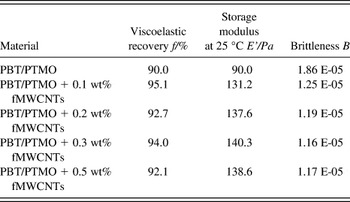
Values of B calculated from Eq. (4) are displayed in Tables III and IV for SWCNT and MWCNT hybrids, respectively.
Summary of brittleness and viscoelastic recovery results for fSWCNT hybrids.

Summary of brittleness and viscoelastic recovery results for fMWCNT hybrids.

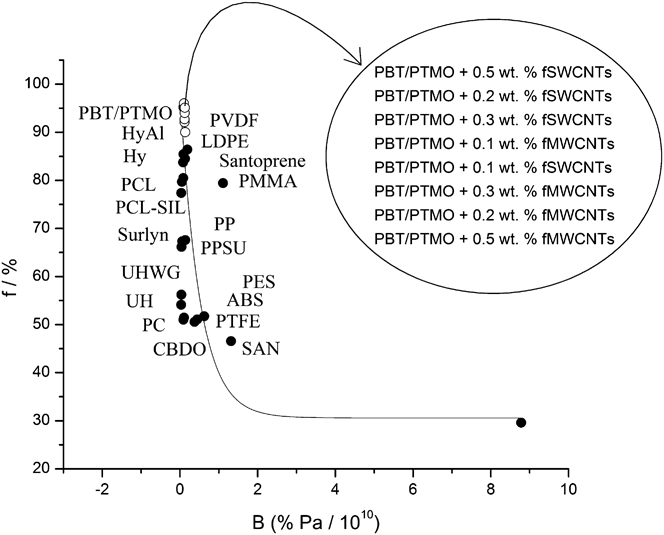
We now present in Fig. 7 values of f as a function of B calculated from the formulaReference Brostow, Hagg Lobland and Narkis35

Viscoelastic recovery in sliding wear (f) as a function of brittleness (B). Points for materials other than those studied in this work are from.Reference Brostow, Hagg Lobland and Narkis35–Reference Brostow, Hagg Lobland and Narkis37
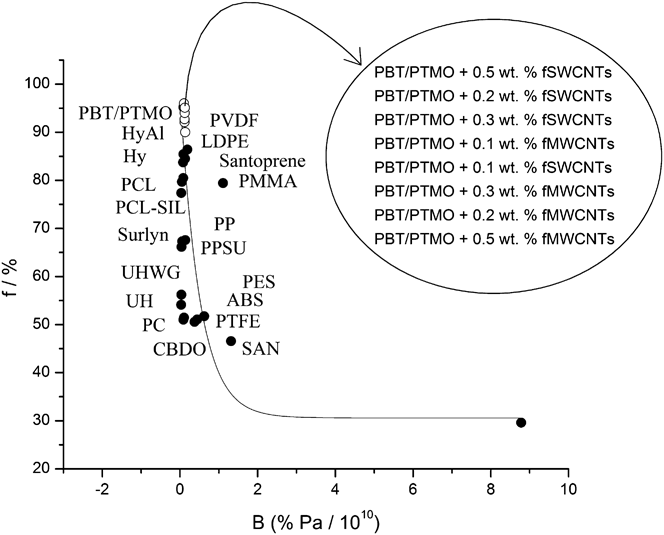
Brittleness is, of course, an aspect commonly considered in evaluating materials’ performance. Using a combination of parameters obtained from dynamic and quasistatic testing methods, brittleness has been defined quantitatively by Eq. (4), providing a measure for comparability of different materials.Reference Brostow, Hagg Lobland and Narkis35 Values of the parameters used to calculate B, the strain at break and storage modulus, are reported in Tables III–V. Importantly, brittleness has been correlated with several other properties,Reference Brostow, Hagg Lobland and Narkis35–Reference Brostow, Hagg Lobland and Narkis37, Reference Szymczyk, Roslaniec, Zenker, Garcia-Gutierrez, Hernandez, Rueda, Nogales and Ezquerra43 including to viscoelastic recovery in sliding wear (f). The correlation between B and f has been tested for a variety of neat polymers, including homopolymers and copolymers, thermoplastics and elastomers as well as for several composites with nano- and micropowder additives, metals and ceramics. Consequently, it is evident that B is an appropriate descriptor for all types of polymer-based materials and that the relationship between B and f is not limited in the use to neat polymers only. The essential diagram shown in Fig. 7 was defined at the time brittleness was definedReference Brostow, Hagg Lobland and Narkis35 and the parameters in Eq. (5) are original ones. Importantly, we see that the points now obtained for our nanohybrids and for PBT/PTMO fit the general curve. There are two outliers as before: polymethyl methacrylate (PMMA) and styrene/acrylonitrile copolymer (SAN). The data for those materials come from some websites and were used in default of more accurate ones. Our present nanohybrids have brittleness slightly higher than the unmodified PBT/PTMO; however B values go through a minimum around 0.3% of fSWCNTs and around 0.3% of fMWCNTs. We recall again results of Szymczyk et al.Reference Szymczyk, Roslaniec, Zenker, Garcia-Gutierrez, Hernandez, Rueda, Nogales and Ezquerra43 who report also a minimum of brittleness as a function of CNTs’ concentration.
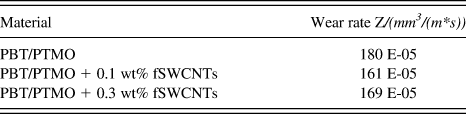
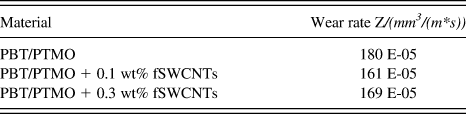
Summary of wear results for SWCNTs containing hybrids.
VII. VOLUMETRIC WEAR
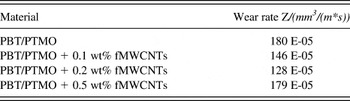
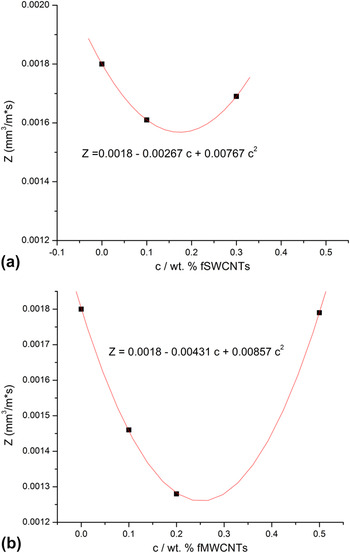
There are several mechanisms of wearReference Brostow, Kovacevic, Vrsaljko and Whitworth41, Reference Myshkin, Petrokovets and Kovalev47 and different types of wear occur under different conditions. In this section, we report results of abrasive determination performed using a pin-on-disk tribometer and resulting in volumetric wear. One thus evaluates the volume of the debris formed. By contrast, in microscratch testing and sliding wear determination reported above in Sec. V there can be very little or no debris. As discussed earlier, the indenter leaves behind a groove and two top ridges along the groove.Reference Brostow, Chonkaew, Rapoport, Soifer and Verdyan48 We summarize the volumetric wear results for SWCNTs and MWCNTs in Tables V and VI respectively and in Fig. 8.
Summary of wear results for MWCNTs containing hybrids.

Volumetric wear Z as a function of the concentration of nanotubes cCNT: (a) single wall tubes and (b) multiwall tubes.

We see minima on the diagrams for both single-wall and multiwall CNTs. We recall that the values of B as a function of cCNT presented in Tables III and IV also exhibit minima. A possible joint explanation of these results is in terms already discussed in Sec. IV when talking about the tensile modulus and strain at break: a competition between the reinforcing effect of the nanotubes and lowering the cohesion of the polymeric matrix by the presence of the nanotubes. We intend to pursue a relationship between volumetric wear (Z) and brittleness (B) and report the results in a later publication. We recall the results of Vail, Burris and SawyerReference Vail, Burris and Sawyer33 for polytetrafluoroethylene (PTFE) + SWCNTs: wear rates determined from volume loss as a function of cCNT show a minimum. CNTs concentrations used in that study are much higher than ours, presumably because PTFE does not ‘cooperate with anything’. We note that the existence of extrema on diagrams of material properties as a function of CNTs concentration is by no means automatic.
VIII. A SURVEY OF RESULTS
Kopczynska and EhrensteinReference Kopczynska and Ehrenstein38 as well as Desai and KapralReference Desai and Kapral49 note the importance of interfaces for properties of multiphase materials. While processing can affect properties of polymersReference Jackovich, O’Toole, Cameron Hawkins and Sapochak50 and polymer-based compositesReference Dalle Vacche, Oliveira, Leterrier, Michaud, Damjanovic and Månson51 significantly, the role of interfaces comes out clearly in our results. Reinforcement of a polymeric matrix does not necessarily improve properties proportionately to the filler concentration, cCNT in our case. We have found out the double-edge sword effect of our carbon nanotubes. On one hand, we see the reinforcement effect. On the other, the nanotubes constitute a ‘foreign body’ weakening the continuity and cohesion of the polymeric matrix. We have reported above minima on the brittleness B versus cCNT diagrams—both for single wall and multiwall CNTs—a consequence of these two effects acting simultaneously. Similarly, we have found minima on the wear Z(cCNT) diagrams, again for both SWCNTs and MWCNTs. Our results reinforce the conclusion that a nanohybrid with a high concentration of the nanofiller by no means guarantees a large desired improvement of polymer properties.
We have noted above potential use of high temperature polymers with reinforcing fillers in thermoelectric devices. Electrodes in organic solar cells can be made using CNTs—provided approximately parallel orientation of the nanotubes can be achieved.Reference Yang, Chen, He, Guan, Li, Qiu and Peng52
ACKNOWLEDGMENTS
We appreciate discussions with Olena Astahova, Michael Bratychak, Volodymyr Donchak and Olena Shyshchak, all at the Lvivska Politechnika National University. Partial financial support was provided by the II-VI Foundation, Bridgeville, PA.