





Introduction
Infertility has become an important medical problem today and according to the WHO it means failure to conceive even after one year of unprotected sex. About 15% of couples around the world are suffering from infertility, with male related causes accounting for approximately one-third of all cases; note that 10% of infertile couples cannot be explained (Agarwal et al., Reference Agarwal, Majzoub, Parekh and Henkel2020). Azoospermia, which refers to the absence of spermatozoa in the seminal fluid, represents one of the most important causes of human male infertility and can be divided into two main groups: obstructive azoospermia (OA), caused by mechanical obstruction in the reproductive tract, and non-obstructive azoospermia (NOA), caused by primary testicular failure (Agarwal et al., Reference Agarwal, Majzoub, Parekh and Henkel2020). Approximately 60% of azoospermia patients are diagnosed with NOA (Cissen et al., Reference Cissen, Meijerink, D’Hauwers, Meissner, van der Weide, Mochtar, de Melker, Ramos, Repping, Braat, Fleischer and van Wely2016). The aetiology of NOA is complex, as damage to any step in the spermatogenesis process can potentially lead to this condition. The precise molecular mechanism behind NOA is still unknown at present, making it difficult to diagnose and treat. The process of testicular development and spermatogenesis depends on many factors, in particular the spatial and temporal gene expression in germ cells that together orchestrate fine tuning of testis function and spermatogenesis. Since there are a number of genetic and epigenetic abnormalities associated with NOA, further research on the genetic and epigenetic changes is needed to identify new therapeutic targets for NOA.
The Wnt signalling pathway is an evolutionarily conserved signal pathway, playing important roles in cell differentiation, tissue morphogenesis and the maintenance of tissue homeostasis (Nusse and Clevers, Reference Nusse and Clevers2017). This pathway has important roles in many biological processes which influence development and cell function throughout life. Sperm production and maturation are known to be regulated by multiple signal transduction pathways and other factors (Freitas et al., Reference Freitas, Vijayaraghavan and Fardilha2017). Of them, the Wnt signalling pathway was found more important because of its extensive expression pattern in the male reproductive organs (Peter, Reference Peter2004; Xue et al., Reference Xue, Lin, Sun, Watanabe, Xu, Araki, Nasu, Tang and Huang2021). In addition, Wnt signalling plays a role in the maintenance of normal sperm morphology and function in mammalian males (aberrations are associated with male infertility and testicular germ cell tumours). For example, Wnt/β-catenin signalling particularly favours the proliferation of spermatogonial stem cells/progenitor cells in the testis, while post-translational regulation of Wnt signalling controls the epididymal maturation of spermatozoa (Koch et al., Reference Koch, Acebron, Herbst, Hatiboglu and Niehrs2015; Takase and Nusse, Reference Takase and Nusse2016). Recently, by using single-cell multi-omics analysis, we showed that there is a dysfunction of Wnt signalling in the spermatogonia from NOA patients. Additionally, three transcription factors-namely CTCF, AR and ARNTL-have been implicated in the dysregulation of this crucial signalling pathway (Zeng et al., Reference Zeng, Chen, Liu, Tang, Wu and Liu2023). Nevertheless, despite those facts, it remains unclear how exactly the Wnt signalling pathway participates in the etiopathogenesis of NOA. Elucidation of such relationships will be essential to understand the pathophysiology of NOA and to identify powerful therapeutic targets for improving male fertility.
In this research, we used various bioinformatic tools in an orderly manner on NOA’s expression data set available at the GEO database for differential gene expression gene analysis and then, we applied the weighted gene co-expression network analysis (WGCNA) to identify the best fitting co-expressed gene modules related to the NOA phenotype. We further analysed related genes in the Wnt signal pathway and obtained four hub genes, whose diagnostic values were subsequently calculated. Finally, we used LASSO regression analysis to screen out the optimal hub gene with highest diagnostic value, CSNK1G2 and its expression level in NOA patients were further confirmed by qRT-PCR and WB experiments. The study can provide a new idea to understand the function of Wnt signal pathway in the development of NOA, which may lay an important basis for follow-up basic intervention experiments.
Materials and methods
Data sources
In our research, we obtained the expression profile of genes in the GEO public website (http://www.ncbi.nlm.nih.gov/geo). We downloaded the dataset GSE45885(GPL6244), which included 31 samples with 27 NOA cases and four NCs, while we used GSE9210 (GPL887), GSE45887 (GPL6244) for external validation, whereby GSE9210 contains 47 NOA samples and 11 OA samples, and GSE45887 contains 16 NOA and 4 NC samples.
Identification of differentially expressed genes (DEGs)
The differentially expressed genes (DEGs) analysis was carried out by using the package called ‘limma’ from R, where DEGs were set at |Log2FC|>1 and P < 0.05.The resulting DEGs were further visualized by ‘pheatmap’, providing a heatmap that is more intuitive in terms of expression pattern among samples or genes, and ‘ggplot2’ to plot the volcano plot that makes it easier to distinguish between the up-and down-regulated genes as well as their significance.
Construction of the WGCNA
The weighted gene co-expression network analysis (WGCNA) was performed using the ‘WGCNA’ package in R to construct gene network modules highly associated with the disease. To classify genes with similar expression profiles into gene modules, average linkage hierarchical clustering was conducted according to the TOM-based dissimilarity measure with a minimum size (Gene group) of 100 for the genes dendrogram and the power of soft threshold was 14. To further analyse the module, we calculated the dissimilarity of module eigen genes, chose a cut line for module dendrogram and merged some module (Luo et al., Reference Luo, Coskun, Liang, Yu, Cheng, Ge, Shi, Zhang, Li, Cui, Lin, Luo, Wang, Lin, Dai, Zhu, Zhang, Liu, Liu, deVellis, Horvath, Sun and Li2015).
Identification of intersecting genes
To identify key genes involved in the Wnt signaling pathway that plays an important role in the regulation of spermatogenesis, we downloaded a list of 297 Wnt pathway related genes from Reactome database (https://reactome.org/) and then overlapped them with the 889 DEGs obtained by our first round of bioinformatic analysis as well as the 3320 genes generated from WGCNA analysis to: we identified the common 4 genes. We have used the Venn diagram tool to visualize these intersections (Bardou et al., Reference Bardou, Mariette, Escudié, Djemiel and Klopp2014).
Gene functional enrichment analysis
To obtain some information about the function and pathway of DEGs, as well as the hub gene in WGCNA. we performed Gene Ontology (GO, https://geneontology.org/) and Kyoto Encyclopedia of Genes and Genomes (KEGG, https://www.kegg.jp/ or https://www.genome.jp/kegg/) pathway enrichment analysis by using the R package (clusterProfiler and enrichplot) (Consortium, Reference Consortium2019; Kanehisa et al., Reference Kanehisa, Sato, Kawashima, Furumichi and Tanabe2016). We set the parameters minGSSize = 5 and maxGSSize = 5000 as a compromise between statistical power and biological interpretability. We considered p value<0.05 as statistically significant.
Protein-protein interaction (PPI) network analysis
We used the STRING database(https://cn.string-db.org/c) to retrieve the possible interaction between the identified down-DEGs, which focuses on the direct physical interactions and functional association (Szklarczyk et al., Reference Szklarczyk, Gable, Nastou, Lyon, Kirsch, Pyysalo, Doncheva, Legeay, Fang, Bork, Jensen and von Mering2021). We then imported the PPI information into Cytoscape (v3.8.2, https://cytoscape.org) software (Cytoscape is an open source platform for the visualization, integration, and analysis of molecular interaction networks). In Cytoscape, we used the ‘cytoHubba’ plug-in that provides 12 different algorithms for detecting keynodes (hub genes), and then, we took the top 10 genes ranked by the MCC algorithm to analyse and visualize them in the PPI network (Otasek et al., Reference Otasek, Morris, Bouças, Pico and Demchak2019).
Screening for hub gene based on Least Absolute Shrinkage and Selection Operator (LASSO) regression analysis
The overlapping genes were subjected to LASSO regression analyses by utilizing the ‘glmnet’ library from R software. In order to depict the influence of hub gene and other genes, although it may not be as significant since there are only few genes involved, we used the survminer, tidyverse and survival packages of R for building a forest plot.
Differential gene expression & external data validation
According to GSE45885, ROC curves for these four hub genes were drawn by using R package ‘pROC’, and an ROC curve was obtained in order to evaluate the diagnostic efficiency of each gene, where AUC surves as an objective measure of accuracy. The model AUCs and corresponding 95% CIs were computed for assessing whether the models could discriminate between NOA cases and controls, where the closer to 1 is the AUC, the more accurate it is.
We validated our results externally using two available data sets: GSE9210 and GSE45887. We validated differential expressions with R package limma and ggpubr, where the results are presented as a box plot. We also tried to reproduce the ROC curve analyses on the external data sets for assessing the diagnostic potentiality of the selected genes. It is important to note however that since there are not enough NOA samples which express GNG3 available in the GSE9210 dataset we could not build any meaningful ROC curve on those data for this gene. However, we also calculated the ROC curve on the rest of the genes from both GSE9210 and GSE45887 datasets.
Analysis of immune infiltration
The correlation between the expression level of CSNK1G2 in NOA and immune infiltration was analysed by two approaches, i.e., CIBERSORT and xCell. The CIBERSORT method was used for evaluating the proportion of immune cell compositions and abundances, while xCell scores were used for comparing immune cell signature differences between NC and NOA. We further performed correlation analysis between DEGs extracted through our study and immune cell infiltration pattern derived from CIBERSORT as well as xCell.
GSEA
In this study, we performed GSEA to find out significant functional terms between the NOA and NC groups. Furthermore, NOA patients were divided into the CSNK1G2 high expression group and the CSNK1G2 low expression group according to their CSNK1G2 expression. Using GSEA, we could gain insight regarding biological importance of CSNK1G2 expression in relation to other pathways and processes that are relevant to NOA. We performed GSEA with the GSEA software (version 4.3.3) on four different databases: Gene Ontology Biological Process (GO-BP), Hallmark, KEGG legacy and Reactome. We performed GSEA at the cutoff level |NES| > 1, NOM p-value < 0.05, and FDR < 0.25 for significant gene set enrichment (Subramanian et al., Reference Subramanian, Tamayo, Mootha, Mukherjee, Ebert, Gillette, Paulovich, Pomeroy, Golub, Lander and Mesirov2005).
Exploration of CSNK1G2 expression characteristics and functional associations
To further elucidate the functional role of CSNK1G2 in NOA, we performed three additional analyses. First, CSNK1G2 expression was compared across NOA histopathological subtypes (post-meiotic arrest, meiotic arrest, pre-meiotic arrest and Sertoli cell-only syndrome) using the Wilcoxon rank-sum test. Second, samples were stratified into CSNK1G2 high-expression and low-expression groups based on the median CSNK1G2 expression level, and differential expression analysis was performed using the limma package with thresholds of |log2FC| > 0.5 and adjusted P < 0.05, followed by GO and KEGG enrichment analysis of the resulting DEGs. Third, we curated a gene set of 107 spermatogenesis-related genes from published literature, and Spearman correlation analysis was applied to evaluate the association between CSNK1G2 and each spermatogenesis-related. Genes with P < 0.05 were considered significantly correlated and subjected to GO enrichment analysis.
Construction of the miRNA-mRNA-TF regulatory network and prediction of small molecule drugs
The prediction of microRNAs (miRNAs) was performed with four databases (miRDB, miRWalk, RNA22, TargetScan) and we retained the overlapping miRNAs predicted across all four databases. For TFs, predictions from three databases (TFDB, GTRD, ChEA3) and took the intersection among the three. Then, we used Cytoscape 3.8.2 to integrate these miRNAs, TF predictions to form an integrated miRNA-mRNA-TF regulatory network. In addition, in order to translate our results towards possible treatment approaches, we used the GeneCards database, which is an integrative database containing data about human genes, including small molecule drugs and signaling pathway. Based on GeneCards, small molecule drugs targeted to the obtained genes could be retrieved. For example, https://www.genecards.org/cgibin/carddisp.pl?gene=CSNK1G2&keywords=CSNK1G2 (small molecule drug targeted to CSNK1G2).
Validation of CSNK1G2, β-Catenin and Wnt3a expression by qRT-PCR and WB
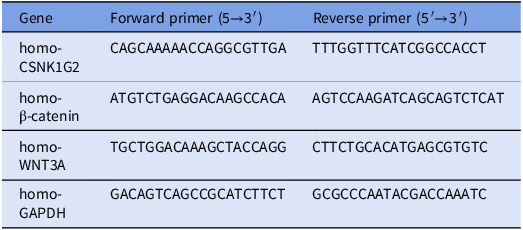
The experiment plan was approved by the Ethics Committee of People’s Hospital of Guangxi Zhuang Autonomous Region and the informed consent was obtained from the patients. Experimental groups were the testis biopsy tissues in patients with NOA, while the NC group included tissue samples of OA-patients. qRT-PCR and WB were used to detect the relative mRNA and protein expression level of CSNK1G2, β-Catenin and WNT3A in testicular tissue between NOA group and NC group, respectively. We chose GAPDH as the internal reference gene of qRT-PCR, and then we used 2−ΔΔCt to calculate the relative gene expression levels. Primers information for qRT-PCR is shown in Table 1. For WB analysis, total protein was extracted from human testicular biopsies using RIPA buffer (Beyotime) containing protease/phosphatase inhibitors (Roche). Lysates were incubated on ice for 30 min and centrifuged (12,000 rpm, 15 min, 4°C); supernatants were collected. Protein concentration was determined by BCA assay (Thermo Fisher). Proteins (30 μg/lane) were separated by 10% SDS-PAGE and transferred to 0.45 μm PVDF membranes (Millipore). Membranes were blocked with 5% non-fat milk in TBST for 1 h at room temperature, then incubated overnight at 4°C with primary antibodies: anti-CSNK1G2 [ab70862,1:1000], anti-β-Catenin [ab81305,1:10000], anti-Wnt3a [ab219412,1:1000] and anti-Cyclophilin B (loading control) [ab154865,1:1000]. After TBST washes, membranes were incubated with HRP-conjugated secondary antibodies [CST,1:5000] for 1 h at room temperature. Bands were visualized by ECL (Thermo Fisher) and imaged on an iBright CL750 system. Densitometry was performed with ImageJ (NIH), and relative expression was normalized to Cyclophilin B. All experiments were performed in triplicate.
Primer sequences

Table 1. Long description
A table listing primer sequences for various genes. The table has four rows and three columns. The columns are labeled Gene, Forward primer, and Reverse primer. The rows list the genes homo-CSNK1G2, homo--Catenin, homo-WNT3A, and homo-GAPDH. Each row provides the specific forward and reverse primer sequences for the respective gene. The sequences are given in capital letters and include specific nucleotide sequences.
Results
Identification of DEGs
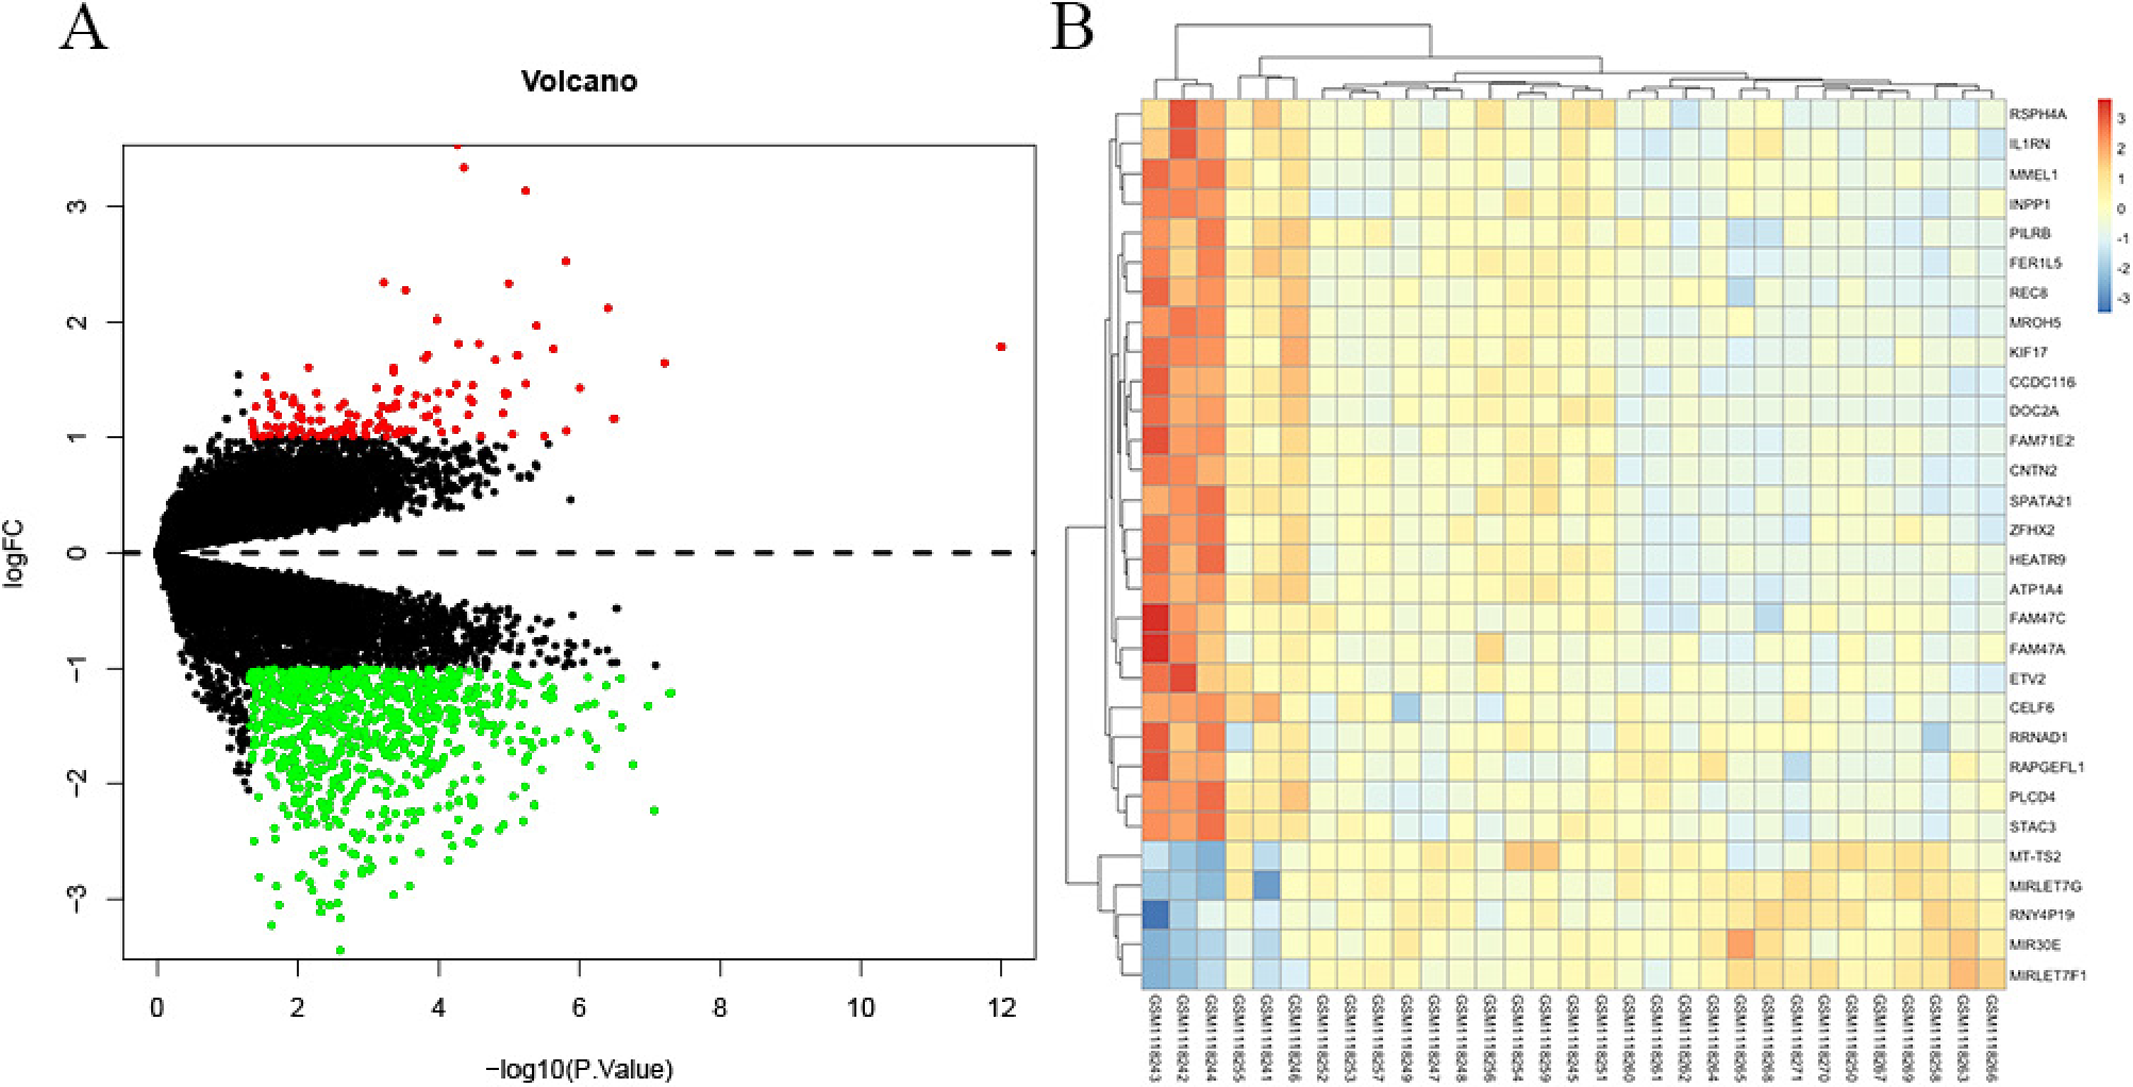
Using GSE45885 including 27 samples of NOA and 4 NC, there were 889 DEGs screened out according to the threshold: |Log2FC| > 1 and P < 0.05. Among them, 129 genes are upregulated while 760 genes are downregulated (Supplementary Table 1), their expressions were shown as following volcano plot and a heatmap of the top 30 genes were produced (Figure 1A,B).
Analysis of differential gene expression between NOA and NC. (A) Volcano plot of DEGs from the GSE45885 dataset. (B) Heatmap of DEGs from the GSE45885 dataset.

Determination of key modules via WGCNA
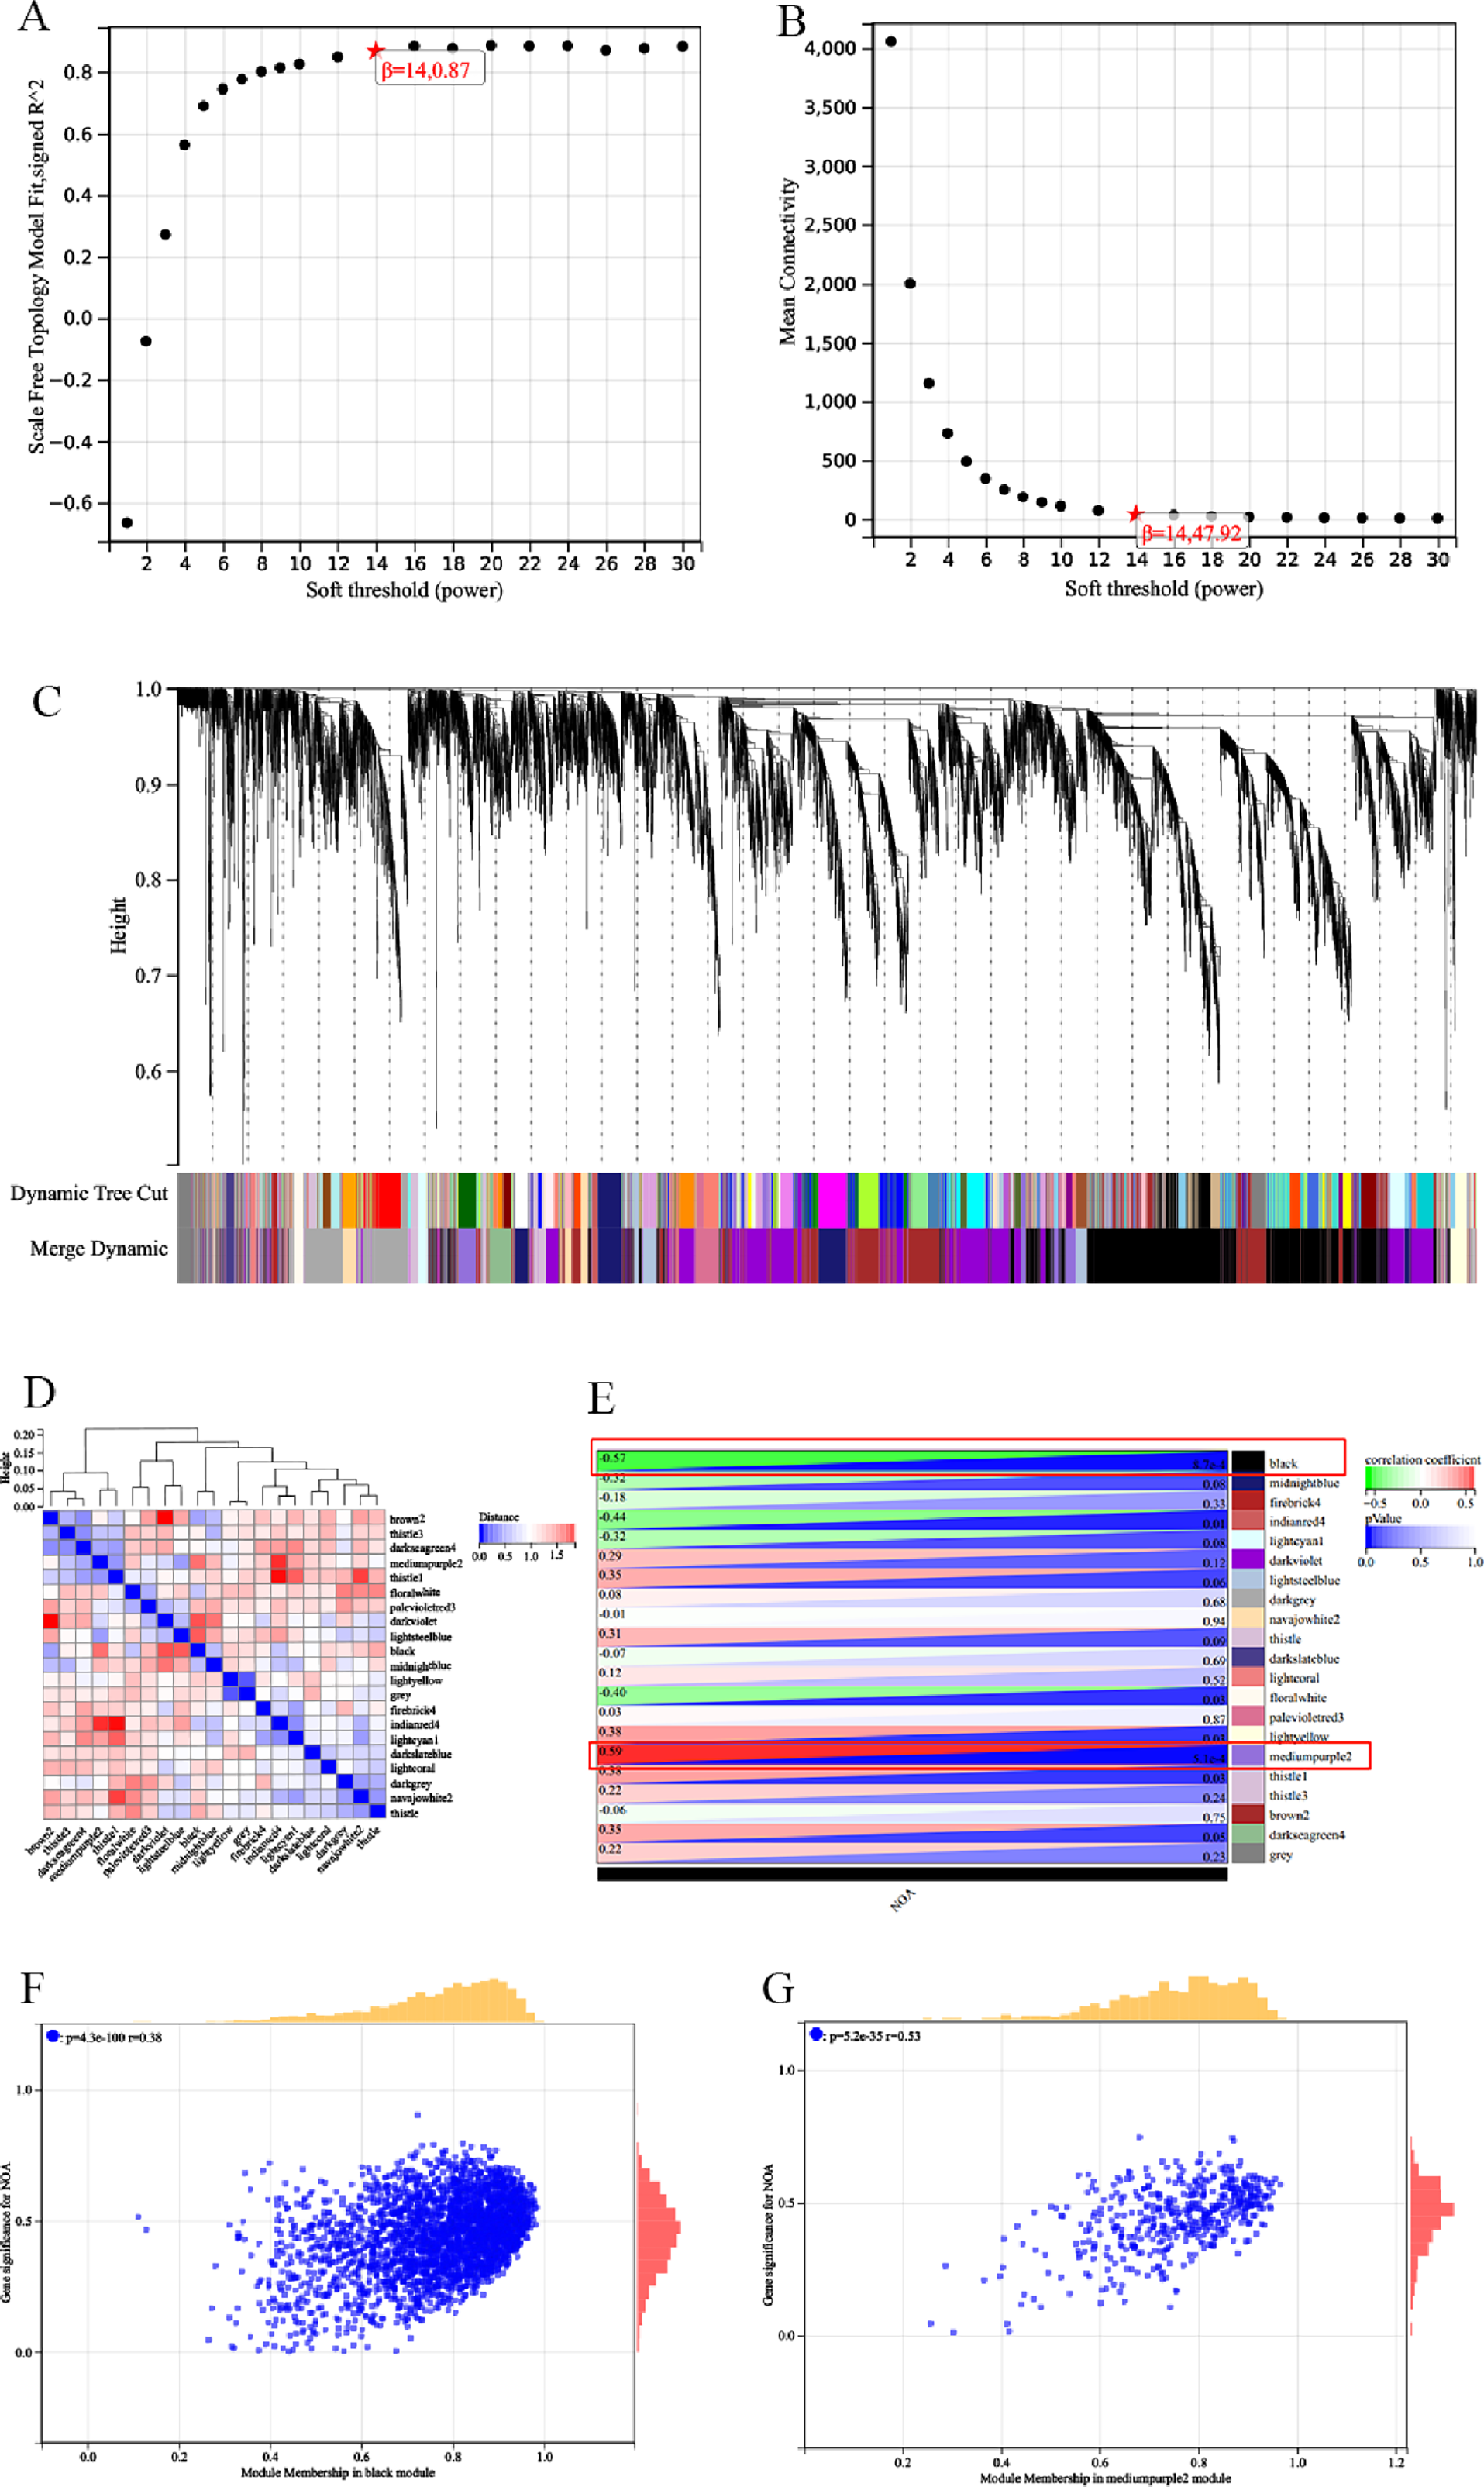
According to the best soft-thresholding power (β = 14), we constructed the co-expression network and divided the genes into 21 key modules and plotted the hierarchical clustering tree (Figure 2A–C). We then made a heatmap of module correlation to investigate the interaction between modules (Figure 2D). In order to find out the importance of each module, we performed a correlation analysis of the acquired modules with clinical features and constructed a correlation heat map. The results showed that the mediumpurple2 and black gene modules were most related to NOA (Figure 2F), specifically the most positively correlated module was mediumpurple2 (R = 0.59, p = 5.1e‒4) and the most negatively correlated module was black (R = ‒0.57, p = 8.7e‒4).
Weighted gene co-expression network analysis. (A, B) Confirmation of the soft threshold (β = 14) through scale independence and average connectivity calculations. (C) Hierarchical clustering tree displaying key modules. (D) Module correlation analysis. (E) Selection of modules associated with NOA based on module-trait relationships. (F, G) Scatter plots of gene significance versus module membership for the black and mediumpurple2 modules.

Venn diagrams and functional enrichment analysis
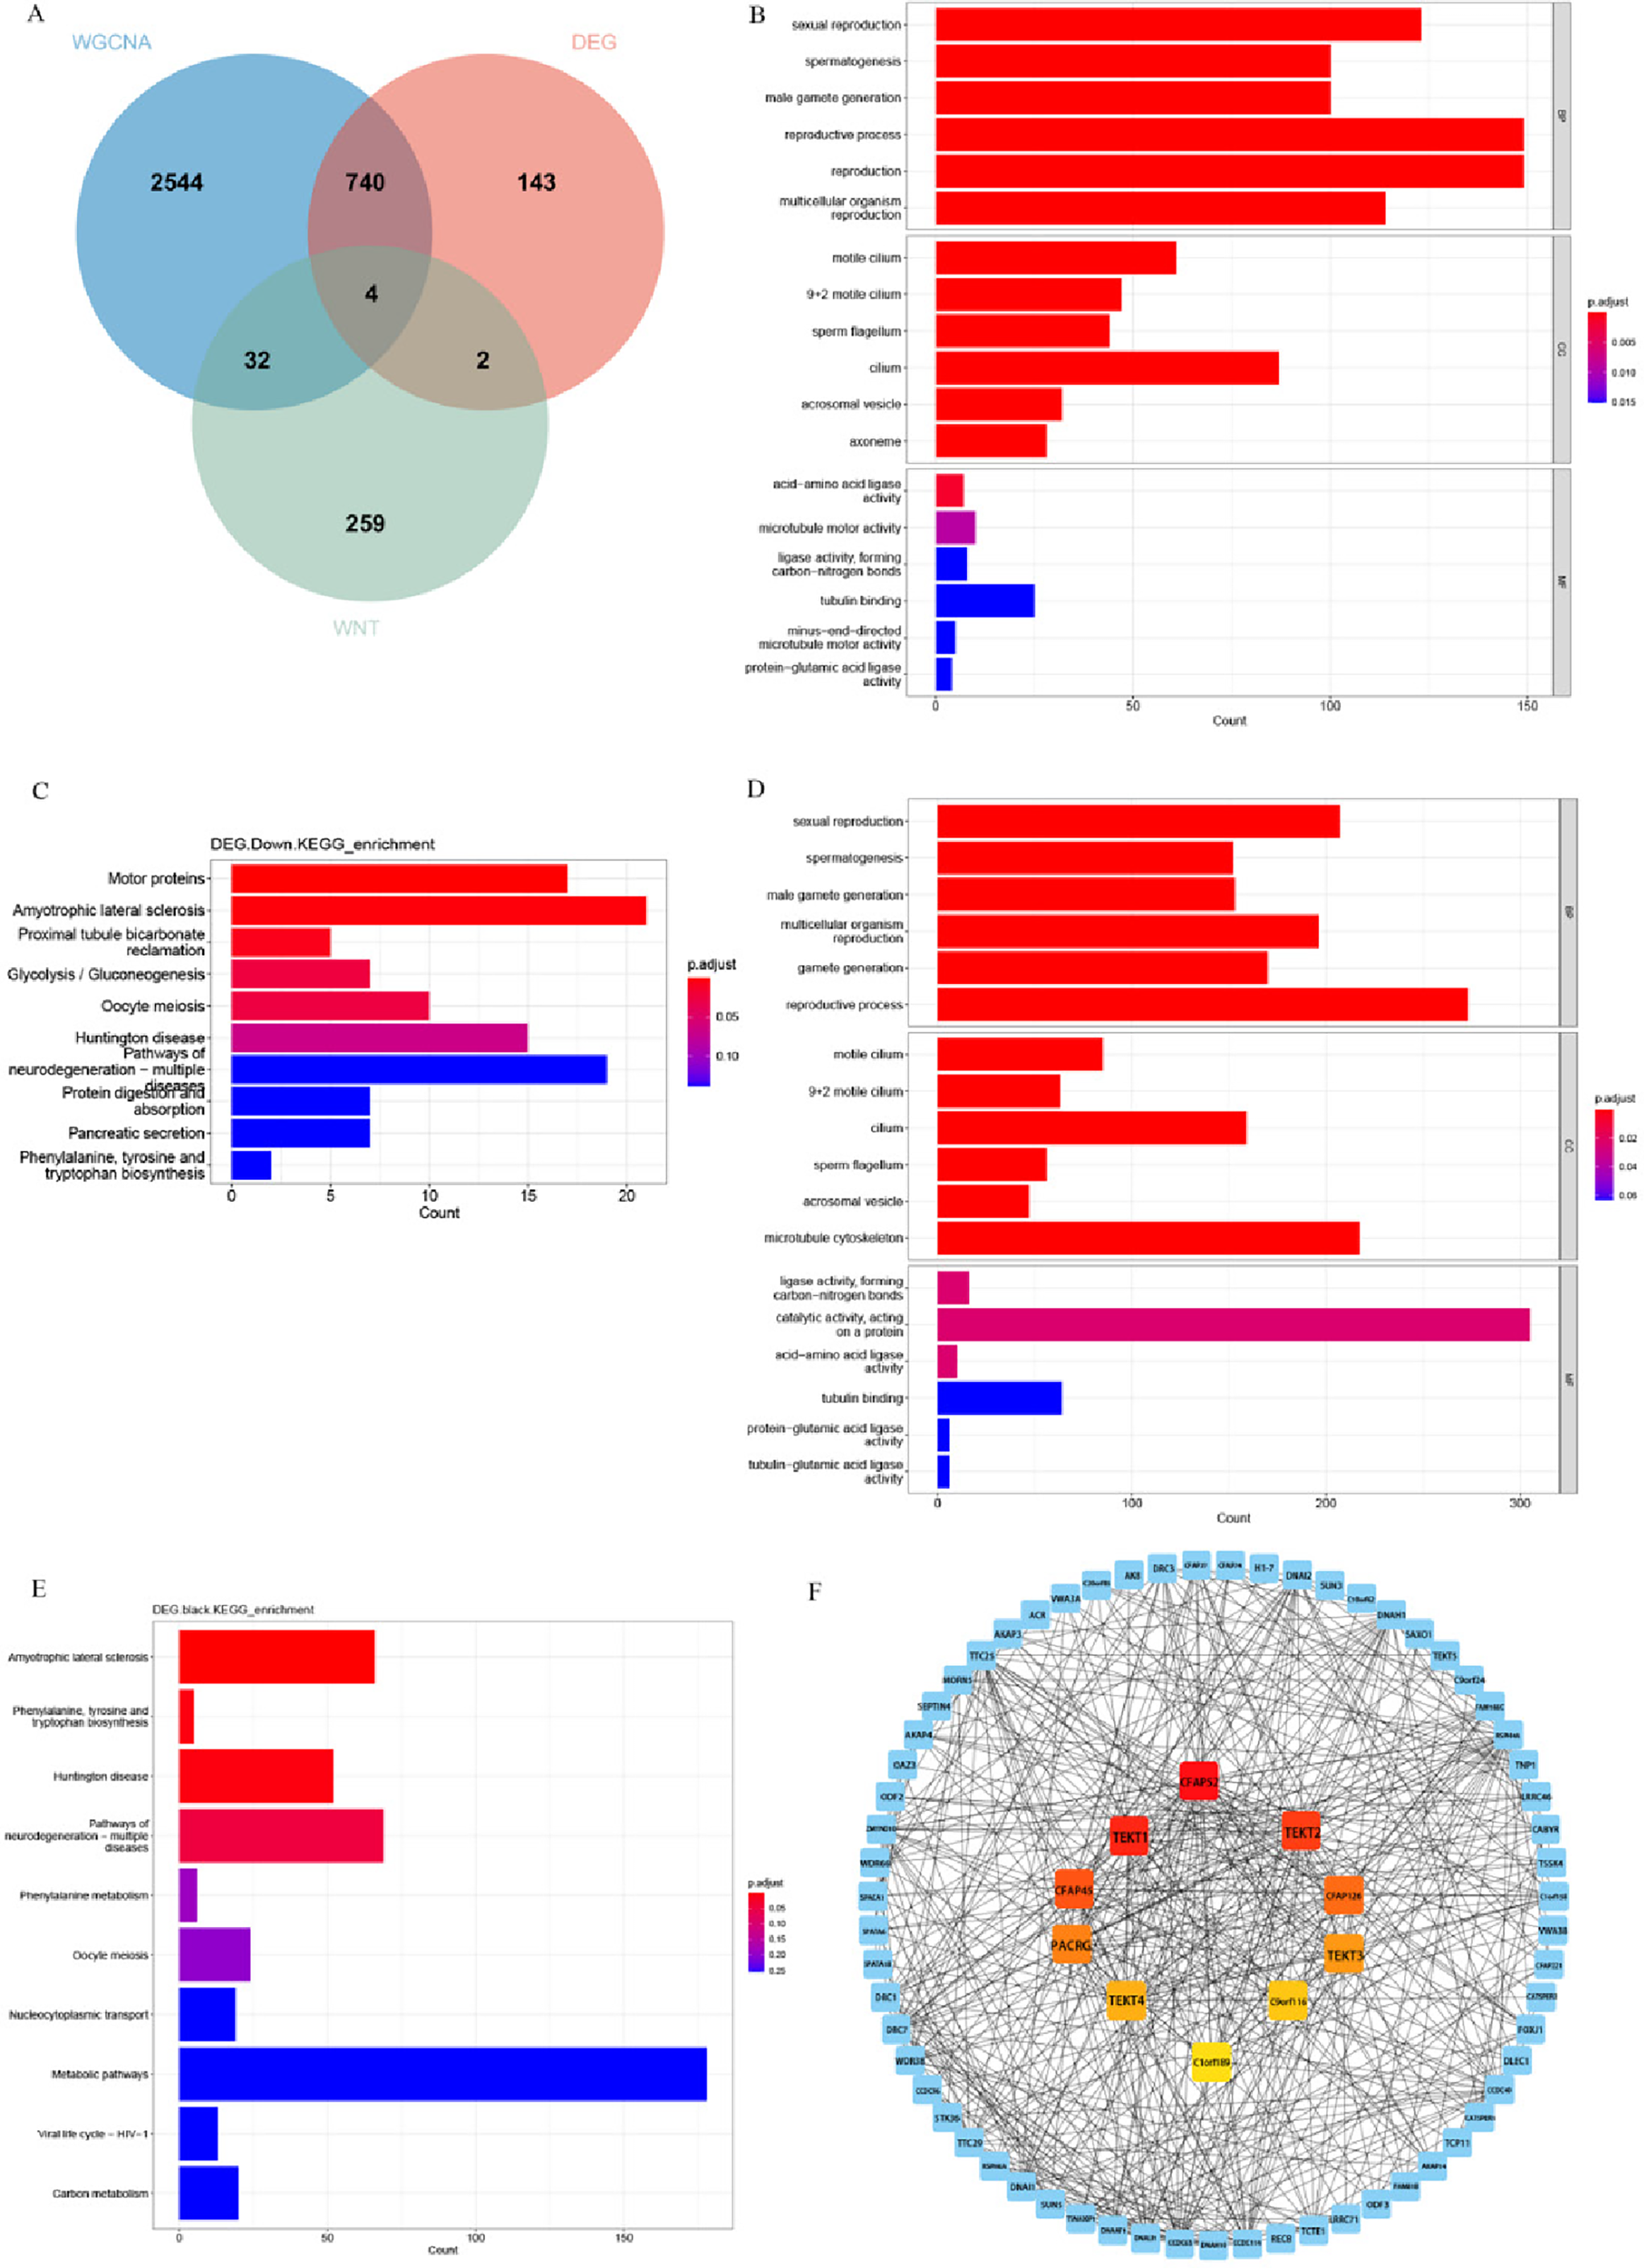
The intersection of these 889 DEGs with these 3320 genes analysed by WGCNA and these 297 genes associated with WNT signal pathway resulted in finally obtaining four hub genes: CSNK1G2, GNG3, H2AFB1 and PARD6A were shared among these three lists shown in the Venn diagram (Figure 3A).
Functional enrichment analysis. (A) Venn diagram showing key genes overlap among DEGs, Wnt-genes and WGCNA-black and mediumpurple2. (B) GO enrichment analysis was performed on down-DEGs. (C) KEGG enrichment analysis was performed on down-DEGs. (D) GO enrichment analysis was performed on DEGs within black module. (E) KEGG enrichment analysis was performed on DEGs within black module. (F) PPI network of top 10 down-DEGs calculated by the MCC method.

To obtain further insights into the biological functions of down-DEGs, we carried out GO and KEGG enrichment analysis (Supplementary Tables 2 and 3). GO functional enrichment includes BP, such as sexual reproduction, spermatogenesis, male gamete generation and reproductive process. CC components, enrichment was mainly noted in the motile cilium, sperm flagellum, acrosomal vesicle and axoneme. MF was enriched for acid-amino acid ligase activity, microtubule motor activity, ligase activity acting on carbon nitrogen bonds and tubulin binding (Figure 3B). For KEGG enrichment analysis, we found links to pathway categories like motor proteins, amyotrophic lateral sclerosis, proximal tubule bicarbonate reclamation, glycolysis/gluconeogenesis and oocyte meiosis (Figure 3C).
Furthermore, we performed functional enrichment analysis of the DEGs within the black module via GO and KEGG. In the BP assessment, the DEGs within the black module were mostly engaged in sexual reproduction, spermatogenesis, male gamete generation, multicellular organism reproduction and reproductive processes. In the CC category, enriched terms included motile cilium, sperm flagellum, acrosomal vesicle and microtubule cytoskeleton. In the MF assessment, ligase activity forming carbon-nitrogen bonds, catalytic activity acting on a protein and acid-amino acid ligase activity were included (Figure 3D). According to KEGG analysis, the DEGs within the black module were particularly enriched in amyotrophic lateral sclerosis, phenylalanine tyrosine and tryptophan biosynthesis, Huntington disease and pathways of neurodegeneration - multiple diseases (Figure 3E).
We constructed and analysed a PPI network for the downregulated DEGs. Using the MCC algorithm in the ‘Cytohubba’ plugin, we identified the top 10 genes showing the strongest interactions interactions within the gene network. These genes were CFAP52, TEKT1, C9orf116, CFAP45, PACRG, C1orf189, TEKT2, TEKT3, CFAP126, and TEKT4 (Figure 3F). These genes were predominantly involved in the regulating sperm flagellar assembly and motility.
Screening of hub gene
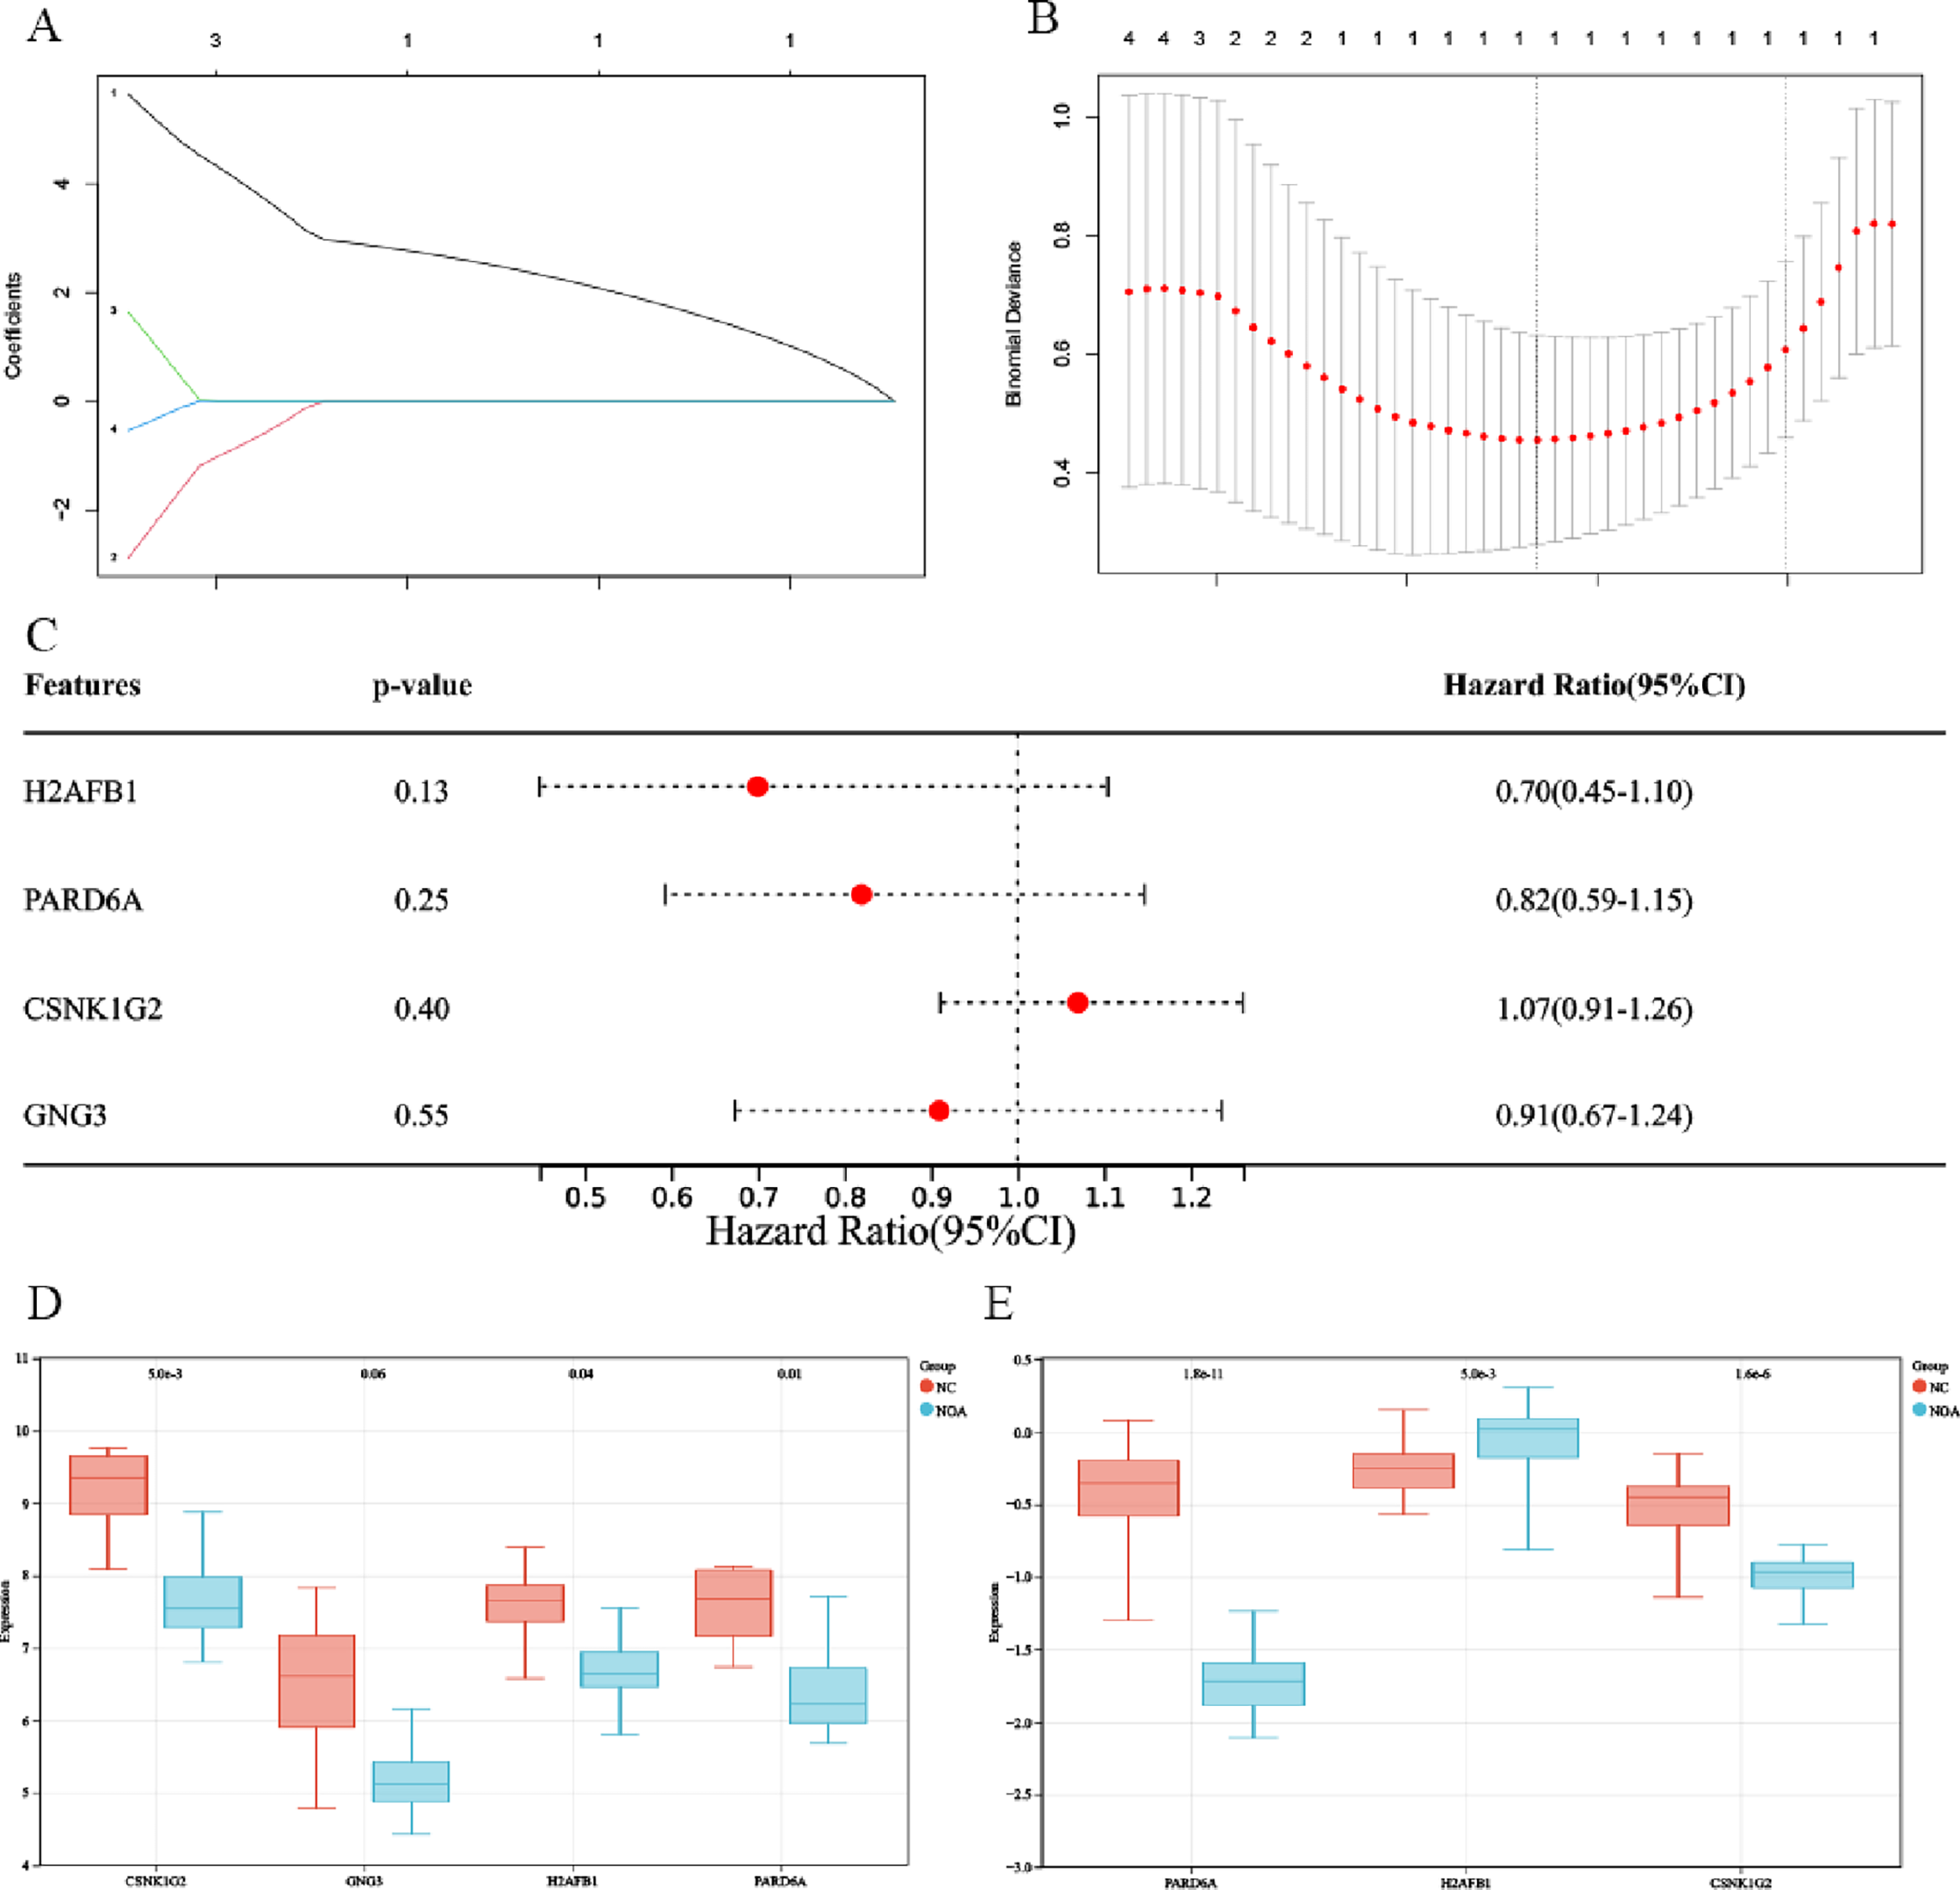
In first place we selected four hub genes among these intersected genes via LASSO regression algorithm (Figure 4A, B), and after the regression analysis, gene coefficients(geneCoef), which showed that there was only one significant gene CSNK1G2 and could be used as an important indicator of diagnosis for NOA. The result of the forest plot needed to be quantified by providing clinical samples data, which we structured by whether or not the patient has NOA and considered age as a time variable. However, given the low number of genes involved (four), these results are not statistically significant (Figure 4C).
Screening hub gene by machine learning and expression of key genes of external datasets. (A, B) LASSO regression algorithm. (C) Forest plot. (D) CSNK1G2, GNG3, H2AFB, PARD6A expression levels in GSE45887 dataset. (E) CSNK1G2, H2AFB, PARD6A expression levels in GSE9210 dataset.

Expression of four hub genes and validation of external datasets
When compared to the NC sample, we discovered the expression of these genes were lower in NOA in GSE45887 dataset (Figure 4D). We next confirmed the expression of these hub genes using another dataset, and the results revealed that CSNK1G2 and PARD6A were likewise lower expressed in NOA than NC in GSE9210, and they were all statistically significant (Figure 4E).
ROC curve analysis
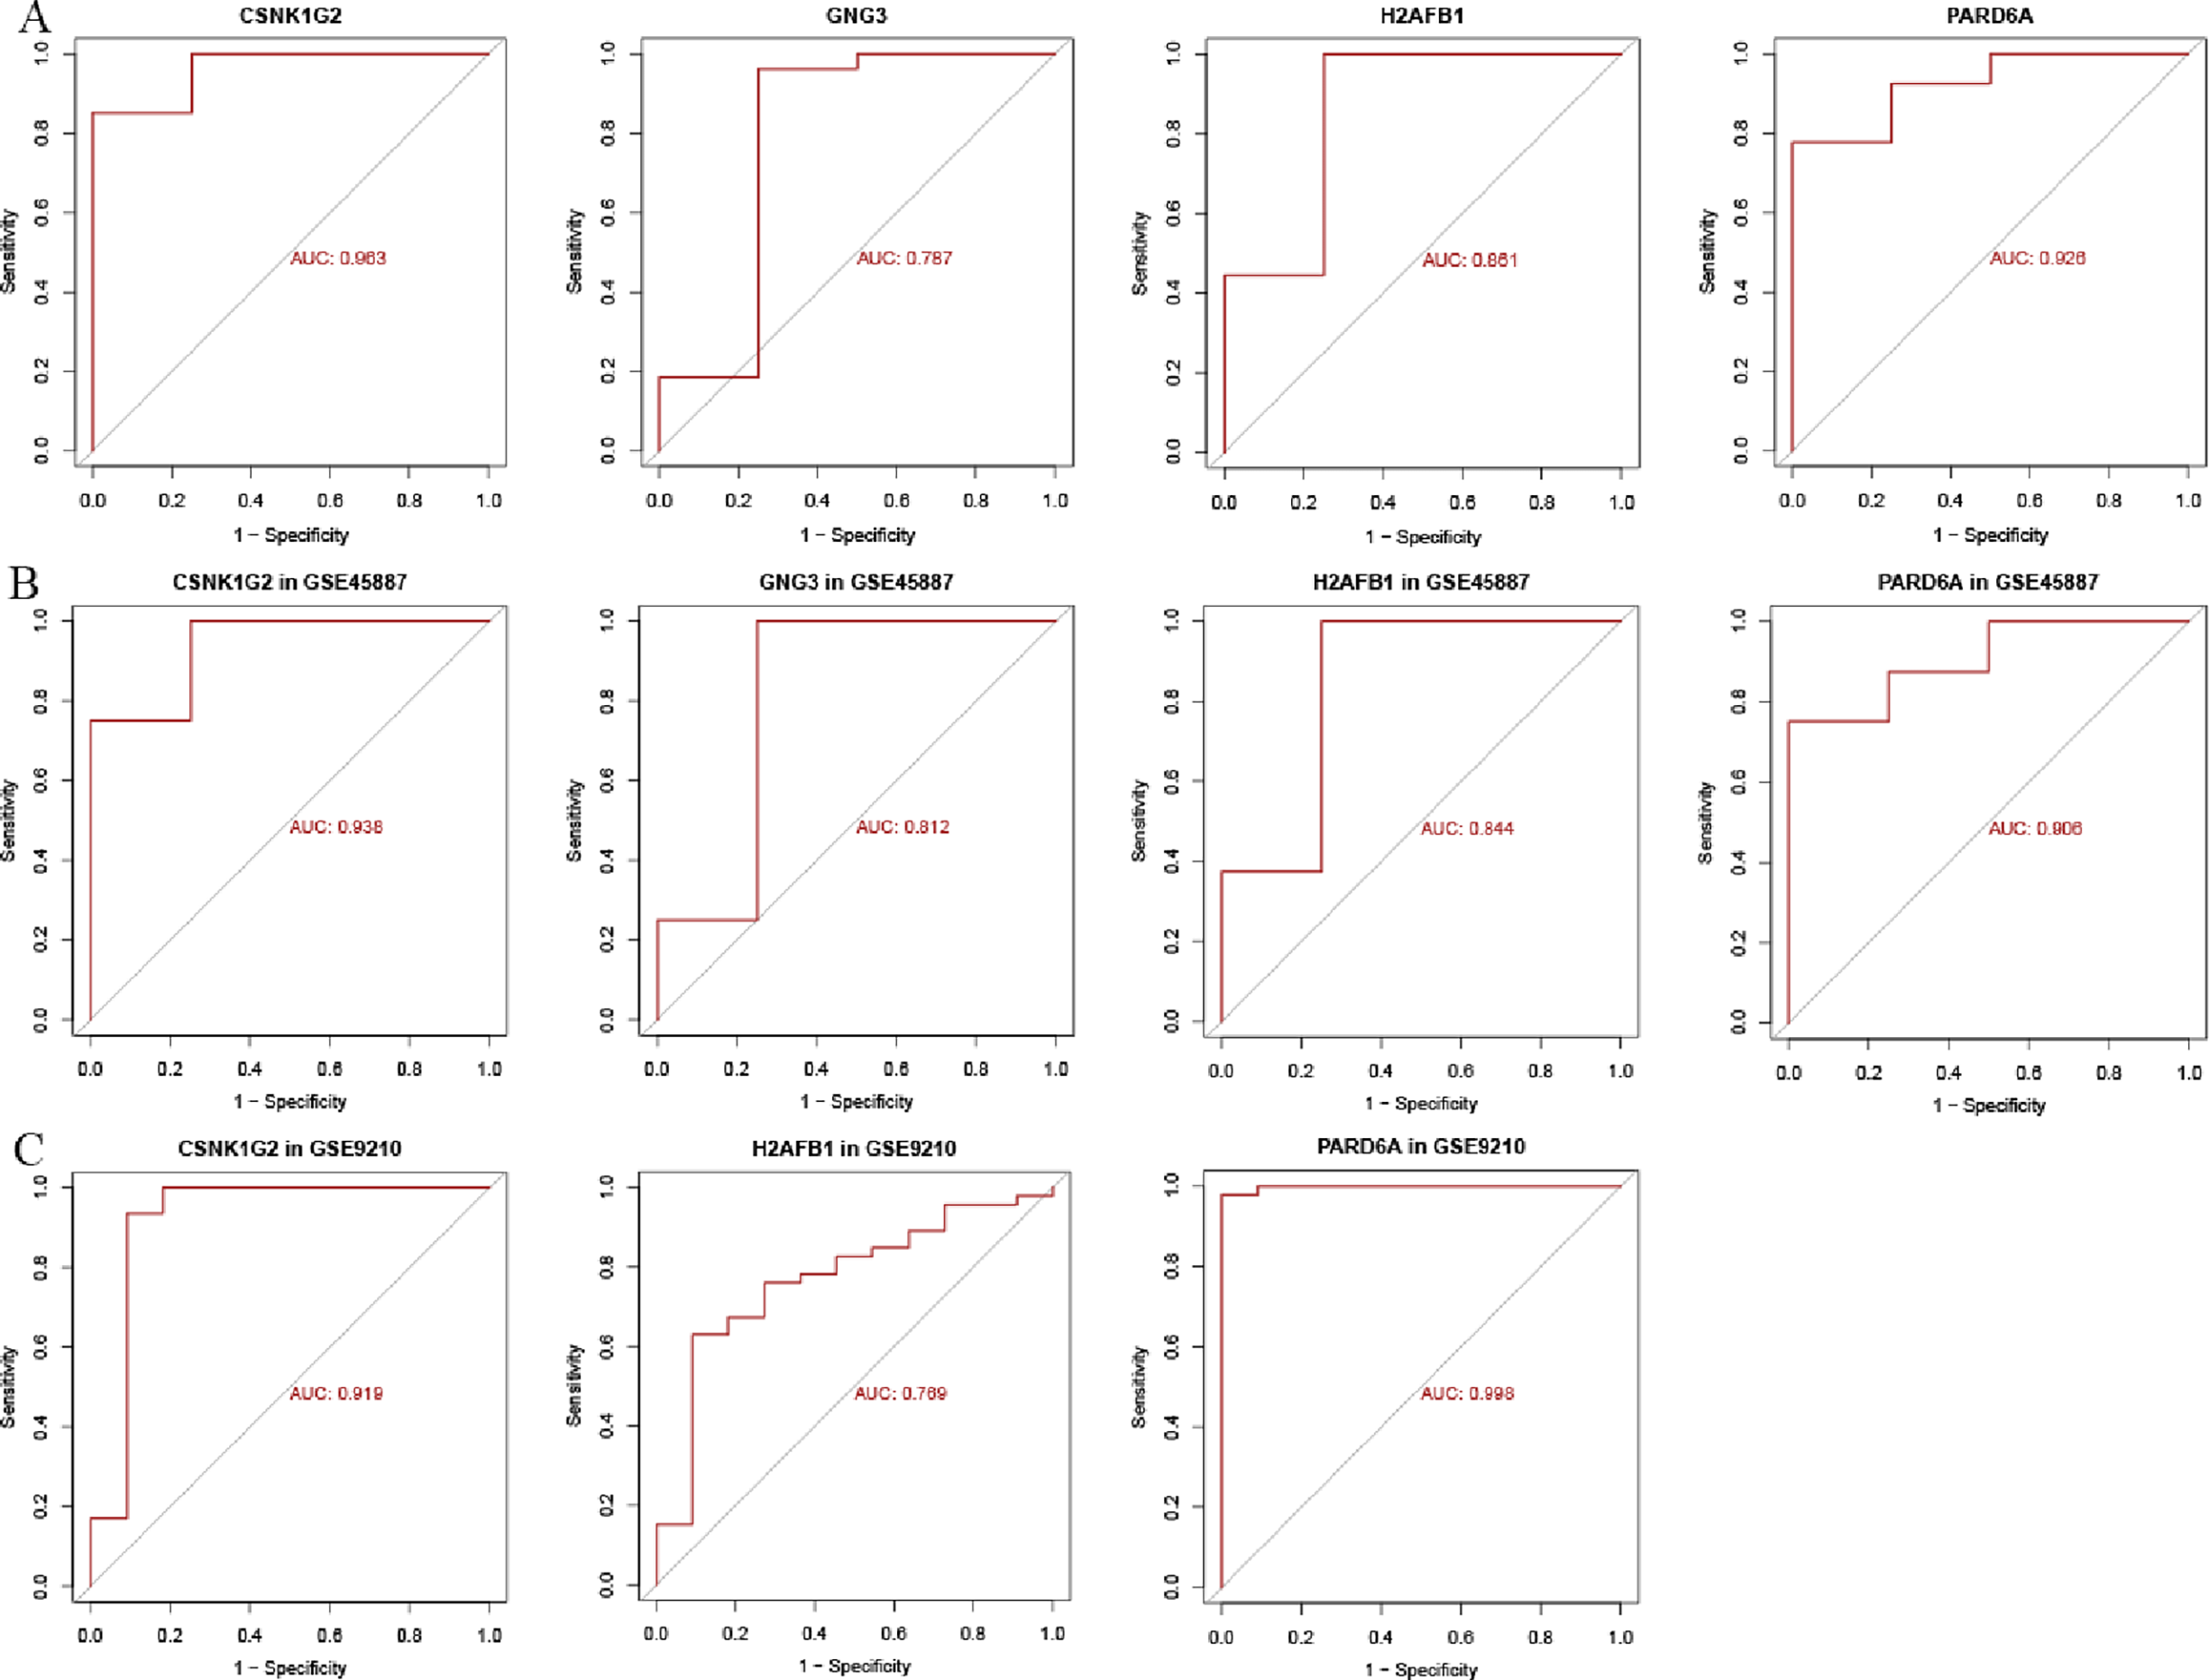
We found that these four hub genes have great diagnostic value to NOA. The reason of this statement was because we got a large AUC through our study, highlighting their high diagnostic potency (Figure 5A–C). In particular, for the GSE45885, GSE45887 and GSE9210 data sets, two of these genes - CSNK1G2 and PARD6A - yielded an area under the ROC curve greater than 0.9, which is shown in Figure 5A,C and which points to the high diagnostic power of these models.
ROC curve analysis of four key genes. (A) The ROC curves showing AUC values of CSNK1G2, GNG3, H2AFB, PARD6A in GSE45885 dataset. (B) CSNK1G2, GNG3, H2AFB and PARD6A in GSE45887 dataset were validated using ROC curves. (C) CSNK1G2, GNG3, H2AFB and PARD6A in GSE9210 dataset were validated using ROC curves.

Immune infiltration analysis
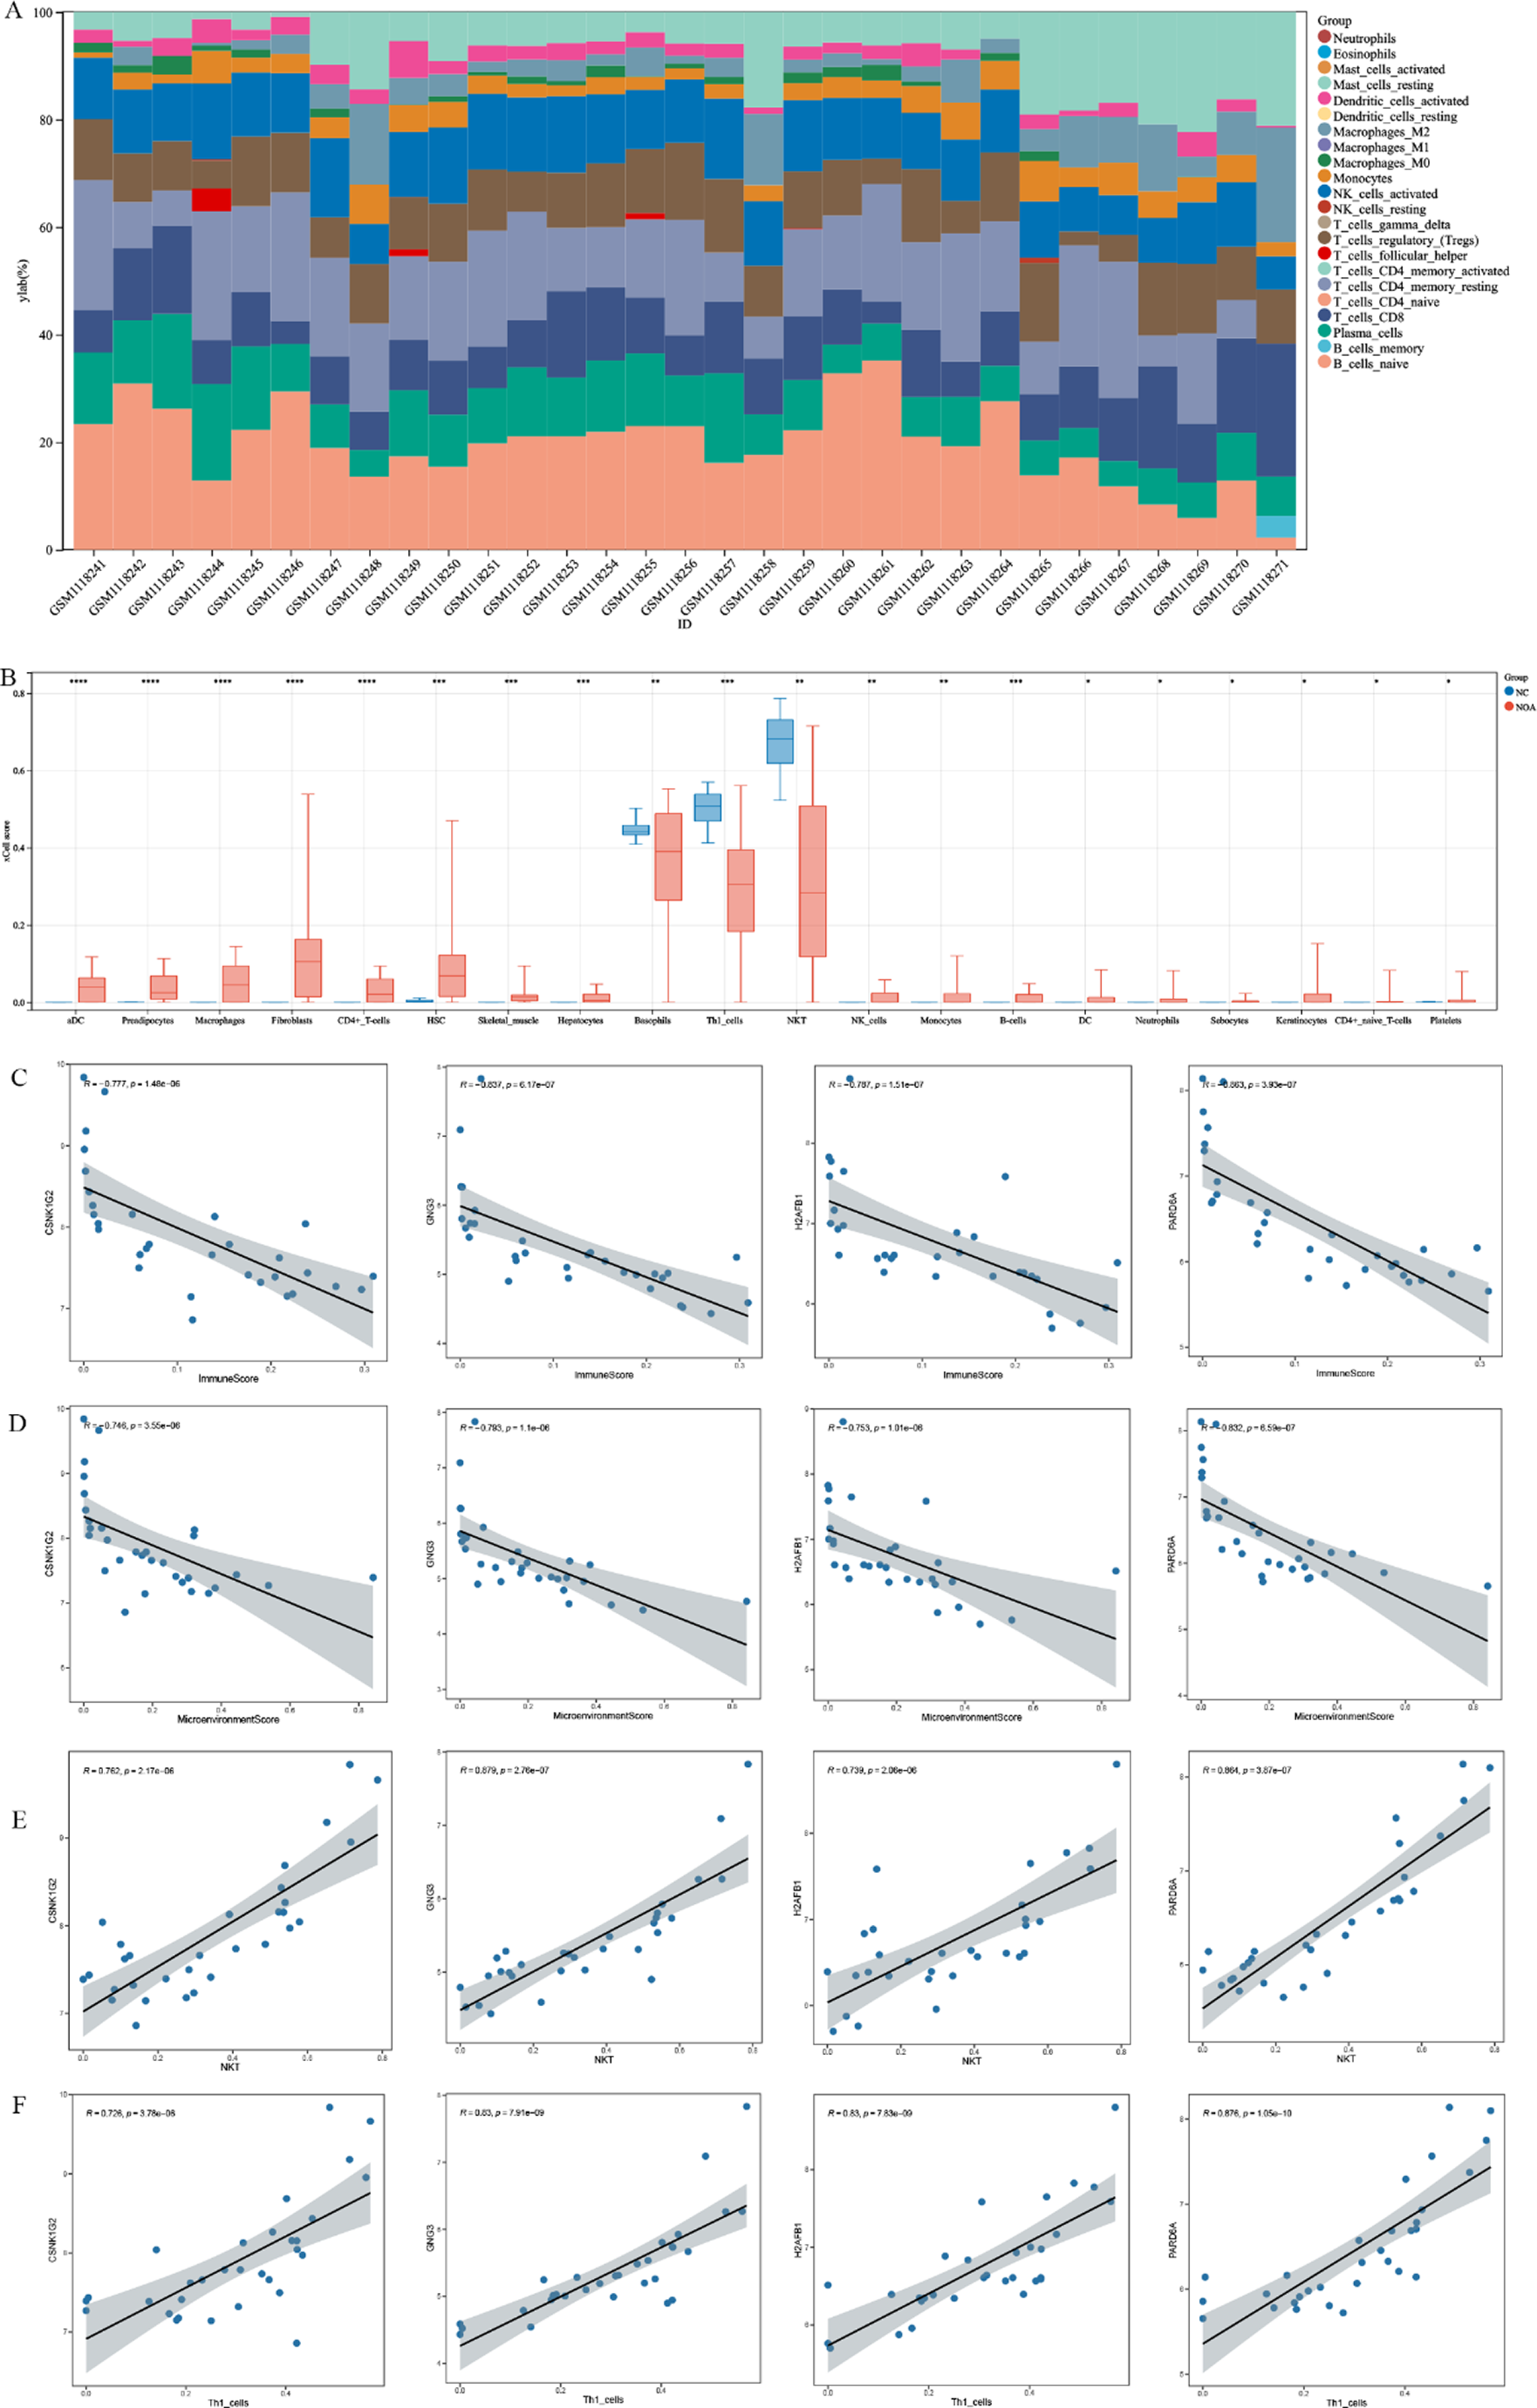
We also tested samples from GSE45885 to study immune cell infiltration in NOA, which revealed the relative distribution of 22 kinds of immune cells by using the CIBERSORT algorithm (Figure 6A). The xCELL was used to estimate the difference in immune cells between NOA and OA group patients. Results indicated that the infiltration levels of fibroblasts, aDC, HSC and stromaScore, macrophages, preadipocytes, skeletal muscle, immuneScore, microenvironmentScore and smooth muscle were higher in NOA group compared with OA group, while the infiltration levels of the fractions of NKT and Th1 cells were lower in NOA group (Figure 6B). These observations prompted us to further investigate the potential regulatory roles of key genes in modulating immune cell infiltration. A Spearman correlation test was conducted to examine the correlations between the identified key genes and immune infiltration cells. These four hub genes were negatively correlated with immuneScore and microenvironmentScore, which may be related to regulating immune cell infiltration and testicular immune microenvironment. In addition, these genes co-expressed positively to NKT or Th1 cells, which suggested that they contributed to facilitate infiltration of those immune cells into NOA microenvironment (Figure 6C–F). These results confirm not only the involvement of immune cell infiltration in NOA pathogenesis but also highlight the potential diagnostic value of CSNK1G2, GNG3, H2AFB and PARD6A for NOA.
Immune infiltration analysis of NOA. (A) Relative distribution of 22 kinds of immune cells. (B) The difference of immune cell infiltration between NOA and NC groups. (C–F) Correlation analysis between four key genes and immune infiltration cells.

GSEA analysis
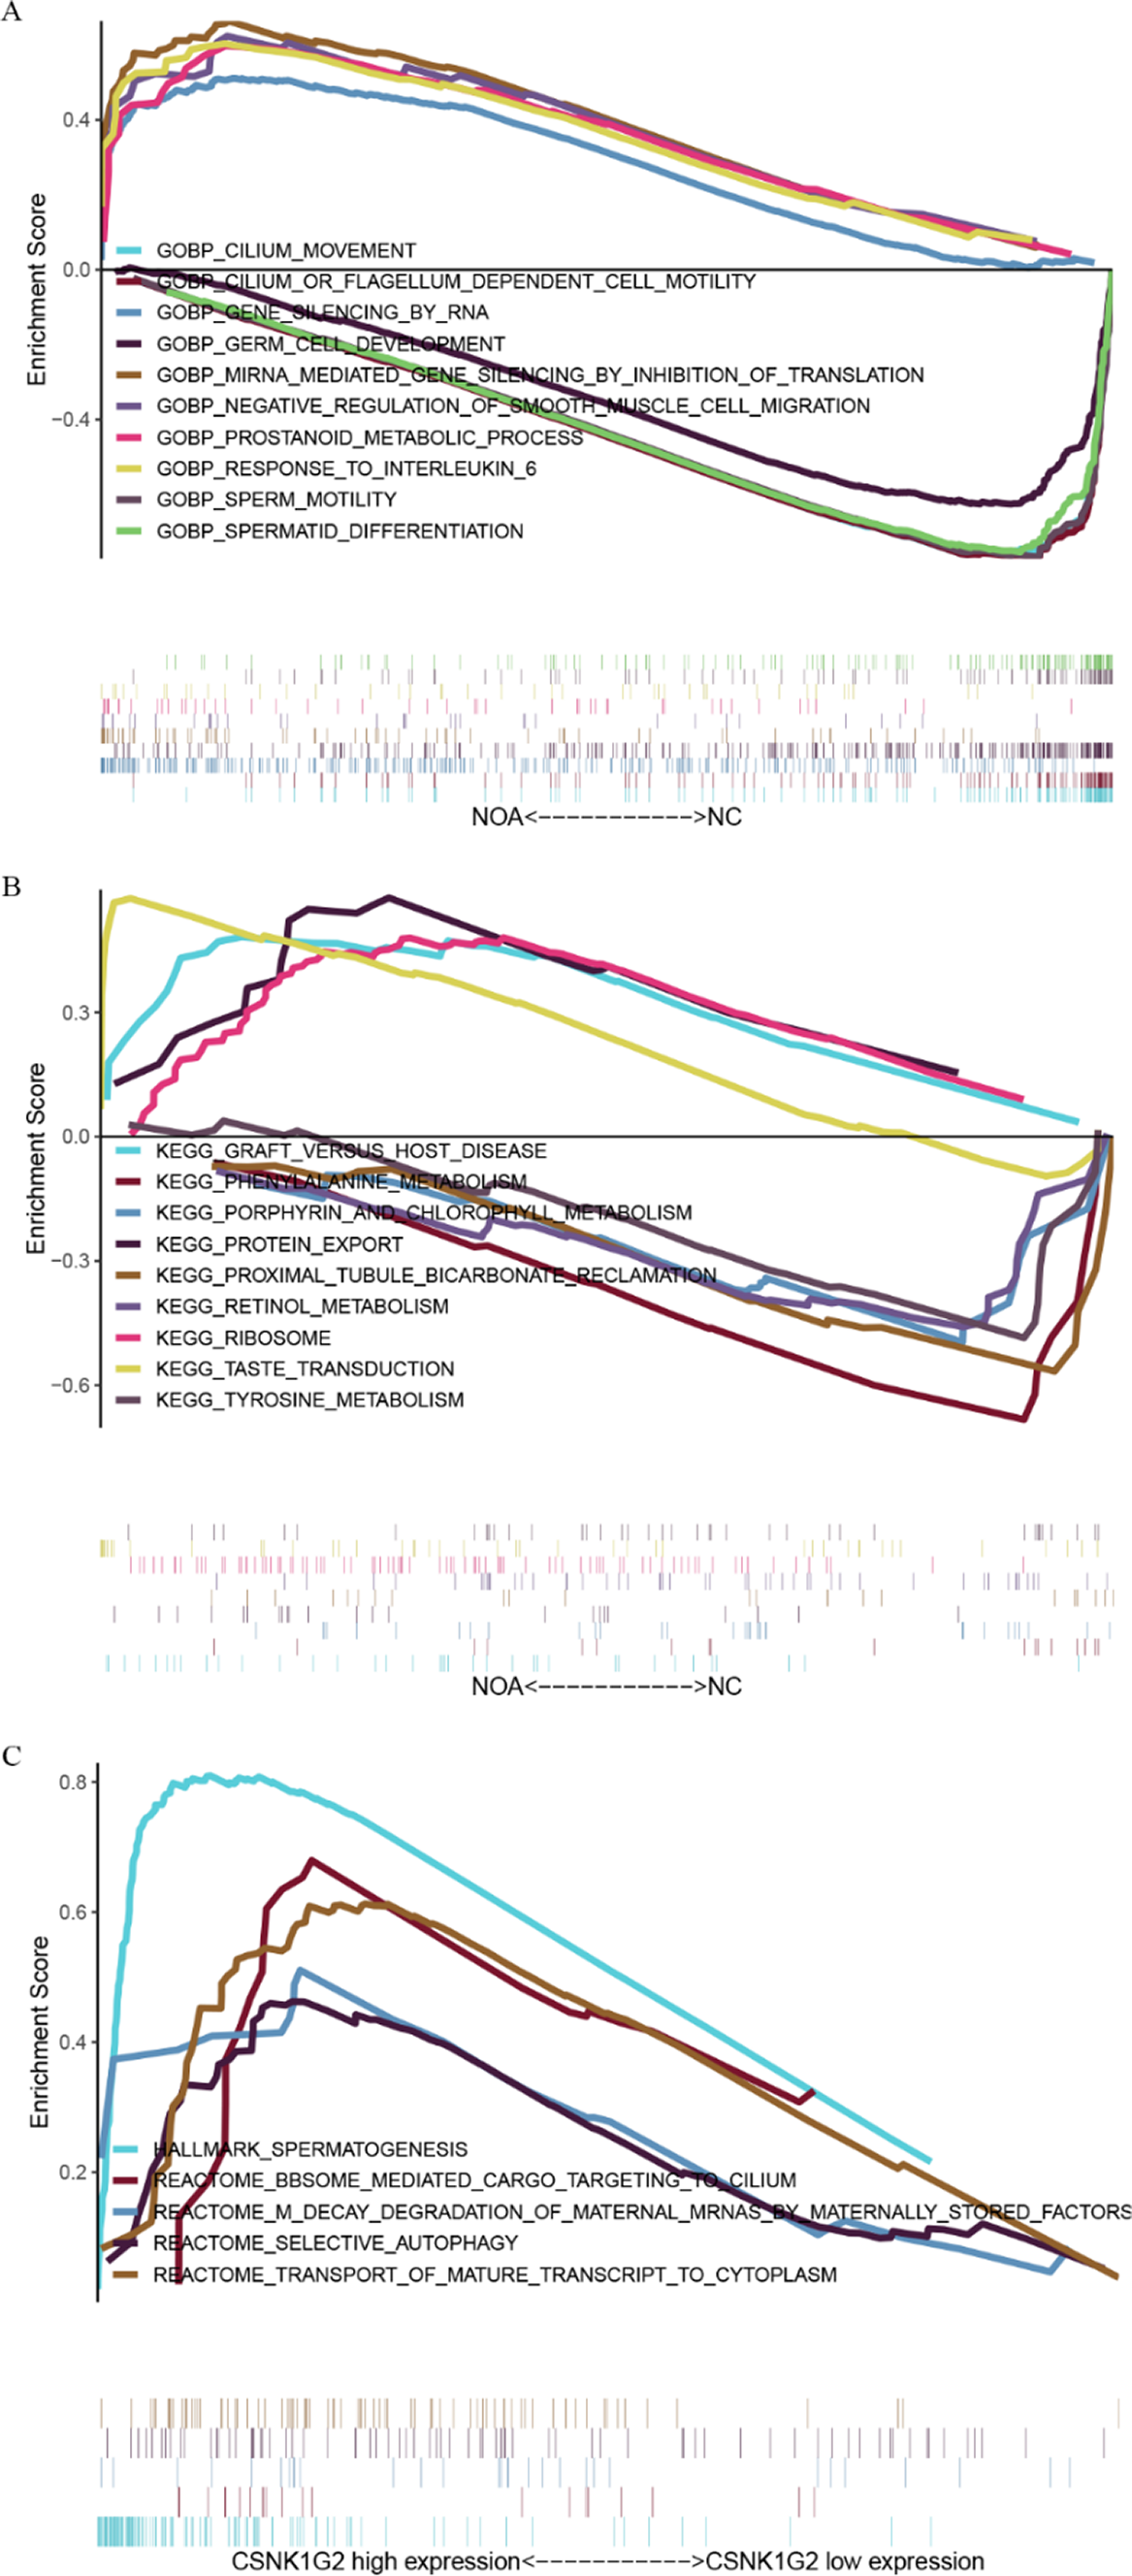
The GSEA results showed that there were marked differences in GO-BP and KEGG pathway between NOA patients and NC group (Figure 7A,B). In NOA patients, up-regulated GO-BP consisted of miRNA mediated gene silencing by inhibition of translation, gene silencing by RNA, prostanoid metabolic process, negative regulation of smooth muscle cell migration and response to interleukin 6. It is worth noting that the down-regulated GO-BP of NOA patients included cilium movement, cilium or flagellum dependent cell motility, spermatid differentiation, sperm motility and germ cell development. Up-regulated pathway indicated increased gene silencing and inflammatory response, while the down-regulated pathways suggested defects in sperm development and motility.
GSEA analysis. (A, B) GSEA results revealed distinct differences in GO-BP and KEGG pathways between NOA patients and NC group. (C) GSEA analysis of CSNK1G2.

Based on the results of GSEA (Figure 7C), the KEGG pathway that was upregulated in NOA patients mainly included taste transduction, ribosome, protein export and graft versus host disease. The downregulated KEGG pathways included phenylalanine metabolism, proximal tubule bicarbonate reclamation, tyrosine metabolism, porphyrin and chlorophyll metabolism and retinol metabolism. The upregulated pathway reflected a possible compensatory mechanism as well as the involvement of an immune response whereas the down-regulated pathway highlighted disruption to metabolism and cell functioning. It is worth noting that CSNK1G2 high expression group was highly enriched for spermatogenesis, transport of mature transcript to cytoplasm, BBSome-mediated cargo targeting to cilium, selective autophagy and M decay degradation of maternal mRNAs by maternally stored factors.
CSNK1G2 expression characteristics and functional associations in NOA
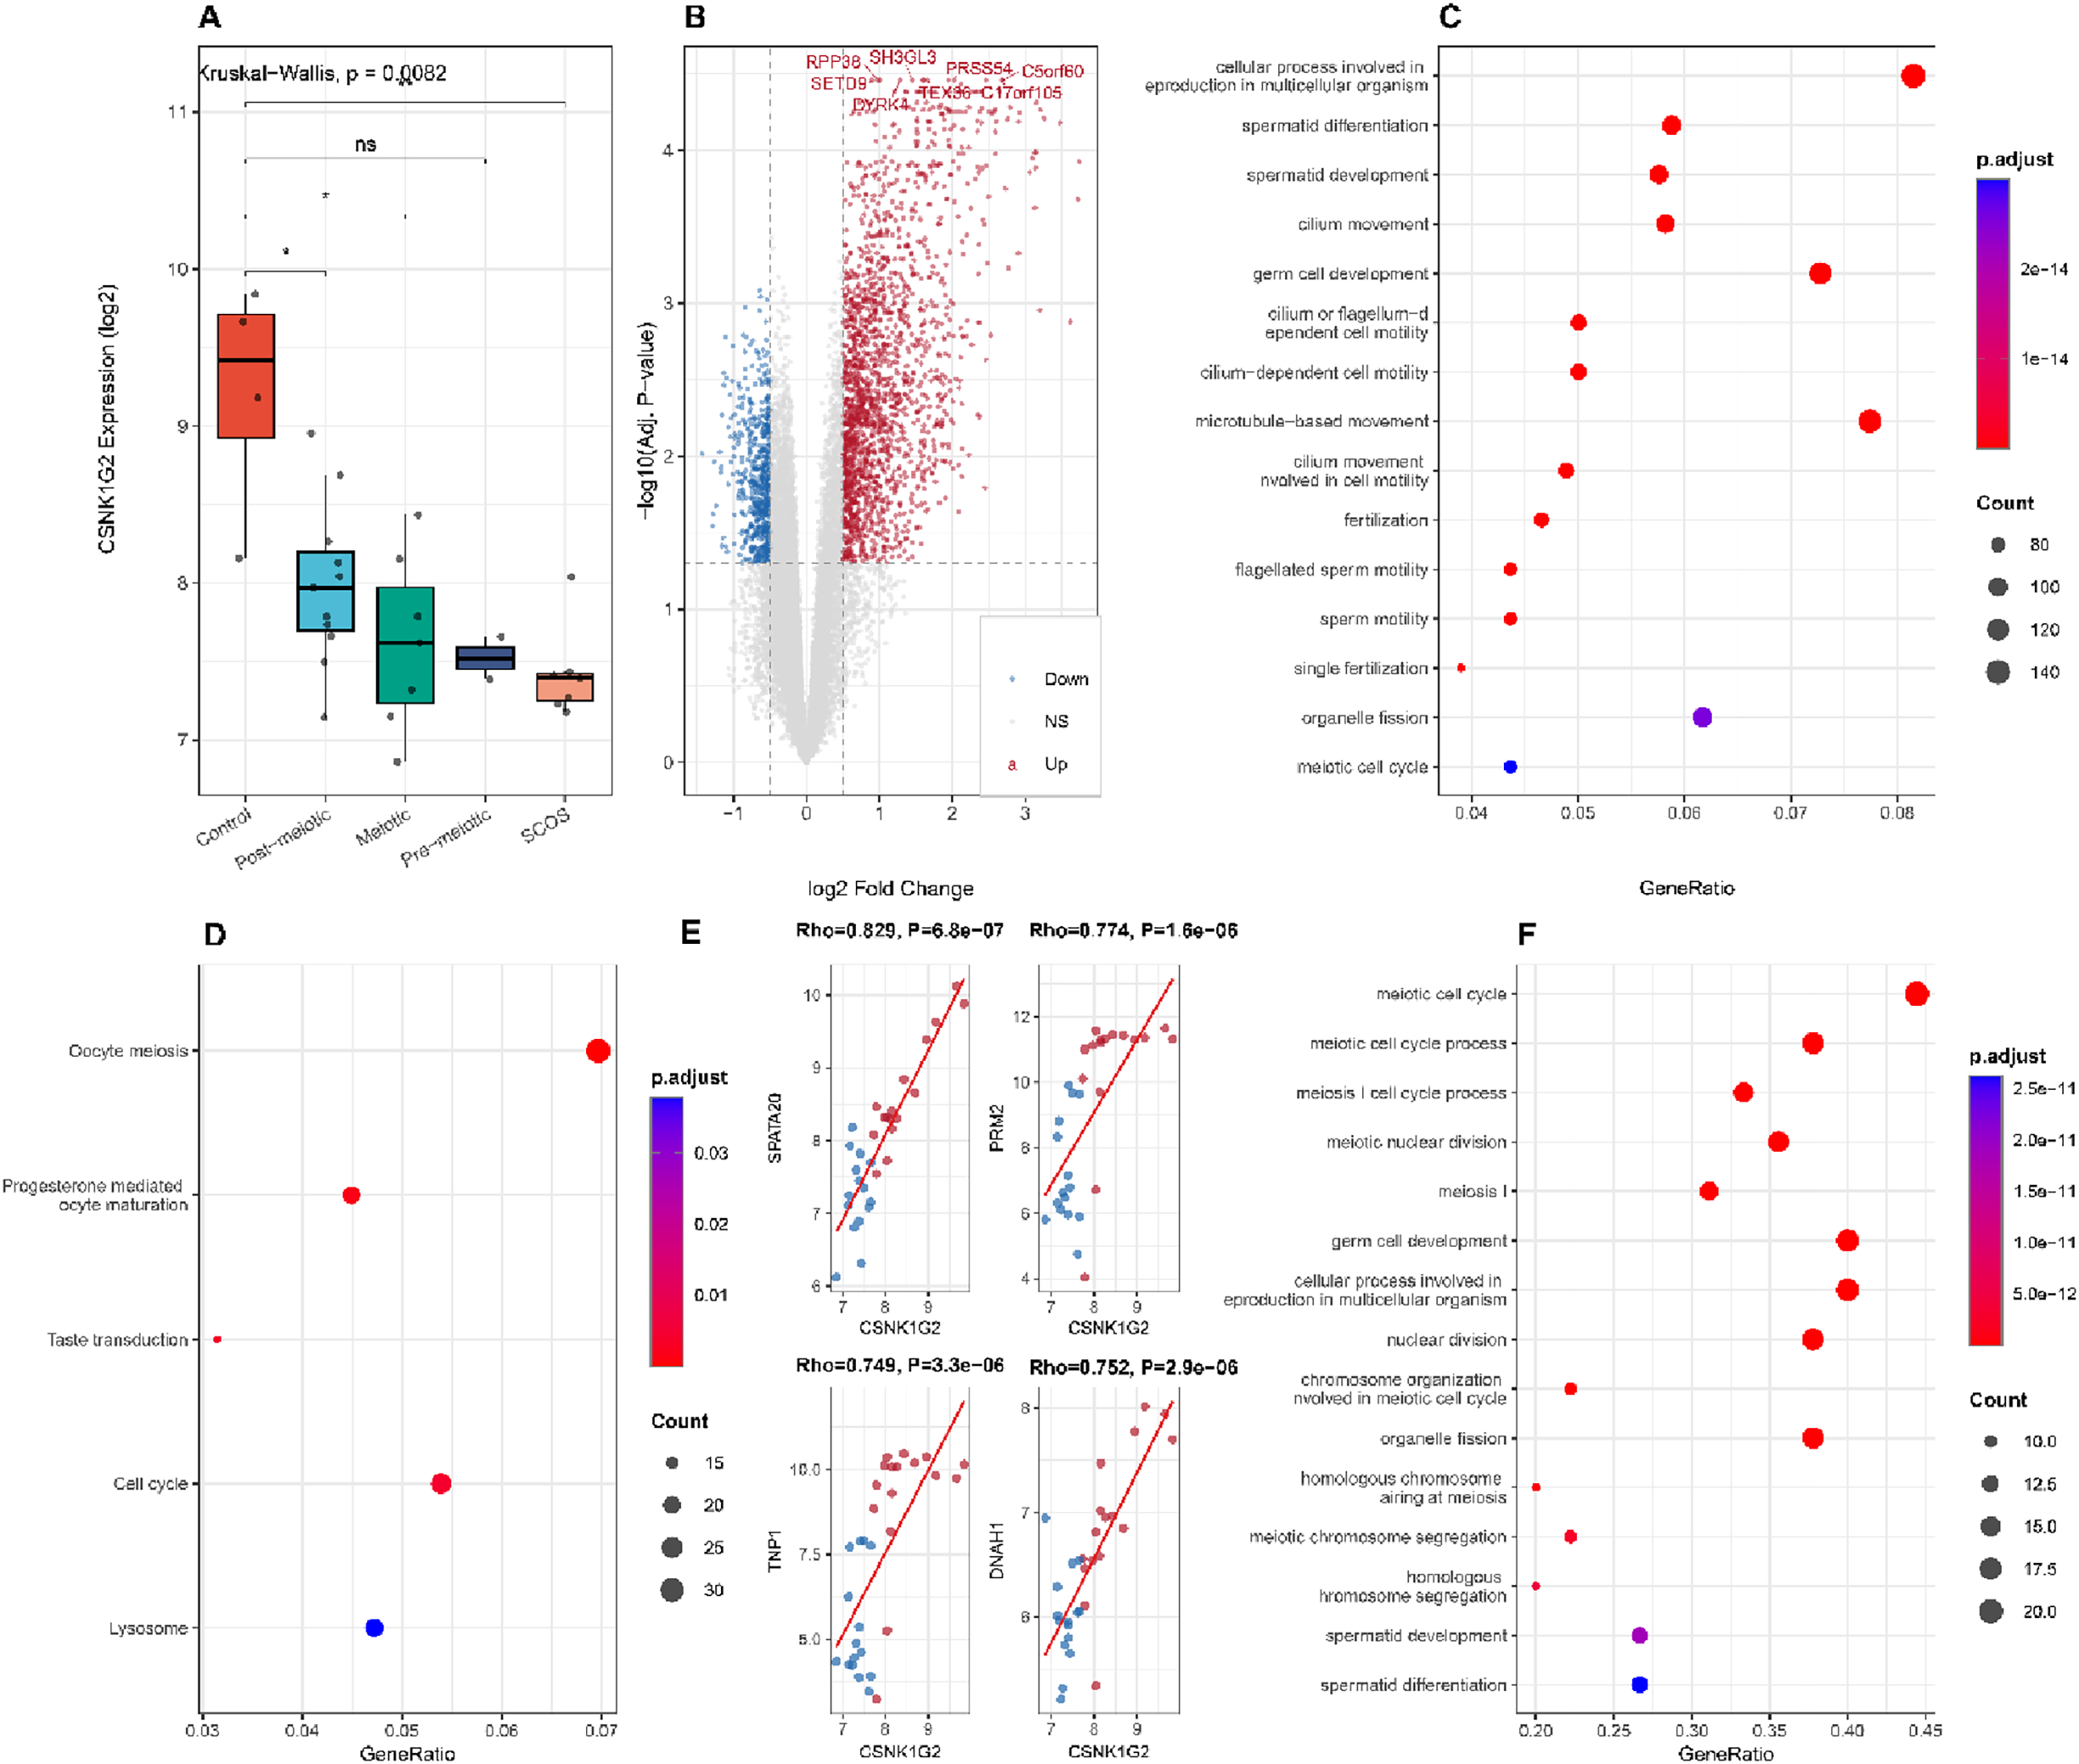
To better understand the expression pattern of CSNK1G2 across different NOA subtypes, we compared CSNK1G2 levels among controls and four histopathological subtypes. CSNK1G2 expression progressively decreased from controls (mean = 9.21) to post-meiotic arrest (7.99), meiotic arrest (7.62), pre-meiotic arrest (7.52) and SCOS (7.42) (Figure 8A). Significant differences were observed between controls and post-meiotic arrest (P = 0.010), meiotic arrest (P = 0.012) and SCOS (P = 0.006), suggesting that CSNK1G2 downregulation correlates with the severity of spermatogenic impairment.
Exploration of CSNK1G2 expression characteristics and functional associations in NOA. (A) CSNK1G2 expression across NOA histopathological subtypes. (B) Volcano plot of DEGs between CSNK1G2 high-expression and low-expression groups. (C) GO-BP enrichment analysis of DEGs from CSNK1G2 high vs low comparison. (D) KEGG enrichment analysis of DEGs from CSNK1G2 high vs low comparison. (E) Scatter plots showing Spearman correlations between CSNK1G2 and top spermatogenesis-related genes (SPATA20, PRM2, TNP1, DNAH1). (F) GO-BP enrichment analysis of spermatogenesis genes significantly correlated with CSNK1G2.

To explore the functional consequences of CSNK1G2 expression variation, we divided all samples into CSNK1G2-high (n = 16) and CSNK1G2-low (n = 15) groups based on the median expression value. Differential expression analysis identified 2,492 DEGs between the two groups, including 1,896 upregulated and 596 downregulated genes in the CSNK1G2-high group (Figure 8B). GO enrichment analysis revealed that DEGs in the CSNK1G2-high group were significantly enriched in spermatid differentiation, spermatid development, cilium movement, fertilization and flagellated sperm motility (Figure 8C). KEGG pathway analysis further highlighted oocyte meiosis, progesterone-mediated oocyte maturation, cell cycle and taste transduction as the top enriched pathways (Figure 8D), indicating that higher CSNK1G2 expression is associated with the activation of spermatogenesis-related programmes.
Furthermore, we investigated the correlation between CSNK1G2 and a curated set of 107 spermatogenesis-related genes. Among 81 genes detected in the dataset, 49 showed significant correlation with CSNK1G2 (P < 0.05). Notably, CSNK1G2 exhibited strong positive correlations with several key spermatogenesis genes, including SPATA20 (Rho = 0.829), PRM2 (Rho = 0.774), TNP1 (Rho = 0.749), and DNAH1 (Rho = 0.752) (Figure 8E). GO enrichment analysis of the significantly correlated genes demonstrated strong enrichment in meiotic cell cycle, spermatid development, canonical Wnt signaling pathway and piRNA processing (Figure 8F). Interestingly, while CSNK1G2 showed positive correlations with several Wnt pathway members (WNT7A, LEF1), it displayed negative correlations with others (CTNNB1, WNT4, WNT3A, APC, TCF7L2), suggesting a complex regulatory relationship between CSNK1G2 and Wnt signaling in spermatogenesis.
Construction of the miRNAs-mRNA-TFs regulatory network and prediction of small molecule drugs
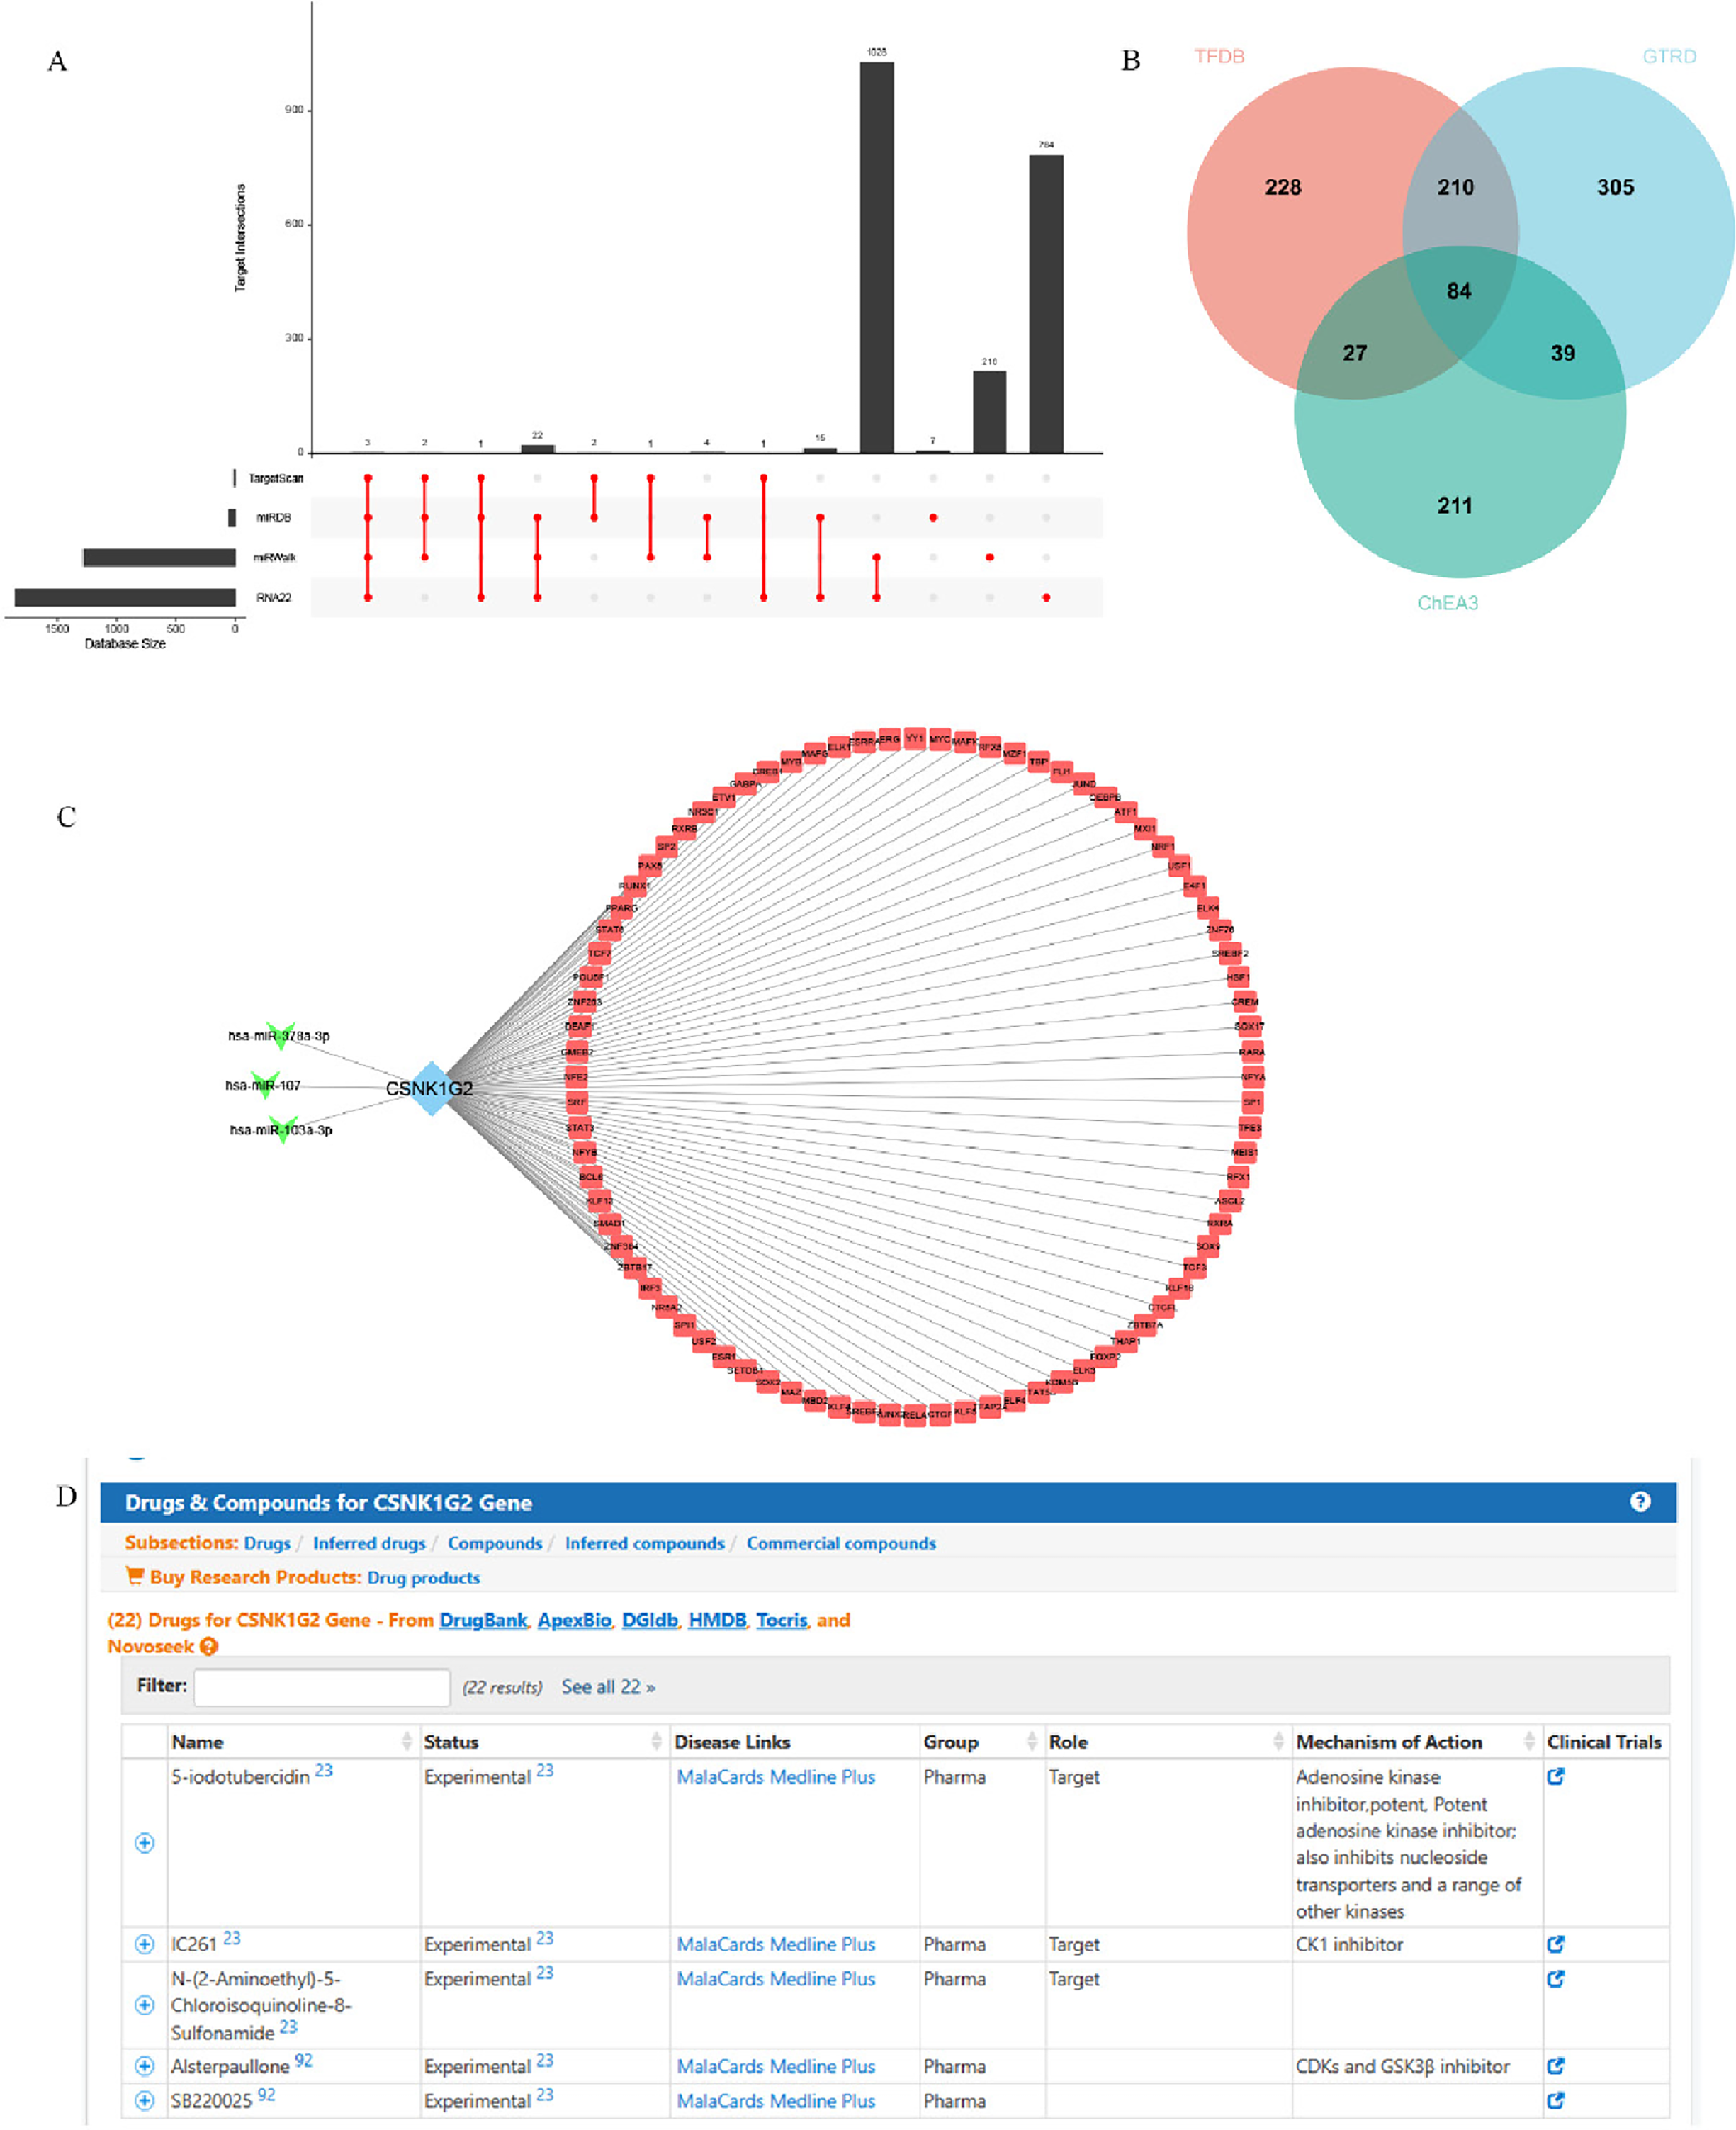
For miRNA prediction, we used four databases (miRDB, miRWalk, RNA22, TargetScan) and took their intersection. We plotted these results with an upset plot (Figure 9A). These resulted in three candidate miRNAs; hsa-miR-103a-3p, hsa-miR-107 and hsa-miR-378a-3p. We then proceeded with predicting putative regulators (TFs) for those miRNAs as well as putative targets (mRNAs). To do so, we collected the three most complete TF databases (i.e., TFDB, GTRD and ChEA3) and took their intersection of predicted binding sites as a consensus set. This gave us, was shown in the form of a Venn diagram in Figure 9B. There are 84 TFs which are probably crucial for regulating WNT signal pathway and then NOA. And we show the miRNAs-mRNA-TFs regulatory network (Figure 9C). In addition, five potential drugs targeting CSNK1G2 were screened using the GeneCards database, including 5-iodotubercidin, IC261, N-(2-Aminoethyl)-5-Chloroisoquinoline-8-Sulphonamide, Alsterpaullone and SB220025 (Figure 9D).
Regulatory network of miRNAs-mRNA-TFs. (A) Upset diagram illustrating the overlap of predicted miRNAs among 4 databases. (B) Venn diagram showing the overlap of predicted TFs among 3 databases. (C) Interaction network of miRNAs-mRNA-TFs. (D) Prediction of potential therapeutic agents targeting CSNK1G2 using GeneCards database.

Expression of CSNK1G2 and WNT pathway genes in NOA testicular biopsy tissues
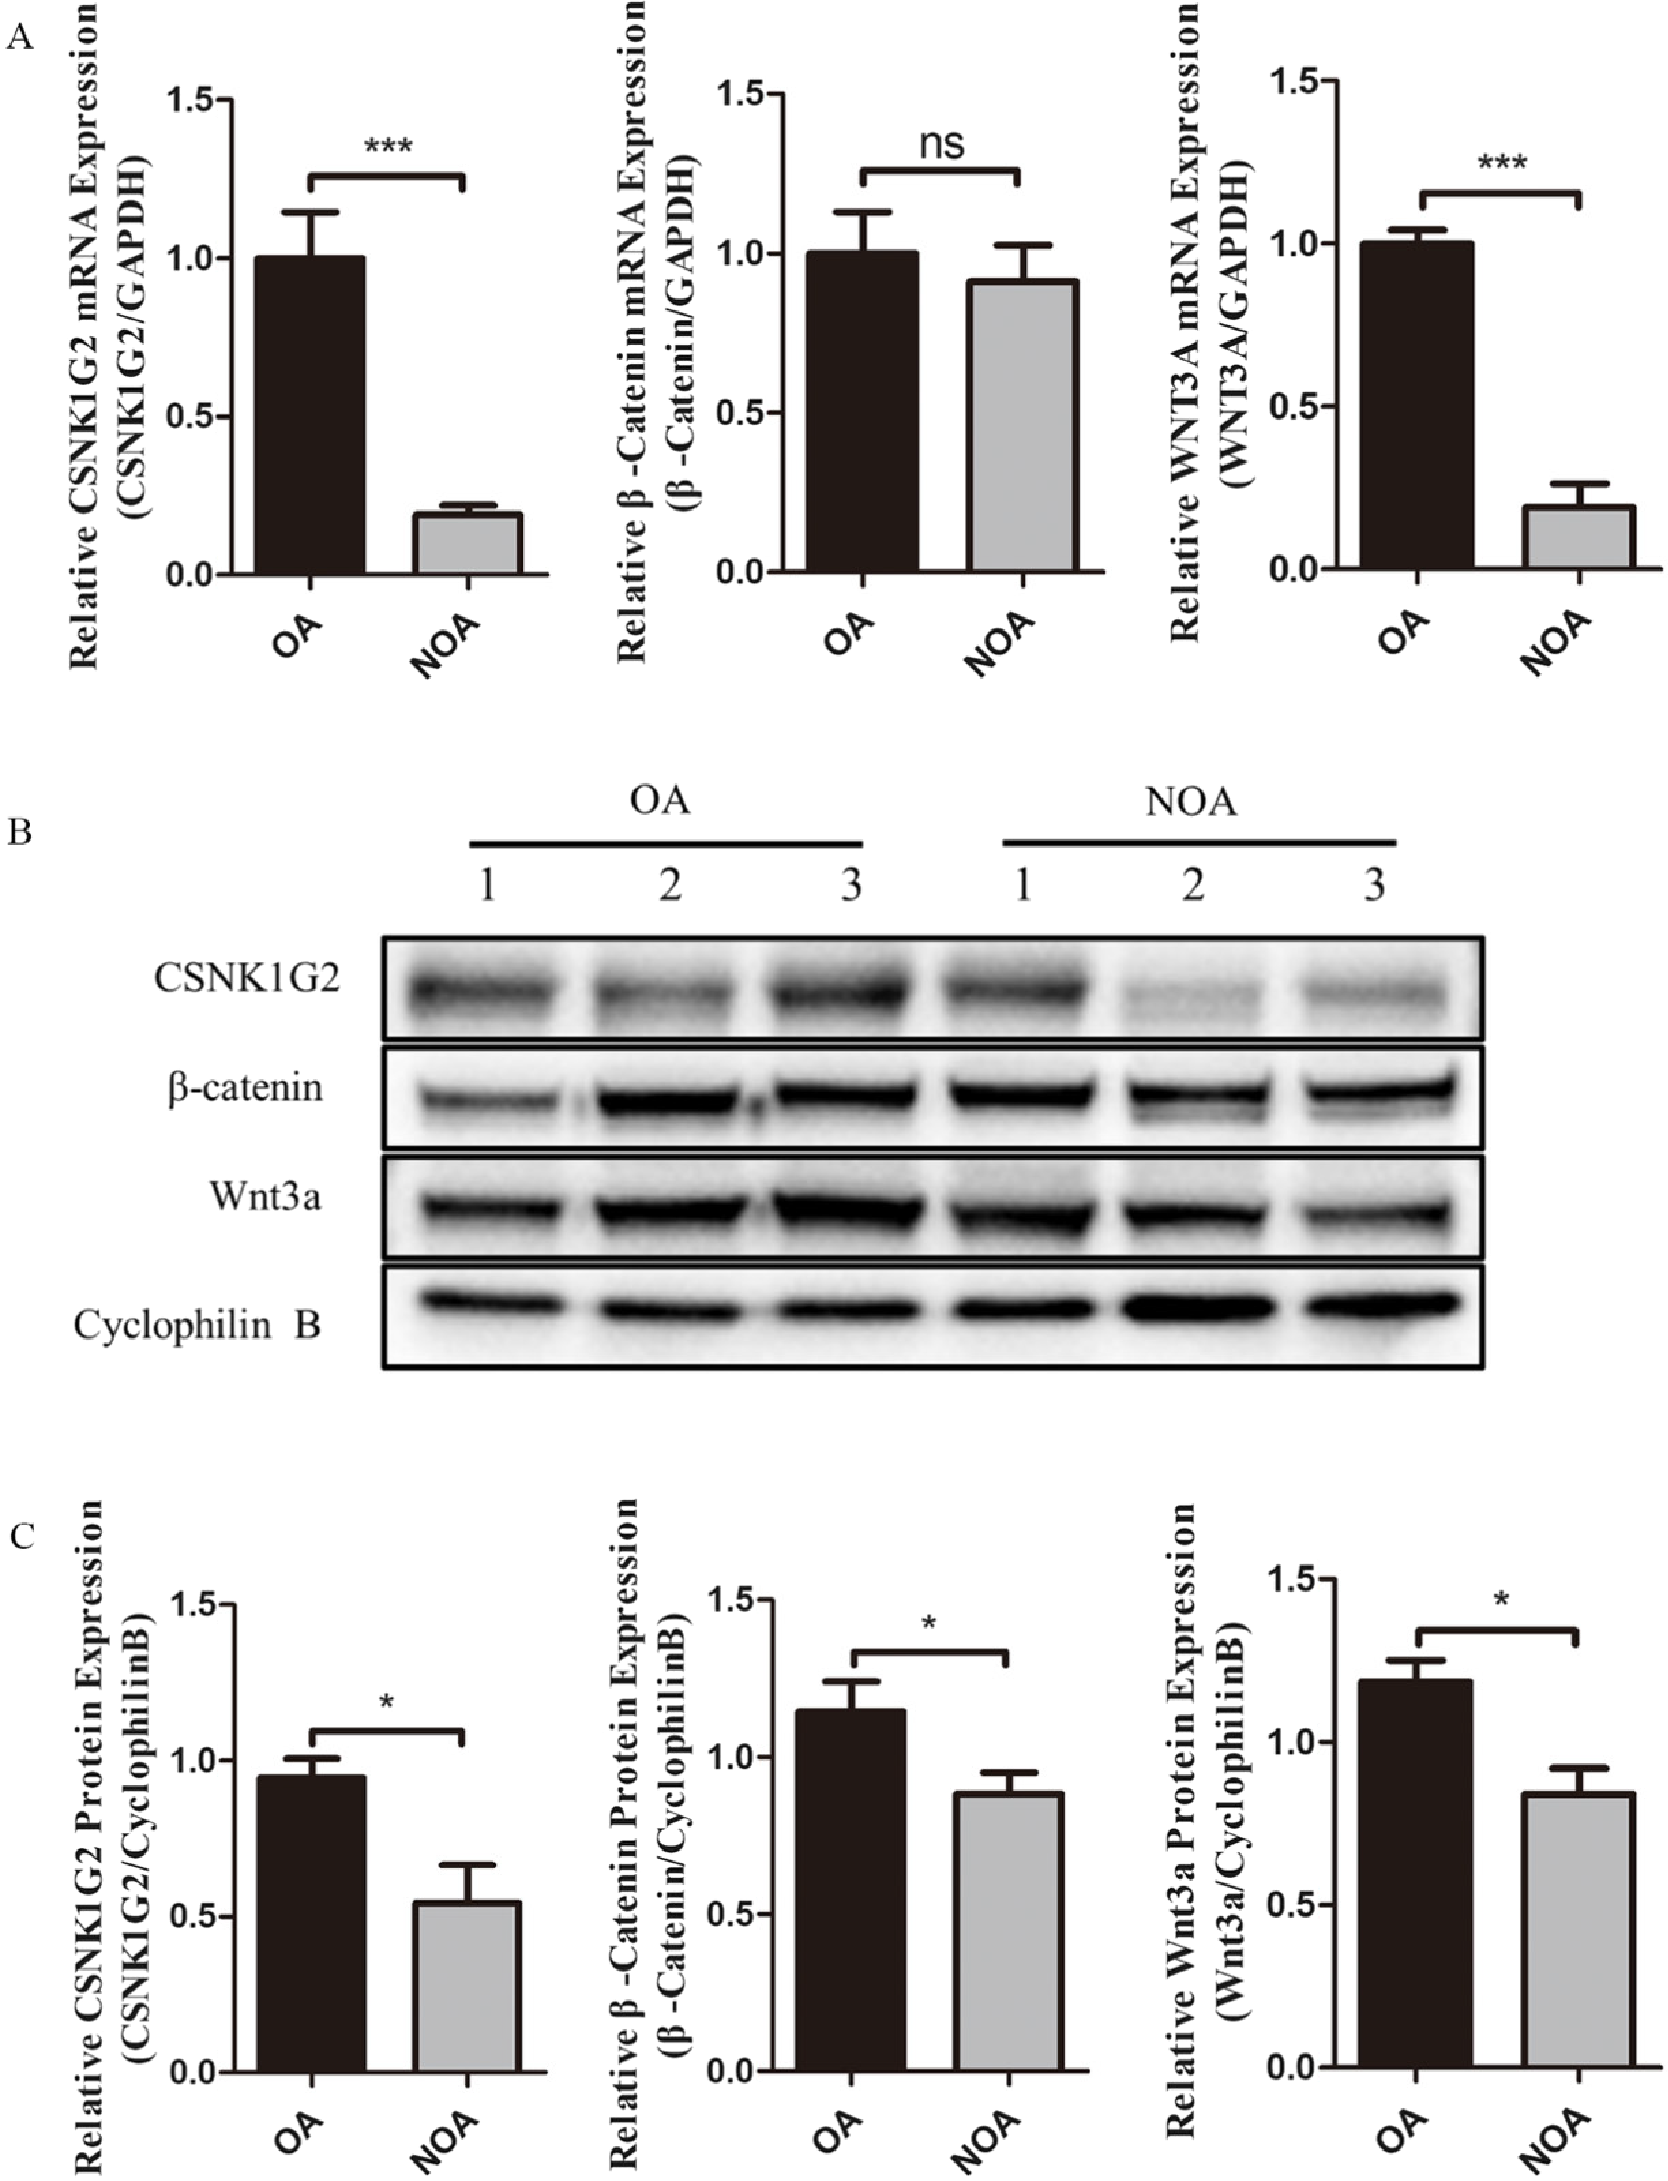
In the present study, CSNK1G2 and WNT3A mRNA levels were significantly downregulated in NOA tissue compared with OA tissues (relative expressions: 0.189 ± 0.081 and 0.190 ± 0.198, respectively; normalized by the OA expression level which was arbitrarily set as 1) (Figure 10A). However, there is no significant difference in the expression of β-Catenin mRNA between these two groups, relative to 0.911 ± 0.312in the NOA tissue. While decreased expression of β-Catenin mRNA was not significant, it followed a similar pattern to that seen when down-regulating both CSNK1G2 and WNT3A, supporting our hypothesis. At the protein level, WB analysis further confirmed that the relative expression levels of CSNK1G2, β-Catenin and Wnt3a were all decreased in NOA tissues compared with OA tissues, which was consistent with our qPCR results (Figure 10B,C). The above results indicated that there might be some involvement of CSNK1G2, Wnt3a and β-Catenin in the molecular mechanism involved with NOA.
Expression of CSNK1G2 and Wnt pathway genes in NOA testicular biopsy tissues. (A) Relative mRNA expression of CSNK1G2, WNT3A and β-Catenin in NOA. (B, C) Relative protein expression of CSNK1G2, Wnt3a and β-Catenin in NOA.

Discussion
The contribution of Wnt signalling pathway to NOA is still not well known when compared with other infertility problems. It has been reported that Wnt signalling pathways are involved in several biological functions, including cell proliferation, differentiation and apoptosis, which are critical in normal spermatogenesis (Nusse and Clevers, Reference Nusse and Clevers2017; Xue et al., Reference Xue, Lin, Sun, Watanabe, Xu, Araki, Nasu, Tang and Huang2021). Spermatogenesis is an elaborate and continuous differentiation process in which SSCs give rise to spermatozoa; during this process, a portion of the SSC pool differentiates while the remainder proliferates to maintain the stem cell population (Oatley and Brinster, Reference Oatley and Brinster2008). According to Golestaneh et al, the function of both Wnt3a and Wnt10b is to promote SSCs proliferation: e.g., overexpression of either Wnt3a or Wnt10b in C18-4 SSC cell line causes almost eight-fold increases of SSC number and Wnt3a is essential to maintain the undifferentiated status of SSCs (Golestaneh et al., Reference Golestaneh, Beauchamp, Fallen, Kokkinaki, Üren and Dym2009). Furthermore, WNT/β-Catenin signalling in the testes is involved only in the stimulation of SSCs and progenitor cell proliferation (Takase and Nusse, Reference Takase and Nusse2016). Nevertheless, the specific pathological impacts of Wnt signalling in NOA have not yet been characterized, and the molecular mechanisms via which these pathways contribute to NOA pathogenesis remain unclear. In this study, we integrated bioinformatics and experimental validation to identify CSNK1G2 as a key Wnt-related hub gene downregulated in NOA, and verified its association with immune infiltration, spermatogenic pathway impairment and potential therapeutic value. These findings provide evidence that CSNK1G2 deficiency may drive NOA via disrupting Wnt signalling, ciliary function and RNA metabolism, offering a novel diagnostic marker and therapeutic target. It is important to note that previous single-cell multi-omics study demonstrated functional Wnt signaling dysfunction in spermatogonia from NOA patients, with three transcription factors (CTCF, AR and ARNTL) implicated in this dysregulation (Zeng et al., Reference Zeng, Chen, Liu, Tang, Wu and Liu2023). The present study extends these findings by identifying CSNK1G2 as a specific downstream effector whose downregulation is consistent with the Wnt signaling impairment we previously reported, thereby providing a molecular link between the observed pathway dysfunction and a candidate diagnostic marker.
WGCNA identified the black module as the most negatively correlated with NOA, which was significantly enriched in spermatogenesis, sperm flagellum assembly and ciliary movement—processes directly defective in NOA patients. KEGG analysis also linked this module to neurodegenerative pathways and amino acid metabolism, suggesting shared stress responses between gametogenesis and cellular homeostasis. The PPI network further highlighted genes governing sperm flagellar structure and motility, confirming that spermatogenic structural and functional impairment is a core feature of NOA. Our intersection analysis narrowed these changes to four Wnt-related genes, with CSNK1G2 standing out as the most robust diagnostic marker by LASSO and ROC (AUC > 0.9 in multiple datasets).
Casein kinase 1 gamma 2(CSNK1G2) belongs to the family of casein kinase 1 (CSNK1), that participates in the control of many cellular processes like immune response, inflammation, spindle and centrosome organization, DNA damage response, circadian rhythm and apoptosis (Cheong and Virshup, Reference Cheong and Virshup2011; Hu et al., Reference Hu, Xu, Pan and Ma2023; Knippschild et al., Reference Knippschild, Krüger, Richter, Xu, García-Reyes, Peifer, Halekotte, Bakulev and Bischof2014). Growing evidence points toward a role for the CSNK1s as essential regulators of pathways involved in growth and proliferation and apoptosis. CSNK1 member dysregulation or dysfunction is implicated in a variety of pathological processes such as disruption of the Hedgehog pathway, p53 pathways, Wnt signalling, tumorigenesis and development (Janovská et al., Reference Janovská, Normant, Miskin and Bryja2020; Knippschild et al., Reference Knippschild, Krüger, Richter, Xu, García-Reyes, Peifer, Halekotte, Bakulev and Bischof2014; Li et al., Reference Li, Zhou, Liu, Zhu, Liu, Bo and Fan2023; Lu et al., Reference Lu, Zhang, Zhang, Li, Qiu, Gou and Cui2022; Peer et al., Reference Szklarczyk, Gable, Nastou, Lyon, Kirsch, Pyysalo, Doncheva, Legeay, Fang, Bork, Jensen and von Mering2021; Young et al., Reference Young, Kerr, Micati, Nielsen, Rajpert-De Meyts, Abud and Loveland2020). Interestingly, CSNK1G2 resides at chromsome 19p13.3 and is ubiquitously expressed in the testes, suggesting that it may have relevance to male fertility and physiology (Kitabayashi et al., Reference Kitabayashi, Kusuda, Hirai and Hashimoto1997). Our study first reports CSNK1G2 downregulation in human NOA testes, consistent with its known role in maintaining testicular homeostasis and inhibiting necroptosis in mouse models (Golestaneh et al., Reference Golestaneh, Beauchamp, Fallen, Kokkinaki, Üren and Dym2009; Li et al., Reference Li, Ai, Guo, Dong, Li, Cai, Chen, Xu, Wang and Wang2020; Xue et al., Reference Xue, Lin, Sun, Watanabe, Xu, Araki, Nasu, Tang and Huang2021). GSEA revealed that high CSNK1G2 expression was associated with spermatogenesis, ciliary cargo transport, RNA nuclear export and selective autophagy—all essential for normal germ cell development. Mechanistically, we proposed CSNK1G2 downregulation impairs Wnt signaling activity, leading to reduced Wnt3a and β-catenin levels; this further disrupts ciliary function (sperm motility) and RNA processing, ultimately arresting spermatogenesis. The negative correlation between CSNK1G2 and immune scores also suggests its role in regulating testicular immune microenvironment, which is known to affect spermatogenesis.
The following experiments further verified our conclusions and found that the expression of CSNK1G2 was decreased in NOA patients, which is consistent with the above bioinformatic analysis result, demonstrating that CSNK1G2 might be used as a diagnostic biomarker for NOA. Since we found downregulated levels of CSNK1G2 in NOA, it is possible that this gene plays some pathological roles in NOA, probably due to their participation in key spermatogenic processes. Besides the CSNK1G2, we also observed down-regulated major Wnt signal transduction related protein expression from NOA samples in our experimental results, including β-Catenin and Wnt3a. Beta-catenin is an important downstream target of the Wnt signaling cascade and its downregulation suggests dysregulated Wnt mediated pathways required during normal spermatogenesis. Similarly, reduced levels of another Wnt pathway ligand Wnt3a also support our hypothesis about alteration in Wnt signaling in NOA. All these results together strengthen the hypothesis for disruption in Wnt signaling being an important contributor to the pathogenesis of NOA. Downregulation of CSNK1G2 and others Wnt pathway members suggest that perturbations in Wnt signaling can have more widespread effects upon spermatogenesis and sperm biology. Our further analysis revealed that CSNK1G2 expression progressively decreased with the severity of spermatogenic impairment across NOA subtypes, and CSNK1G2-high samples exhibited significant enrichment of spermatogenesis-related programmes. The strong positive correlations between CSNK1G2 and key spermatogenesis genes (SPATA20, PRM2, TNP1, DNAH1) further support the notion that CSNK1G2 may serve as a critical regulator of spermatogenic differentiation, potentially through modulation of Wnt signalling and meiotic cell cycle pathways. The negative correlation between CSNK1G2 and canonical Wnt pathway components (CTNNB1, APC, TCF7L2) suggests that CSNK1G2 may function through non-canonical Wnt signalling or act as a negative feedback regulator, which warrants further investigation.
We further constructed a miRNA-mRNA-TF regulatory network centred on CSNK1G2, identifying three core miRNAs (hsa-miR-103a-3p, hsa-miR-107, hsa-miR-378a-3p) and 84 transcription factors as potential upstream regulators. In addition, five small molecule compounds targeting CSNK1G2 were predicted as potential therapeutic candidates. These findings provide new clues for exploring the upstream regulatory mechanism of CSNK1G2 and developing targeted drugs for NOA. However, these predicted regulatory molecules and drugs require further in vitro and in vivo functional verification.
This study has several limitations. First, the sample size of clinical testicular tissues is relatively small, and multi-centre large-cohort validation is needed to confirm the diagnostic value of CSNK1G2. Second, NOA has high aetiological heterogeneity, and subgroup analysis based on aetiology was not performed. Third, while previous single-cell study established Wnt signalling dysfunction in NOA spermatogonia (Zeng et al., Reference Zeng, Chen, Liu, Tang, Wu and Liu2023) and published mouse models support the functional importance of CSNK1G2 in testicular homeostasis (Li et al., Reference Li, Ai, Guo, Dong, Li, Cai, Chen, Xu, Wang and Wang2020), the present study primarily relies on database comparisons and targeted experimental validation. Direct functional evidence linking CSNK1G2 to NOA pathogenesis—such as in vitro knockdown or overexpression experiments demonstrating effects on spermatogonial proliferation, differentiation, or Wnt pathway activity—is still lacking. Future studies employing CSNK1G2 gain-and loss-of-function approaches in relevant cellular and animal models will be essential to establish causal relationships and elucidate the precise molecular mechanisms. Additionally, mass spectrometry-based proteomic and post-translational modification analyses were not performed in this study due to the scarcity of human testicular biopsy samples and the preliminary validation orientation of this research. In future studies, we will apply quantitative mass spectrometry to explore the post-translational modifications, protein stability and interacting proteins of CSNK1G2, which will further reveal the molecular mechanism of CSNK1G2 in regulating Wnt signaling pathway and NOA pathogenesis.
In conclusion, our study demonstrates that dysfunctional Wnt signaling pathway, especially the downregulation of the key hub gene CSNK1G2, is closely associated with NOA pathogenesis. CSNK1G2 may regulate spermatogenesis by modulating Wnt signaling, ciliary function, RNA metabolism and the testicular immune microenvironment. CSNK1G2 acts as a novel and reliable diagnostic biomarker and potential therapeutic target for NOA. These findings advance our understanding of the molecular mechanism of NOA and provide a theoretical basis for the development of targeted intervention strategies for male infertility.
Supplementary material
The supplementary material for this article can be found at https://doi.org/10.1017/S0967199426100549.
Data availability statement
All data generated or analysed during this study are included in this published article and its supplementary information files.
Funding information
Guangxi Natural Science Foundation, 2023GXNSFBA026059.
Competing interests
All the authors declare no conflicts of interest.
Ethical standards
Our research has been approved by the Ethics Committee of Guangxi Zhuang Autonomous Region People’s Hospital.


 Open access

