Kochia is one of the most troublesome broadleaf weed species in irrigated and dryland crops as well as in non-croplands across the North American Great Plains (Eberlein and Fore Reference Eberlein and Fore1984; Friesen et al. Reference Friesen, Beckie, Warwick and Van Acker2009). Kochia was introduced to North America from Europe during the mid- to late 1800s and is now widespread throughout the Great Plains (Friesen et al. Reference Friesen, Beckie, Warwick and Van Acker2009). Kochia possesses several unique biological characteristics that allow it to invade and thrive under diverse climate and soil conditions (Friesen et al. Reference Friesen, Beckie, Warwick and Van Acker2009; Kocacinar and Sage Reference Kocacinar and Sage2003). Kochia has very early seedling emergence (Schwinghamer and Van Acker Reference Schwinghamer and Van Acker2008), rapid growth, and prolific seed production potential (Friesen et al. Reference Friesen, Beckie, Warwick and Van Acker2009; Kumar and Jha Reference Kumar and Jha2015b, Reference Kumar and Jha2015c). Furthermore, kochia utilizes a tumbling mechanism of seed dispersal, that is, a mature plant breaks off at the soil surface and tumbles across the landscape with prevailing winds (Baker et al. Reference Baker, Beck, Bienkiewicz and Bjostad2008; Becker Reference Becker1978; Beckie et al. Reference Beckie, Blackshaw, Hall and Johnson2016). Because of high degree of outcrossing and pollen-mediated gene flow, kochia exhibits wide genetic diversity (Beckie et al. Reference Beckie, Blackshaw, Hall and Johnson2016; Mengistu and Messersmith Reference Mengistu and Messersmith2002).
Kochia seed has no to very little (<10%) innate dormancy and low persistence (rarely >2 yr) in the soil (Dille et al. Reference Dille, Stahlman, Du, Geier, Riffel, Currie, Wilson, Sbatella, Westra, Kniss, Moechnig and Cole2017; Schwinghamer and Van Acker Reference Schwinghamer and Van Acker2008; Zorner et al. Reference Zorner, Zimdahl and Schweizer1984). Among 45 summer annual weed species, kochia is often the first species to emerge in the spring in the arid to semi-arid regions of the Great Plains and has a relatively low thermal requirement for germination compared with other weed species common in this region (Dille et al. Reference Dille, Stahlman, Du, Geier, Riffel, Currie, Wilson, Sbatella, Westra, Kniss, Moechnig and Cole2017; Friesen et al. Reference Friesen, Beckie, Warwick and Van Acker2009). For instance, in Hays, KS, kochia begins to emerge as early as mid-February when snow is still on the ground (PWS, personal observation), indicating the cold tolerance of the seedlings. In addition, it can exhibit an extended period of emergence during the growing season (Dille et al. Reference Dille, Stahlman, Du, Geier, Riffel, Currie, Wilson, Sbatella, Westra, Kniss, Moechnig and Cole2017). In south-central Manitoba, Canada, Schwinghamer and Van Acker (Reference Schwinghamer and Van Acker2008) observed that kochia emergence began at 50 cumulative growing degree days (GDD) (T base 0C, soil temperature at 2.5-cm depth) and continued into late summer. Anderson and Nielsen (Reference Anderson and Nielsen1996) reported major kochia flushes emerging between April 25 and May 9 at a semi-arid site near Akron, CO. In northern states of the U.S. Great Plains, such as in northern Wyoming and Montana, kochia emergence was observed until July in sugar beet (Beta vulgaris L.) (Kumar and Jha Reference Kumar and Jha2015b; Weatherspoon and Schweitzer Reference Weatherspoon and Schweizer1969) and in late-planted dry edible beans (Phaseolus vulgaris L.) (PJ, personal observation). Anecdotal evidence suggests that fewer GDD are often needed to initiate kochia emergence in northern compared with southern states, indicating possible differences in critical temperature for emergence across populations. However, research to test whether this trend is evident across kochia populations collected from multiple sites, or whether kochia collected across a north–south transect will exhibit similar or different emergence patterns are lacking.
Recently, kochia control has become more complicated due to the evolution of multiple herbicide–resistant populations in the U.S. Great Plains (Heap Reference Heap2017). Glyphosate-resistant (GR) kochia populations were first confirmed in Kansas in 2007, with subsequent reports from nine other states in the U.S. Great Plains, including Montana, and three Canadian provinces (Heap Reference Heap2017). Kochia biotypes resistant to synthetic auxins (dicamba/fluroxypyr) also have been reported (Jha et al. Reference Jha, Kumar and Lim2015; Kumar and Jha Reference Kumar and Jha2016). Additionally, kochia populations with two-way resistance to glyphosate and acetolactate synthase (ALS) inhibitors (Kumar et al. Reference Kumar, Jha, Giacomini, Westra and Westra2015), and four-way resistance to glyphosate, ALS inhibitors, photosystem II inhibitors, and dicamba have been reported (Varanasi et al. Reference Varanasi, Godar, Currie, Dille, Thompson, Stahlman and Jugulam2015). This increasing prevalence of multiple herbicide–resistant (HR) kochia necessitates the development of integrated weed management tools that can best exploit kochia emergence patterns in production fields. Understanding the timing and dynamics of weed seedling emergence is crucial in implementing timely and effective weed control tactics (Buhler et al. Reference Buhler, Hartzler and Forcella1998; Dille et al. Reference Dille, Stahlman, Du, Geier, Riffel, Currie, Wilson, Sbatella, Westra, Kniss, Moechnig and Cole2017; Myers et al. Reference Myers, Curran, VanGessel, Calvin, Mortensen, Majek, Karsten and Roth2004). Information on weed emergence periodicity is quite useful in optimizing cultural practices (planting date, row spacing, cover crop) and herbicide application timings (Jha and Norsworthy Reference Jha and Norsworthy2009; Kumar and Jha Reference Kumar and Jha2015a, Reference Kumar and Jha2015b; Nazarko et al. Reference Nazarko, Van Acker and Entz2005).
To date, there is a limited information available in the literature on kochia emergence dynamics in the U.S. Great Plains region. This research will aid in developing models to predict the timing and pattern of kochia emergence in the field, which would allow growers to schedule appropriate weed control measures. The objectives of this research were to: (1) characterize the emergence pattern of kochia populations collected from multiple states across the U.S. Great Plains in a common garden study and (2) determine the emergence periodicity of these populations under field conditions.
Materials and Methods
Seed Source
During fall of 2012, fully matured seeds from kochia plants were collected from wheat (Triticum aestivum L.) or fallow fields from several locations in six U.S. Great Plains’ states, including North Dakota, Montana, Idaho, Kansas, Oklahoma, and New Mexico. The nine different kochia populations were designated as North Dakota (ND); Montana (MT); Idaho (ID); Kansas-Colby (KS-CB), Kansas-Manhattan (KS-MN), and Kansas-Garden City (KS-GC); Oklahoma (OK); New Mexico-Los Lunas (NM-LL) and New Mexico-Las Cruces (NM-LC). Branches with seeds from each location were placed into a paper bag and composited into a single sample (a population). Samples were cleaned using a 15-cm-diameter sieve with a 7-mesh screen to separate larger debris and chaff, and an air-propelled column blower was used to remove the small chaff and lighter seeds. Any remaining immature or damaged seed was manually removed. Two hundred seeds from each kochia population were counted and placed in coin envelopes (6.25-cm by 10.6-cm size) and stored at 4C until used in the field.
Field Experiments
Common garden experiments were conducted in 2013 and 2014 at the Montana State University Southern Agricultural Research Center (MSU-SARC) Research Farm near Huntley, MT. The soil type at the study site was Fort Collins clay loam (fine-loamy, mixed, superactive, mesic Aridic Haplustalfs) with 2.8% organic matter and a pH of 8.1. The study site had been under forage grass production for a minimum of 5 yr before the initiation of the study, with no previous history of kochia infestation. During July 2012, the study site was sprayed with a 3% solution of glyphosate, and in September, the site was rototilled to a depth of 20 cm. Before the field experiments were established in September 2012, the study site was rototilled again to smooth the soil surface and facilitate installation of the experimental units. Similarly, the study for 2014 was established in September of 2013 in an adjacent field site.
Experiments were also conducted in 2013 at two locations in Kansas, including the Kansas State University (KSU) Agricultural Research Center at Hays, KS, and the KSU Department of Agronomy Ashland Bottoms Research Farm near Manhattan, KS. The soil type at Hays was a Roxbury silt loam (fine-silty, mixed, superactive, mesic Cumulic Haplustolls), while at Manhattan it was a Wymore silty clay loam (fine, smectitic, mesic Aquertic Argiudolls). The study site at Hays was in wheat stubble that was sprayed clean with glyphosate in 2012, while the Manhattan site was in a tilled weed-free field following winter wheat harvest in 2012. Both sites had no kochia seedbank from previous years.
A randomized complete block design was used with five replications at MT and six replications at both sites in KS. The experimental units in MT were set up on September 25, 2012, and September 30, 2013. Each experimental unit was composed of a polyvinylchloride (PVC) cylinder (30-cm diameter, 12.5-cm tall), with openings at both ends, and was pushed into the tilled soil 10-cm deep. An approximately 2.5-cm lip of the cylinder was left above the soil surface to prevent off-site movement of the seeds. Seeds (200 ring−1) were spread on the soil surface within each experimental unit on March 1, 2013, and March 5, 2014, at the onset of snowmelt in the field at MT. In KS, PVC rings (20.3-cm diameter, 5-cm tall) were placed upon the soil surface and pinned with landscape staples, and seeds (200 ring−1) were spread on the soil surface on December 19, 2012, at both the Manhattan and Hays sites. Any undesirable grass or broadleaf weeds were removed by hand from the study sites as needed.
Data Collection
In MT, newly emerged kochia seedlings were counted and removed by hand twice a week starting March 2 through August 15, 2013, and March 6 through August 15, 2014. At both sites in KS, newly emerged kochia seedlings were counted and removed weekly starting February 15, 2013, through June 1, 2013. The end date at each site was chosen based on no further emergence over a 15-d period.
Daily minimum and maximum air temperatures and precipitation for each growing season in Montana were obtained from the nearest weather station located in Huntley, MT (Huntley Experiment Station; site ID: 244345; 45.55°N, 108.15°W), approximately 500-m north of the experimental site. Daily minimum and maximum air temperatures and precipitation in Kansas were obtained from a weather station located at the KSU-ARC at Hays (NWS SHEF ID: HASK1; 38.8495°N, 99.3446°W) and from the weather station located on the KSU Department of Agronomy North Research Farm at Manhattan (NWS SHEF ID: MTNK1, 39.2086°N, 96.5917°W). Because kochia is a small-seeded weed species, it emerges from the upper 0- to 2-cm soil depth (Schwinghamer and Van Acker Reference Schwinghamer and Van Acker2008), and daily temperatures at or near the soil surface may therefore be more important in regulating seedling emergence than temperatures at deeper soil depths. As there is a strong association between soil temperature at shallow depths and air temperatures (Islam et al. Reference Islam, Khan and Islam2015), the daily minimum and maximum air temperature data were used for calculating cumulative GDD using the following equations (McMaster and Wilhelm. Reference McMaster and Wilhelm1997):
 $${\rm {GDD_{daily}}\, {\equals}\, }\left[ {{{T_\min {\plus}T_\max } \over 2}} \right]{\minus}T_{{{\rm base}}} $$
 $${\rm GDD\, {\equals}\, }\mathop{\sum}\limits_{i{\equals}1}^n {{\rm GDD_{daily}}} $$
where GDDdaily is the daily GDD (Cd), T min is the daily minimum air temperature (C), T max is the daily maximum air temperature (C), T base is the base temperature (0C), and n is the number of days for which the emergence counts were recorded in each site-year. A base temperature (T base) of 0C was selected for calculating the GDDdaily based on previous studies on kochia germination and emergence in the Great Plains region (Dille et al. Reference Dille, Stahlman, Du, Geier, Riffel, Currie, Wilson, Sbatella, Westra, Kniss, Moechnig and Cole2017; Evetts and Burnside Reference Evetts and Burnside1972; Schwinghamer and Van Acker Reference Schwinghamer and Van Acker2008).
Statistical Analyses
The percent cumulative emergence for each kochia population was computed as the sum of emergence on a sample date and all previous sample dates expressed as a percentage of total emergence. Data on percent cumulative emergence were subjected to ANOVA using PROC MIXED in SAS (SAS v. 9.3, SAS Institute, Cary, NC). Before analysis, data were tested for normality of residuals using the PROC UNIVARIATE procedure. The percent cumulative emergence data were regressed against GDD with a three-parameter log-logistic model using the ‘drc’ package in R program (Knezevic et al. Reference Knezevic, Streibig and Ritz2007; Ritz and Streibig Reference Ritz and Streibig2005; Seefeldt et al. Reference Seefeldt, Jensen and Fuerst1995):
 $$Y\, {\equals}\, \left\{ {100\1/\!1{\plus}\exp \left[ {b\,\left( {\log \,x{\minus}\log \,{\rm E}_{{50}} } \right)} \right]} \right\}$$
where Y is the percent cumulative kochia emergence; x is the GDD (Cd); the maximum percent cumulative emergence (parameter d in the model) was fixed at “100” for all populations, because percent cumulative emergence was based on the total emergence; E50 is the x value (GDD) to reach 50% cumulative emergence (C); and b denotes the slope at the inflection point “E50.” The slope parameter (b) indicates the emergence rate of each kochia population over GDD (i.e., a slope with a high negative value indicated a rapid emergence of that kochia population). Parameter estimates, standard errors, and E50 values of each population were determined. The GDD required for seedling emergence initiation (10% emergence), end (90% emergence), and duration (GDDs for 10% to 90% emergence, i.e., E90 –E10) for each population were determined with 95% confidence intervals. The model selection was based on Akaike’s information criterion (Ritz and Spiess Reference Ritz and Spiess2008). A lack-of-fit test (P>0.05) further indicated that the nonlinear regression model (Equation 3) acceptably described the percent cumulative emergence data for each kochia population (Ritz and Streibig Reference Ritz and Streibig2005). Regression parameter estimates were compared based on the approximate t test using the CompParm command in R.
The seedling count data from Montana (number per ring) at each sampled date were further used to calculate the daily emergence for each kochia population, which was calculated by dividing the emergence counts on a sample date with the number of days between counts. Following a previously used quality-control approach (Montgomery et al. Reference Montgomery, Runger and Hubele2001; Norsworthy and Oliveira Reference Norsworthy and Oliveira2007), the peak emergence periods of each kochia population were determined. The peak emergence for any kochia population was considered to occur when the daily emergence was greater than the total emergence in a season divided by the number of days between the first and the last day of emergence (daily emergence rate) plus the standard deviation of the daily emergence.
Results and Discussion
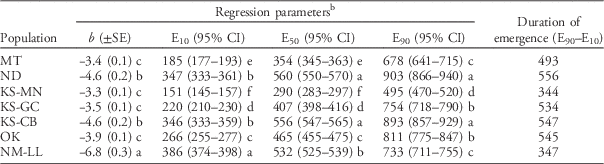
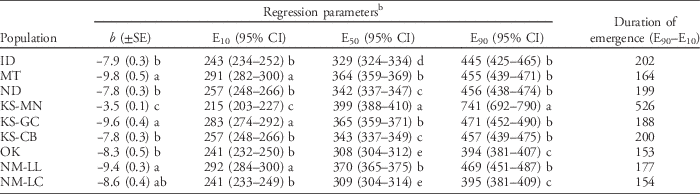
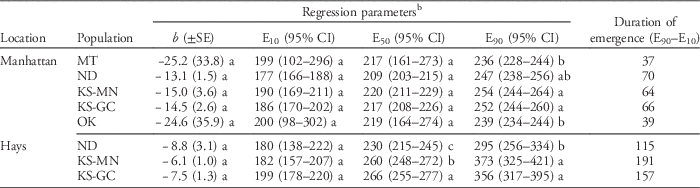
Data on seedling emergence for all kochia populations are presented by year and location to account for differences in environmental conditions between 2013 and 2014 growing seasons in Montana and between the two sites in Kansas (Tables 1–3). Seedling emergence of most kochia populations collected from the Great Plains states occurred from early April through late June in Montana in 2013 (Table 1). In 2014 in Montana, seedlings emerged from all nine kochia populations beginning in the middle of April through middle of July (Table 2). At the two locations in Kansas in 2013, seedlings emerged from late February through early June. Overall, in the three common garden locations in 2013, the kochia seed population from ID had no seedling emergence. When fewer than 10 total seedlings emerged from a ring in a given replication, that experimental unit was removed from further analysis (<5% successful emergence), and when fewer than three replications for a population remained, that population was not included in the analysis. Thus, only five populations in the Manhattan experiment and three populations in the Hays experiment were used for further analysis (Table 3).
Regression parameters estimated from the log-logistic model (Equation 1) for cumulative percent emergence of kochia populations in the field at Huntley, MT, in 2013.Footnote a

a Abbreviations: b, slope at inflection point of each curve; CI, confidence interval; E10, E50, and E90, cumulative GDD required for 10%, 50%, and 90% kochia emergence for each population, respectively; kochia populations from MT, Montana; ND, North Dakota; KS-MN, Manhattan, Kansas; KS-GC, Garden City, Kansas; KS-CB, Colby, Kansas; OK, Oklahoma; NM-LL, Los Lunas, New Mexico.
b Regression parameter estimates followed by the same letter are not different (P<0.05).
Regression parameters estimated from the log-logistic model (Equation 1) for cumulative percent emergence of kochia populations in the field at Huntley, MT, in 2014.Footnote a

a Abbreviations: b, slope at inflection point of each curve; CI, confidence interval; E10, E50, and E90, cumulative GDD required for 10%, 50%, and 90% kochia emergence for each population, respectively; kochia populations from: ID, Idaho; MT, Montana; ND, North Dakota; KS-MN, Manhattan, Kansas; KS-GC, Garden City, Kansas; KS-CB, Colby, Kansas; OK, Oklahoma; NM-LL, Los Lunas, New Mexico; NM-LC, Las Cruces, New Mexico.
b Regression parameter estimates followed by the same letter are not different (P<0.05).
Regression parameters estimated from the log-logistic model (Equation 1) for cumulative percent emergence of kochia populations at Manhattan and Hays, KS, in 2013.Footnote a

a Abbreviations: b, slope of inflection point of each curve; CI, confidence interval; E10, E50, and E90, cumulative GDD required for 10%, 50%, and 90% kochia emergence for each population, respectively; kochia populations from MT, Montana; ND, North Dakota; KS-MN, Manhattan, Kansas; KS-GC, Garden City, Kansas; OK, Oklahoma.
b Regression parameter estimates followed by the same letter are not different (P<0.05).
Kochia Emergence Pattern
The relationship between cumulative percent emergence and GDD for each kochia population was well described using Equation 1. The regression parameter estimates for each population are presented for Huntley, MT, for 2013 (Table 1) and 2014 (Table 2), and for the two locations in Kansas for 2013 (Table 3). The fitted model provided other biological parameters, such as rate of emergence (parameter b) and the cumulative GDD required to reach 10%, 50%, and 90% cumulative emergence for each population.
In Montana during the 2013 growing season, MT, KS-GC, KS-MN, and OK populations took 151 to 266 GDD to initiate 10% emergence (Table 1). The E10 values for ND and KS-CB populations were 347 and 346 GDD, respectively. Although the NM-LL population began to emerge later (386 GDD) than the other populations, it exhibited a rapid emergence rate, as indicated by the greater negative value of parameter b (−6.8), followed by the ND and KS-CB populations (b=−4.6). Kochia populations from ND and KS-CB took more GDD to achieve 50% (558 GDD) and 90% cumulative emergence (898 GDD) among the tested populations, implying that these two populations had a prolonged emergence period (E90–E10 of 556 and 547 GDD, respectively) at Huntley, MT in 2013. The early-emerging KS-MN population also took the least cumulative GDDs to achieve 50% (290 GDD) and 90% cumulative emergence (495 GDD), indicating a shorter duration of emergence (E90–E10 of 344 GDD) during the season. This further emphasizes the need for early-season kochia control, as suggested by Schwinghamer and Van Acker (Reference Schwinghamer and Van Acker2008), because any delay might result in emerged kochia plants before implementation of a weed control tactic. The other kochia populations took 678 to 811 GDD to achieve 90% cumulative emergence in 2013 at Huntley, MT (Table 1).
In 2014 at Montana and consistent with 2013, the KS-MN kochia population was the first to emerge and took only 215 GDD to achieve 10% cumulative emergence among the nine populations. This was followed by the ID, ND, KS-CB, OK, and NM-LC populations, which achieved 10% emergence between 241 and 257 GDD (Table 2). The last populations to reach 10% emergence were MT, KS-GC, and NM-LL with 283 to 292 GDD needed in 2014; however, NM-LL took fewer GDD to begin emergence in 2014 compared with 2013.
In 2013 at the two locations in Kansas, the emergence patterns were very similar, with no differences observed among populations for the rate of emergence (parameter b) or for the GDD to initiation of emergence (E10) (Table 3). At each location in Kansas, the duration of emergence (E90–E10) was also very similar and reflects the length of time that these populations were observed at each location and the ability to model the response. At Hays, GDD for E50 and for E90 were least for ND, followed by KS-MN and KS-GC, indicating that seed from the more northern location emerged more quickly and finished emerging earlier compared with local populations (Table 3).
In a field study conducted in Manitoba, Canada, kochia began to emerge at 50 GDD when calculated using soil temperatures at the 2.5-cm depth (Schwinghamer and Van Acker Reference Schwinghamer and Van Acker2008), which was less than that observed in our study with nine populations collected from the U.S. Great Plains. Our common garden results were similar to a recently published regional study of kochia emergence across the Great Plains, where kochia populations in Kansas began to emerge at Hays, KS, in 2010 with only 23 GDD (E10) and ranged up to 279 GDD at Garden City, KS, in 2011, when using air temperatures for calculating GDD (Dille et al. Reference Dille, Stahlman, Du, Geier, Riffel, Currie, Wilson, Sbatella, Westra, Kniss, Moechnig and Cole2017). Other kochia populations in Wyoming and Nebraska needed between 86 and 96 GDD for initiation of kochia emergence (E10) (Dille et al. Reference Dille, Stahlman, Du, Geier, Riffel, Currie, Wilson, Sbatella, Westra, Kniss, Moechnig and Cole2017). When comparing these common garden and field studies, the source of the kochia seed does not appear to matter; favorable environmental conditions play a more crucial role in germination and emergence than seed source.
The rate of emergence (parameter b) for the common garden study in Montana showed that the late-emerging populations in 2013, especially KS-GC, MT, and NM-LL, exhibited a rapid emergence rate, as indicated by the greater negative values of parameter b compared with most other populations (Table 1). In contrast with 2013, the early-emerging KS-MN population in 2014 took longer to achieve 50% (399 GDD) and 90% cumulative emergence (741 GDD) among all populations, indicating that this population had the longest duration of emergence (E90–E10=526 GDD) (Table 2). To achieve 90% cumulative emergence for the late-emerging populations from KS-GC, MT, and NM-LL, 455 to 471 GDD were needed and not much different from the number of GDD needed for ND, KS-CB, and ID populations (Table 2). In 2014 the two populations from OK and NM-LC had the shortest duration of emergence and took relatively less cumulative GDD to achieve 50% (308) and 90% (394) cumulative emergence. There was no consistent north–south influence of seed source, so the differential emergence timing and pattern among kochia populations were most likely because the seed were collected from geographically separated fields and might not have been exposed to similar agronomic selection. For many other weed species, differences in emergence patterns of giant ragweed (Ambrosia trifida L.) (Davis et al. Reference Davis, Clay, Cardina, Dille, Forcella, Lindquist and Sprague2013) and common sunflower (Helianthus annuus L.) (Clay et al. Reference Clay, Davis, Dille, Lindquist, Ramirez, Sprague, Reicks and Forcella2014) populations collected from geographically distant fields across the midwestern United Sates have been previously reported.
With the exception of the KS-MN population, the duration of emergence (E90–E10) of kochia populations in 2014 ranged from 153 to 202 GDD, and this was less than that determined for 2013 (347 to 556 GDD) in the common garden study in Montana. The optimal germination and emergence temperatures were reached more rapidly in 2014 compared with the 2013 growing season in Montana. In another study, the T base for kochia germination was determined to be 3.5C and optimum germination temperature was 24C (Al-Ahmadi and Kafi Reference Al-Ahmadi and Kafi2007), while 0C was used as the T base for this study (Dille et al. Reference Dille, Stahlman, Du, Geier, Riffel, Currie, Wilson, Sbatella, Westra, Kniss, Moechnig and Cole2017; Schwinghamer and Van Acker Reference Schwinghamer and Van Acker2008). There was a more rapid accumulation of heat units during the peak emergence period in 2014, with daily mean air temperatures ranging from 15 to 22 C. In contrast, daily mean air temperatures ranged from 6 to 15C during the peak emergence periods in 2013.
Kochia Emergence Peaks
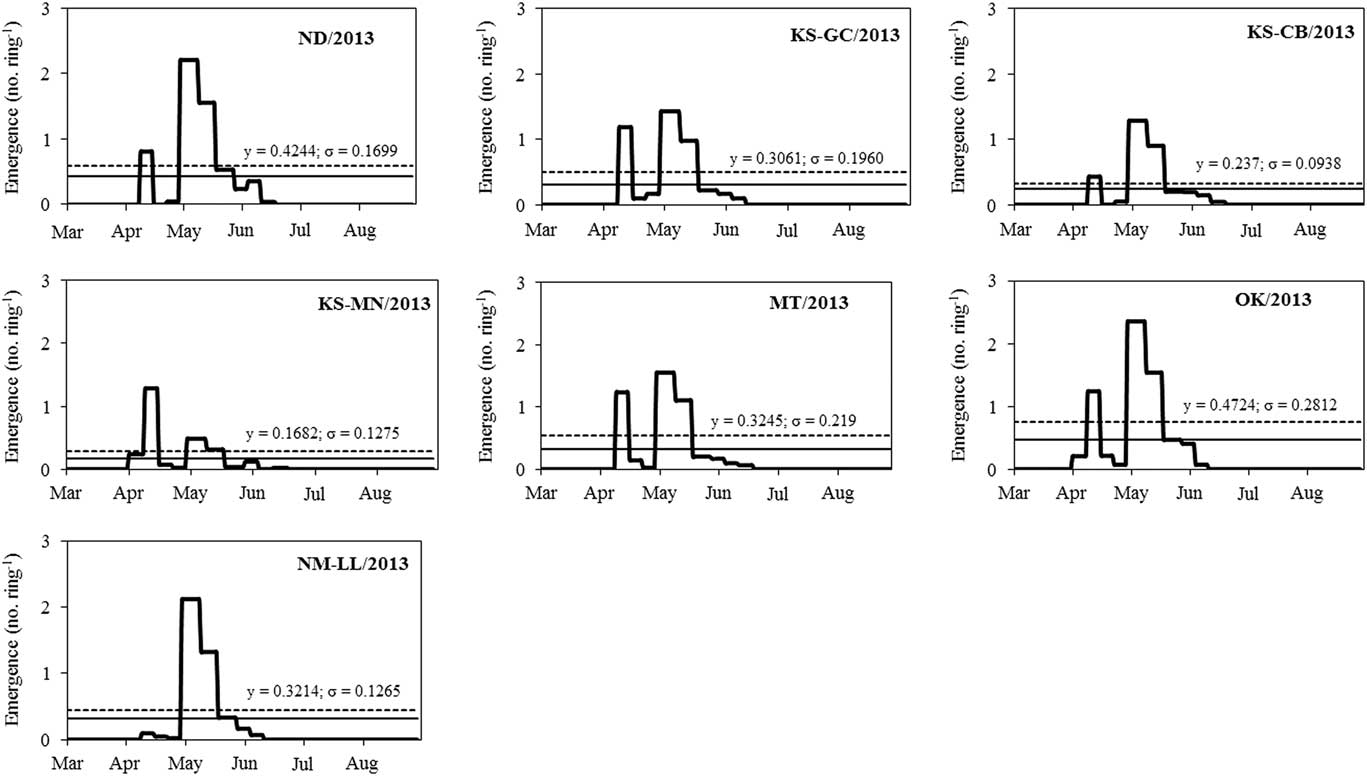
In 2013 emergence of seven kochia populations occurred from April 1 through June 25 in Huntley, MT, with two to three distinct emergence peaks observed between April 9 and May 20 (Figure 1). This supports the fact that kochia is an early-emerging summer annual weed and exhibits an extended period of emergence during the growing season (Mulugeta Reference Mulugeta1991; Schwinghamer and Van Acker Reference Schwinghamer and Van Acker2008). Six of the kochia populations, that is, those from KS-MN, KS-GC, KS-CB, OK, MT, and ND, had three emergence peaks, while the population from NM-LL had only two peak periods of emergence (Figure 1). The peak periods of emergence of kochia populations in Montana coincided with precipitation events at the study site. From April 1 through May 20 in 2013, there were six rainfall events >10 mm, with a total rainfall of 184 mm during that period.
Daily emergence of kochia populations in the field at Huntley, MT in 2013. The horizontal solid line within each graph represents the daily mean emergence for a particular population (y); the dashed line represents the mean plus the standard deviation (σ) of a population. Kochia populations are designated as ND, North Dakota; MT, Montana; KS-CB, Colby, KS; KS-MN, Manhattan, KS; KS-GC, Garden City, KS; OK, Oklahoma; NM-LL, Los Lunas, NM.

In 2014 a majority of the kochia seedbank from all nine populations emerged between April 17 and July 11 (Figure 2). In contrast to 2013, the NM-LL population had four emergence peaks, ND and KS-CB had two emergence peaks, and the other six populations had three distinct emergence peaks, all occurring between May 3 and May 31 in 2014. Occurrence of these major emergence flushes may indicate that subpopulations exist within a single weed population (Schutte et al. Reference Schutte, Regnier, Harrison, Schmoll, Spokas and Forcella2008). In 2014, out of a total rainfall of 162 mm from April 1 through July 7, almost 101 mm of rainfall occurred between April 20 through May 30, resulting in major emergence flushes (peaks) of kochia populations during that period
Daily emergence of kochia populations in the field at Huntley, MT in 2014. The horizontal solid line within each graph represents the daily mean emergence for a particular population (y); the dashed line represents the mean plus the standard deviation (σ) of a population. Kochia populations are designated as ND, North Dakota; MT, Montana; ID, Idaho; KS-CB, Colby, KS; KS-MN, Manhattan, KS; KS-GC, Garden City, KS; OK, Oklahoma; NM-LL, Los Lunas, NM; and NM-LC, Las Cruces, NM.
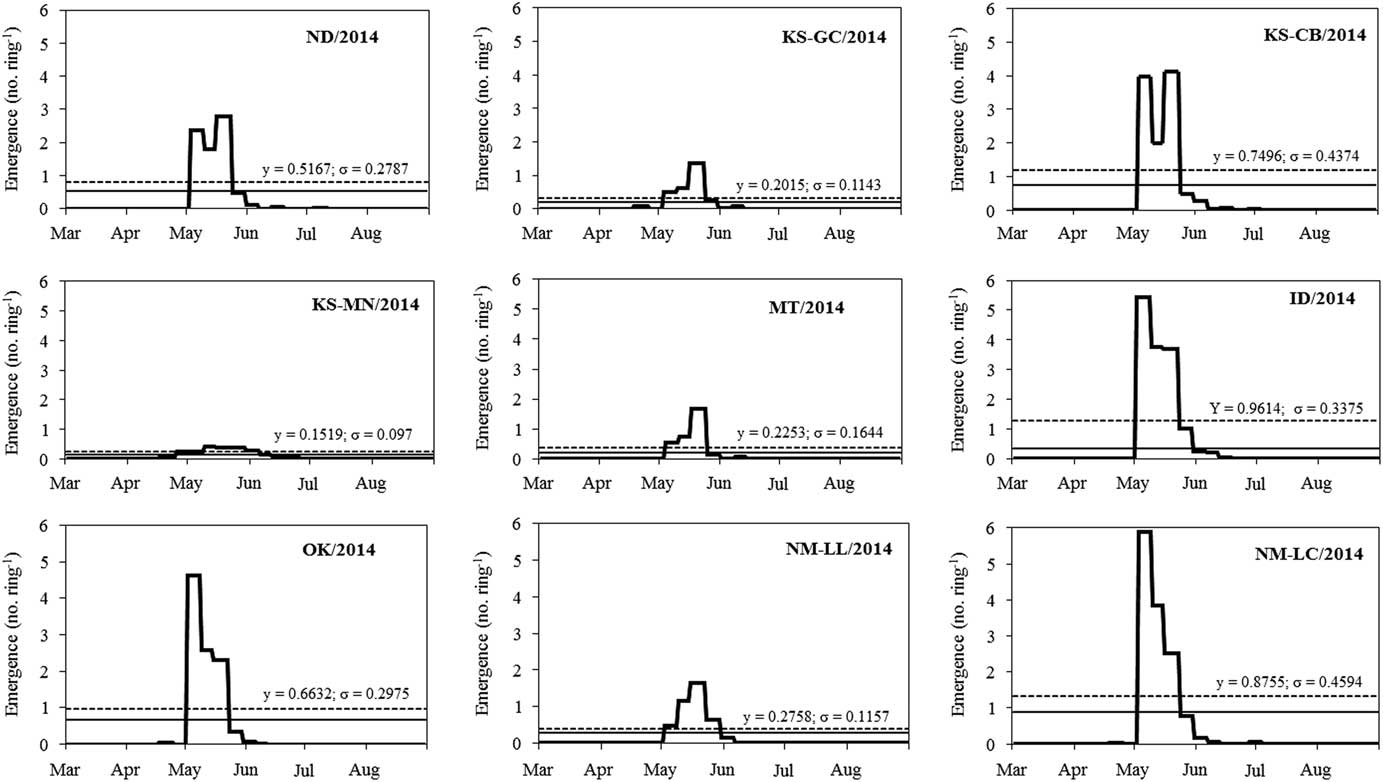
The daily mean soil temperature at a 2.5-cm soil depth at the onset of emergence of kochia populations was between 5 and 10C in both years, which occurred during the first 2 wk of April in Montana. Furthermore, the daily mean soil temperature at a 2.5-cm soil depth during the peak emergence periods in 2013 (April 9 to May 20) was between 3 and 24C, while it was between 6 and 26C during peak emergence periods (May 3 to May 31) in 2014. Previous researchers have observed kochia germination and emergence occurring over a wide range of temperatures from 3.5 to 40C (Al-Ahmadi and Kafi Reference Al-Ahmadi and Kafi2007; Dyer et al. Reference Dyer, Chee and Fay1993; Everitt et al. Reference Everitt, Alaniz and Lee1983; Kumar and Jha Reference Kumar and Jha2016; Nussbaum et al. Reference Nussbaum, Wiese, Crutchfield, Chenault and Lavake1985; Sbatella and Wilson Reference Sbatella and Wilson2010). Kochia populations from Texas began to emerge when daily minimum and maximum soil temperatures were 3 and 8C, respectively (Nussbaum et al. Reference Nussbaum, Wiese, Crutchfield, Chenault and Lavake1985). Similarly, kochia biotypes resistant to ALS inhibitors germinated at temperatures between 4.6 and 13.2C (Dyer et al. Reference Dyer, Chee and Fay1993; Hóla et al. Reference Holá, Kocova, Rothová, Chodová and Mikulka2004), although the populations used in our study were not tested for herbicide resistance. Another kochia population from Nebraska had greater than 80% germination at 5 d with temperatures greater than 20 C, and later germination resulted in the population avoiding control with earlier-applied isoxaflutole herbicide (Sbatella and Wilson Reference Sbatella and Wilson2010).
Kochia is well adapted to dry environments and tends to emerge rapidly in the early spring to exploit limited near-surface soil moisture. In a laboratory study, Everitt et al. (Reference Everitt, Alaniz and Lee1983) did not observe any reductions in kochia seed germination up to a moisture stress of −8 bars. However, the results from the common garden study in Montana indicate that besides conducive temperature conditions, the peak periods of kochia emergence were concomitant with increases in soil moisture following the major precipitation events.
Results from the common garden study in Montana highlight that most emergence of kochia occurred from April 9 through May 31 across 2013 and 2014. In northern states of the U.S. Great Plains, including Montana, North Dakota, and northern Wyoming, cereals such as spring wheat and barley (Hordeum vulgare L.) are planted from mid-March through the first week of April (depending on snowmelt), followed by sugar beet planting in mid-April. In this region, corn (Zea mays L.) and soybean [Glycine max (L.) Merr.] are planted during the first 2 wk of May, while dry edible beans (navy and great northern) (Phaseolus vulgaris L.) are planted between the end of May and first week of June. Based on the results from this field study, depending on conducive temperature and soil moisture conditions for kochia germination, the peak emergence period of kochia may overlap with the emergence of cereal crops in this region. Therefore, more emphasis is needed for in-crop kochia management in small grains by using highly competitive cereal cultivars in conjunction with selective PRE and POST herbicides.
Results from the common garden study in Kansas highlight that it does not matter where the kochia seed came from; they all initiated germination and emergence very early in the spring, by late February, as was also observed in a previous study conducted by Dille et al. (Reference Dille, Stahlman, Du, Geier, Riffel, Currie, Wilson, Sbatella, Westra, Kniss, Moechnig and Cole2017). In the Central Great Plains states such as Oklahoma, Kansas, Colorado, and Nebraska, winter wheat would be greening up, corn would begin to be planted in late March, with soybean following in early May, and grain sorghum [Sorghum bicolor (L.) Moench ssp. bicolor] in late May. Preplant control of kochia is critical to successfully establish the row crops in this region.
In contrast to established winter wheat and emerging spring cereals, two to four emergence flushes of kochia may occur before planting sugar beet, corn, soybean, dry edible bean, or grain sorghum. These emergence flushes provide greater opportunities to control kochia with nonselective burndown herbicides, early-spring PRE soil-residual herbicides, or tillage before crop planting in the Great Plains region.
Kochia emergence patterns across populations can be divided into three scenarios: early rapid emergence, delayed emergence but short duration, and gradual prolonged emergence. Changes in emergence patterns over time and across populations further suggest the adaptive characteristics of kochia and may suggest the impact of crop management factors on selection of different emergence “biotypes” (Owen et al. Reference Owen, Michael, Renton, Steadman and Powles2010a, Reference Owen, Michael, Renton, Steadman and Powles2010b; Sbatella and Wilson Reference Sbatella and Wilson2010; Schutte et al. Reference Schutte, Regnier, Harrison, Schmoll, Spokas and Forcella2008). There was a lack of consistency in emergence pattern of kochia populations across the north–south transect, further implying that in addition to differences in critical temperatures required for germination across seed populations, yearly or local differences in precipitation pattern and soil moisture availability in the spring/summer could possibly influence emergence profiles of these kochia seed populations (Dille et al. Reference Dille, Stahlman, Du, Geier, Riffel, Currie, Wilson, Sbatella, Westra, Kniss, Moechnig and Cole2017; Owen et al. Reference Owen, Michael, Renton, Steadman and Powles2010a).
Later-emerging kochia populations, such as those from KS-GC, MT, and NM-LL in one or both years of this study, are more likely to avoid burndown herbicide treatments, emerge after tillage passes for seedbed preparation, or emerge after early-spring killing frosts that are quite common in Montana and other adjacent states. This delayed emergence pattern can be a phenological adaptation to avoid preseeding weed control (Gundel et al. Reference Gundel, Martinez-Ghersa and Ghersa2008; Mortimer Reference Mortimer1997; Owen et al. Reference Owen, Michael, Renton, Steadman and Powles2010b; Sbatella and Wilson Reference Sbatella and Wilson2010). However, with the scenario of delayed emergence but short duration observed in a few kochia populations in this study, it is possible that management techniques such as preplant irrigation and stale seedbed will work well to stimulate emergence and deplete the kochia seedbank before planting soybean or dry beans in this region. Kochia is a small-seeded weed species with little to no innate dormancy, and seed burial at soil depths below 80 mm can cause fatal germination (Everitt et al. Reference Everitt, Alaniz and Lee1983; Schwinghamer and Van Acker Reference Schwinghamer and Van Acker2008). These biological attributes of kochia can make stale seedbed an effective tool to reduce the kochia seedbank. This method has been proven effective for controlling small-seeded weed species such as Palmer amaranth (Amaranthus palmeri S. Wats.) and common lambsquarters (Chenopodium album L.) (Baskin and Baskin 1998). A stale seedbed method of weed management is critical to protect against yield losses in crops that have limited herbicide options (Johnson and Mullinix Reference Johnson and Mullinix1995; Shaw Reference Shaw1996), which is the case for sugar beet growers in the western United States, who are facing the escalating spread of GR kochia. However, for the more gradual emergence pattern shown by some kochia populations (ND, KS-CB, and KS-MN), a stale seedbed approach may not work well, as it would not be economically feasible to delay the planting date to stimulate enough kochia seed to germinate and emerge. In such a scenario, a more intensive or season-long residual weed control program should be recommended. Further, diversified crop rotations like inclusion of perennial (alfalfa [Medicago sativa L.]), winter annual crops (winter wheat), or cover crops could be used effectively (Petrosino et al. Reference Petrosino, Dille, Holman and Roozeboom2015). A vigorous crop present in the spring would reduce competitiveness of the kochia emerging later, and the earlier harvest of these crops would allow additional tools for kochia control to prevent seed production late in the season.
Improved forecasting of kochia emergence patterns will aid in making proactive decisions for managing GR or multiple HR kochia seedbank, which is an increasing concern for producers in Montana and other states in the North American Great Plains (Heap Reference Heap2017). The information on peak emergence periods obtained from this study using the GDD model can be used to improve decisions on timing and method of kochia control. More importantly, the extended emergence period of kochia from early April through mid-July observed in this study suggests that a significant proportion of emerged seedlings can escape in-crop weed control and potentially set seed. Therefore, late-season herbicides or postharvest weed management strategies also need attention to control and prevent seed production from the late-emerging kochia cohorts (Kumar and Jha Reference Kumar and Jha2015c). This research on periodicity and pattern of emergence of diverse kochia populations will contribute to designing multitactic strategies to manage kochia seedbanks, especially when there are increasingly more HR populations of this weed in this region.
Acknowledgments
The authors greatly appreciate technical assistance in conducting the field studies on the part of the following staff in Montana: Charlemagne A. Lim, Aruna Varanasi, Anjani J., and Shane Leland; and the following staff in Kansas: Patrick W. Geier, and Emily Lingenfelter. We also thank the USDA National Institute of Food and Agriculture (Hatch Project MONB00658) and Montana Agricultural Experiment Station for funding this research.