

I. INTRODUCTION
The precipitation strengthened copper alloys such as Cu–Cr, Reference Xia, Jia, Zhang, Dong, Xu and Wang1,Reference Guo, Xiang, Yang, Cao, Mu and Tang2 Cu–Be, Reference Yagmur3,Reference Xie, Wang, Mi, Xiong and Peng4 and Cu–Ni Reference Hu, Chen, Liu, Liu and Wu5–Reference Monzen and Watanabe8 were widely used as lead frame or elastic materials in the electrical industry. The comprehensive properties of the alloys were significantly affected by the quench and aging process after solution treatment. Reference Suzuki, Shibutani, Mimura, Isshiki and Waseda9–Reference Nestorović, Marković and Marković12
The time–temperature–property (TTP) curves were usually established to exhibit the quench sensitivity of copper alloys. Reference Shiro and Koji13 It was found that high quench sensitivity was obtained when the alloy was quenched from the nose temperature. Reference Zhang, Liu, Liu and Zhou14,Reference Liu, Liu, Zhang, Zhang and Deng15 Hisashi and Motohiro Reference Hisashi and Motohiro16 studied the TTP curves and quench sensitivity of Cu–1.16% Cr alloy; their research results showed that the Cu–Cr alloy had high quench sensitivity at 600 °C (due to the heterogeneous effects) and 800 °C (due to the homogeneous precipitation). The microhardness and electrical conductivity of the alloy isothermally treated at nose temperatures were lower than that of other temperatures. Lei et al. Reference Lei, Li, Zhu, Qiu and Liang17 reported that the nose temperature of Cu–8.0Ni–1.8Si–0.6Sn–0.15Mg alloy was about 650 °C, and the alloy had a low microhardness at the nose temperature due to the discontinuous precipitation (DP). Therefore, the isothermal treatment at a low quench sensitivity region was required for some copper alloys, to obtain excellent comprehensive properties.
Recently, our group Reference Shen, Li, Zhang, Dong, Xiao, Lei and Qiu18 has designed the Cu–10Ni–3Al–0.8Si alloy with an ultrahigh strength of 1180 MPa and electrical conductivity of 18.1% IACS after solution treatment at 950 °C for 4 h, cold-rolled by 50% and aged at 450 °C for 8 h, then cold-rolled by 60% and aged at 450 °C for 8 h. It was also found that the isothermal and aging treatment could significantly influence the comprehensive properties of the alloy. Therefore, it was necessary to investigate the quench sensitivity of Cu–10Ni–3Al–0.8Si alloy and to establish the TTP curves, which have not been studied. In this paper, the TTP curves of Cu–10Ni–3Al–0.8Si alloy were studied. The influence of isothermal and aging treatment on the microstructure and properties of Cu–10Ni–3Al–0.8Si alloy was discussed.
II. EXPERIMENTAL PROCEDURE
The Cu–10Ni–3Al–0.8Si (wt%) alloy was melted in a medium frequency induction furnace using argon as a protection atmosphere. After the surface defects were removed, the cast ingot was hot rolled by 60% at 920 °C and water quenched to room temperature. The forged plate was then cold rolled by 50% and cut into small strips with a size of 15 mm × 15 mm × 2.5 mm. These strips were solution treated at 950 °C for 4 h, then immediately quenched into the resistance furnaces with different temperatures (at temperatures of 550, 600, 650, 700, and 750 °C, respectively) and isothermally treated for different times, followed by water quench (Procedure-1), at last, the samples were aged at 500 °C for 8 h in a salt-bath (Procedure-2).
The microhardness was measured using an HV-5 type Vickers hardness tester with a load of 2.5 kg and a holding time of 10 s. The relative electrical conductivity was measured by a D60 K digital metal electrical conductivity tester at 20 °C. The transmission electron microscopy (TEM), selected area diffraction pattern (SADP), and high resolution transmission electron microscopy (HRTEM) observations were conducted on a TECNAI G220. The samples for TEM and HRTEM observations were electro-polished by the standard twin-jet electro-polishing method. The etchant solution was a mixture of methanol and nitric acid with a volume ratio of 3:1. The electro-polishing was conducted at about −30 °C with the operation current of 75 mA.
III. RESULTS AND DISCUSSION
A. The effect of isothermal and aging treatment on properties
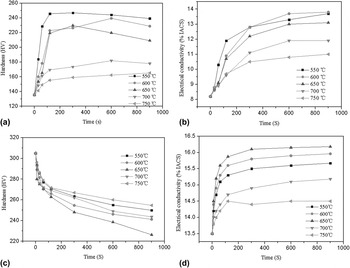
Figures 1(a) and 1(b) show the variation of microhardness and electrical conductivity of Cu–10Ni–3Al–0.8Si alloy after isothermal treatment at different temperatures (Procedure-1). Both the microhardness and electrical conductivity increased with the isothermal time and decreased with the increase of isothermal temperature. The variation of microhardness and electrical conductivity of the isothermally treated alloys after being aged at 500 °C for 8 h (Procedure-2) is shown in Figs. 1(c) and 1(d). After aging, the sample isothermally treated at 650 °C had the lowest microhardness and highest electrical conductivity at every isothermal treatment time than those treated at other temperatures.
Variation of microhardness and electrical conductivity. (a) Variation of microhardness with Procedure-1; (b) variation of electrical conductivity with Procedure-1; (c) variation of microhardness with Procedure-2; and (d) variation of electrical conductivity with Procedure-2.

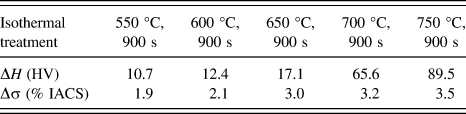
It was worthwhile to note that compared with the isothermally treated Cu–10Ni–3Al–0.8Si alloy, the microhardness and electrical conductivity of the alloy increased after isothermally treated and aged at 500 °C for 8 h, and the rise of microhardness and electrical conductivity also increased with the isothermally treated temperature (as shown in Table I), which indicated that the degree of super saturated solid solution increased with isothermal temperature.
Influence of aging on microhardness and electrical conductivity.

It was generally believed that solid solute elements (Ni, Al, and Si) have strong electron scattering effect and secondary phases show weak electron scattering effect. Therefore, precipitation of secondary phases from the supersaturated solid solution led to the decrease of the amount of solid solute elements and increase of electrical conductivity. Reference Blatt19,Reference Lei, Li, Xiao, Pang, Xiang, Qiu and Xiao20 When the alloy was isothermally treated at different temperatures for 900 s after solid solution treatment [Fig. 1(b)], the increment of electrical conductivity decreased with isothermal temperature, indicating that the amount of remained solute elements and the degree of supersaturated solid solution increased with isothermal temperature. As a result, the amount of precipitation increased with isothermal temperature after isothermal treatment and aging.
B. Evolution of microstructure during isothermal treatment and aging
1. Isothermal treatment at 550 °C
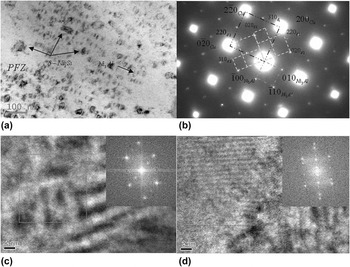
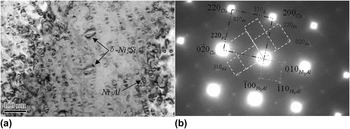
The microstructure and corresponding SADPs of Cu–10Ni–3Al–0.8Si alloy after solution treatment at 950 °C for 4 h and isothermal treatment at 550 °C for 30 s are shown in Fig. 2. Two kinds of nanoscale particles, one with zero-contrast line and the other without zero-contrast line, were found [Fig. 2(a)]. The corresponding SADP with the beam direction along [001]Cu is shown in Fig. 2(b). Two kinds of precipitates were identified: one was L12 ordered Ni3Al (FCC structure) with a lattice parameter of 0.358 nm and the other was DO22 ordered δ-Ni2Si (lattice parameter: a = 7.065 nm; b = 5.001 nm; and c = 3.731 nm). The HRTEM micrograph displayed in Figs. 2(c) and 2(d) showed that the particles with zero-contrast line were Ni3Al and those without zero-contrast line were δ-Ni2Si, respectively. The zero-contrast lines were perpendicular to g vector, indicating that Ni3Al was coherent with the matrix. Precipitation free zone (PFZ) was observed around the large δ-Ni2Si particles. When the alloy was isothermally treated at 550 °C, both Ni2Si and Ni3Al nucleated in the matrix and the Ni2Si coarsen faster than Ni3Al as isothermal time prolonged. The growth of Ni2Si resulted in the decrease of the amount of solute nickel atoms in the matrix around the Ni2Si particle, and the diffusion rate of solute elements was not fast enough at 550 °C. Therefore, the precipitation of Ni3Al around large Ni2Si particle was hindered, due to the lack of Ni atoms. The grain size of Ni3Al particles was about 20 nm and that of Ni2Si particles was about 50 nm [Fig. 2(a)]. The orientation relationships between the precipitates and matrix can be determined as
 ${[001]_{{\rm{Cu}}}}{\left\| {{{[001]}_{{\rm{N}}{{\rm{i}}_3}{\rm{Al}}}}\left\| {[001]} \right.} \right._\delta }$
,
 ${(110)_{{\rm{Cu}}}}{\left\| {{{(110)}_{{\rm{N}}{{\rm{i}}_3}{\rm{Al}}}}\left\| {(010)} \right.} \right._\delta }$
, and
 ${(1\bar 10)_{{\rm{Cu}}}}\left\| {{{(1\bar 10)}_{{\rm{N}}{{\rm{i}}_3}{\rm{Al}}}}} \right\|{(100)_\delta }$
.
Micrograph and SADPs of Cu–10Ni–3Al–0.8Si alloy isothermally treated at 550 °C for 30 s. (a) Bright field micrograph; (b) SADP of (a) with beam direction along [001]Cu; (c) HRTEM of Ni3Al; and (d) HRTEM of δ-Ni2Si.

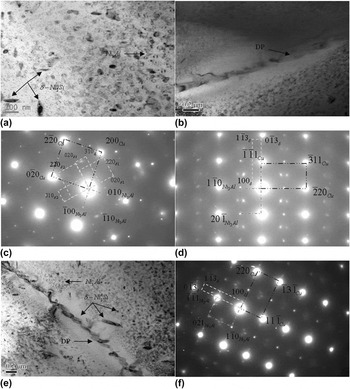
The microstructure of Cu–10Ni–3Al–0.8Si alloy as solution-treated at 950 °C for 4 h and isothermally treated at 550 °C for 900 s is displayed in Figs. 3(a) and 3(b) and the corresponding SADPs of Figs. 3(a) and 3(b) with beam direction along [001]Cu and [112]Cu are shown in Figs. 3(c) and 3(d), which indicated that both Ni3Al and δ-Ni2Si phases existed. The size of Ni3Al particles with zero-contrast line was about 40 nm and remained coherent with the matrix, and that of large incoherent δ-Ni2Si particles was about 100 nm [Fig. 3(a)]. However, DP occurred at the grain boundary after isothermally aged at 550 °C for 900 s [Fig. 3(b)]. Figures 3(e) and 3(f) show the bright field micrograph and the corresponding SADP of Cu–10Ni–3Al–0.8Si alloy isothermally treated at 550 °C for 900 s and then aged at 500 °C for 8 h. The size of coherent Ni3Al precipitates was still about 40 nm and δ-Ni2Si with a size of about 50 nm precipitated in the matrix, however, the discontinuous δ-Ni2Si precipitates with a size of about 200 nm appeared at the grain boundary after aging.
Micrographs and SADPs of Cu–10Ni–3Al–0.8Si alloy isothermally treated at 550 °C. (a) Bright field micrograph in the grain after isothermal treatment at 550 °C for 900 s; (b) bright field micrograph at the grain boundary after isothermal treatment at 550 °C for 900 s; (c) SADP of (a) with beam direction along [001]Cu; (d) SADP of (b) with beam direction along [112]Cu; (e) bright field micrograph after isothermal treatment at 550 °C for 900 s and aging at 500 °C for 8 h; and (f) SADP of (e) with beam direction along [112]Cu.

2. Isothermal treatment at 650 °C
Figure 4 presents the bright field micrographs and corresponding SADPs of Cu–10Ni–3Al–0.8Si alloy isothermally treated at 650 °C for 30 s. The SADP indicated that both δ-Ni2Si and Ni3Al phases precipitated in the matrix [Fig. 4(b)]. The average size of δ-Ni2Si particles with zero-contrast line was about 60 nm and a large quantity of coherent Ni3Al particles with zero-contrast line was about 25 nm [Fig. 4(a)].
Micrograph and SADPs of Cu–10Ni–3Al–0.8Si alloy isothermally treated at 650 °C for 30 s. (a) Bright field micrograph and (b) SADP of (a) with beam direction along [001]Cu.

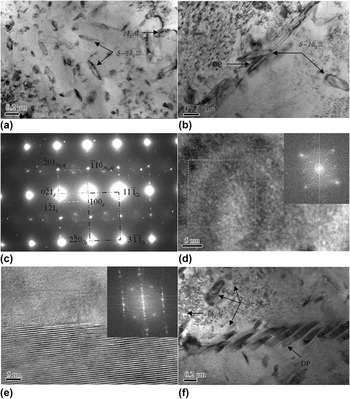
Figure 5 shows the bright field micrographs, SADP, and HRTEMs of Cu–10Ni–3Al–0.8Si alloy isothermally treated at 650 °C for 900 s. Both Ni3Al and δ-Ni2Si phases precipitated in the matrix. The size of Ni3Al particles with zero-contrast line was about 50 nm [Fig. 5(a)] and the HRTEM showed that those Ni3Al particles remained coherent with the matrix [Fig. 5(d)]. The large δ-Ni2Si precipitates with an average size of about 250 nm were observed in the matrix and the coarse δ-Ni2Si precipitates with a size of about 400 nm precipitated at the grain boundary [Fig. 5(b)]. The HRTEM of the δ-Ni2Si particle is shown in Fig. 5(e). After aging at 500 °C for 8 h, the size of discontinuous δ-Ni2Si precipitates at the grain boundary was about 500 nm and that of coherent Ni3Al particles was still about 50 nm; however, the fine δ-Ni2Si particles precipitated during aging were about 70 nm [Fig. 5(f)].
Micrographs, SADPs, and HRTEMs of Cu–10Ni–3Al–0.8Si alloy isothermally treated at 650 °C. (a) Bright field micrograph in the grain after isothermal treatment at 650 °C for 900 s; (b) bright field micrograph at the grain boundary after isothermal treatment at 650 °C for 900 s; (c) SADP of (a) with beam direction along [112]Cu; (d) HRTEM of Ni3Al; (e) HRTEM of δ-Ni2Si; and (f) bright field micrograph after isothermal treatment at 650 °C for 900 s and aging at 500 °C for 8 h.

3. Isothermal treatment at 750 °C
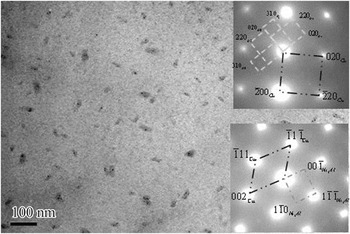
The bright field micrograph and corresponding SADPs of Cu–10Ni–3Al–0.8Si alloy isothermally treated at 750 °C for 30 s are shown in Fig. 6, which indicated that both δ-Ni2Si and Ni3Al with a size of about 15 nm precipitated in the matrix.
Micrograph and SADPs of Cu–10Ni–3Al–0.8Si alloy isothermally treated at 750 °C for 30 s.

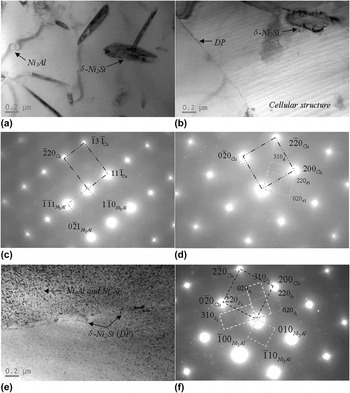
Figure 7 presents the microstructure and corresponding SADPs of Cu–10Ni–3Al–0.8Si alloy isothermally treated at 750 °C for 900 s. The large δ-Ni2Si with a size of about 400 nm and Ni3Al with a size of about 100 nm precipitated [Fig. 7(a)]. DP began to nucleate at the grain boundary and cellular structure was observed after isothermally treated at 750 °C for 900 s [Fig. 7(b)]. The corresponding SADPs of Figs. 7(a) and 7(b) showed that both Ni3Al and δ-Ni2Si phases appeared in the matrix [Figs. 7(c) and 7(d)]. The diffraction of Ni3Al in the SADPs was very weak, because the solid solution temperature for Ni3Al was about 780 °C and precipitation of metastable Ni3Al decreased obviously during isothermal treatment at 750 °C. Reference Alexander21,Reference Cho, Kim and Lee22 However, after isothermal treatment at 750 °C for 900 s and aging at 500 °C for 8 h, the size of discontinuous δ-Ni2Si precipitates at the grain boundary was about 150 nm, while a great number of fine δ-Ni2Si and Ni3Al particles precipitated during aging at 500 °C, and the size of those fine δ-Ni2Si and coherent Ni3Al particles inside the grain was about 40 nm [Figs. 7(e) and 7(f)].
Micrographs and SADPs of Cu–10Ni–3Al–0.8Si alloy isothermally treated at 750 °C. (a) Bright field micrograph of the grain after isothermal treatment at 750 °C for 900 s; (b) bright field micrograph at the grain boundary after isothermal treatment at 750 °C for 900 s; (c) SADP of (a) with beam direction along [001]Cu; (d) SADP of (a) with beam direction along [112]Cu; (e) bright field micrograph after isothermal treatment at 750 °C for 900 s and aging at 500 °C for 8 h; and (f) SADP of (e) with beam direction along [001]Cu.

C. The quench sensitivity
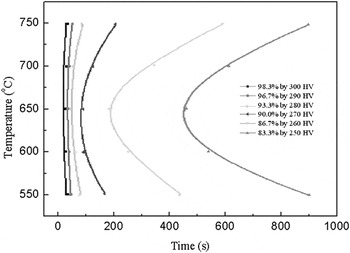
The TTP curves of Cu–10Ni–3Al–0.8Si alloy based on microhardness experiments after isothermal and aging treatment are presented in Fig. 8. The TTP curves were fitted by the following equation Reference Robinson, Cudd, Tanner and Dolan23 :
 $$C(T) = {k_1}{k_2}\exp \left[ {{{{k_3}\mathop {{k_4}}\nolimits^2 } \over {RT{{({k_4} - T)}^2}}}} \right]\exp \left[ {{{{k_5}} \over {RT}}} \right]\quad {\rm{,}}$$
where C(T) was the time, T was the isothermal temperature, R was the gas molar constant, and k 1, k 2, k 3, k 4, and k 5 were constants, which were related to the natural logarithm of the volume fraction of untransformed precipitates, the reciprocal of the number of nucleation sites, the formation energy of nucleation, solid solution temperature, and the diffusion activation energy, respectively. The fitted coefficients of TTP curves are listed in Table II.
The TTP curves of Cu–10Ni–3Al–0.8Si alloy.

The fitted coefficients of TTP curves.

The TTP curves were typical C-type ones and the fitted nose temperature was about 662 °C. The TTP curves could be divided into three regions: the nose temperature region, low temperature region, and high temperature region. The alloys presented high quench sensitivity as quenched from the nose temperature. The quench sensitivity of the alloy decreased continually when the quench temperature was above or below 650 °C.
Quench sensitivity was closely related to the decomposition ability of supersaturated solid solution during isothermal treatment. The precipitation in Cu–10Ni–3Al–0.8Si alloy during isothermal and aging treatment was a thermally activated process. The precipitation process was determined by both the diffusion rate of atoms and the nucleation rate of precipitates. The diffusion rate of atoms increased with the increasing isothermal temperature, which accelerated the growth rate of precipitates. However, the nucleation rate decreased with the increasing isothermal temperature, which leaded to the decrease of the amount of precipitates.
Both Ni3Al and Ni2Si precipitated during isothermal treatment and the degree of supersaturated solid solution increased with isothermal temperature. As a result, fine Ni3Al and Ni2Si particles would continue to precipitate during aging and the amount of precipitates increased with the isothermal temperature. The interactions between those precipitates and the matrix increased the strength of Cu–10Ni–3Al–0.8Si alloy, which can be described by the Orowan looping mechanism. The increment of strength increased with volume fraction of precipitates and decreased with particle size, which could be calculated as follows Reference Torma, Kovács, Turmezey, Ungár and Kovács24 :
 $${\sigma _{0.2}} =\; 0.85m{G \over {2\pi {{(1 - \nu )}^{1/2}}}}{\left( {{f \over 2}} \right)^{1/2}} \times {{b\ln (R\pi /2{r_0})} \over {R\left[ {1 - (\pi /2){{(f/2)}^{1/2}}} \right]}}$$
where m is the Taylor factor of copper, G is the shear modulus of copper, R is the average radius of precipitates, b is the Burgers vector, ν is the Poisson's ratio, r 0 is the cut-off radius of the dislocation core, and f is the volume fraction of precipitates.
The microhardness of Cu–10Ni–3Al–0.8Si alloy after solution treatment was about 135.6 HV, which increased to 249.9 HV after isothermal treatment at 550 °C for 900 s, then aged at 500 °C for 8 h; while the isothermal temperature increased to 750 °C, the hardness increased 257.4 HV after isothermal treatment and aging; when the alloy was isothermally treated at 650 °C, the hardness only increased to 226.3 HV [Fig. 1]. According to the bright field micrographs of Fig. 3(e), the particle size of fine Ni3Al and Ni2Si was about 40 and 50 nm, while that of discontinuous Ni2Si was about 200 nm after isothermal treatment at 550 °C and aging. The increment of strength was calculated to be 304.8 MPa. As the isothermal temperature increased to 650 °C, the size of fine Ni3Al and Ni2Si was about 50 and 70 nm [Fig. 5(f)], and the size of discontinuous Ni2Si was about 500 nm, thus the strength of Cu–10Ni–3Al–0.8Si alloy only increased by 248.5 MPa. Further increasing the isothermal temperature to 750 °C, the size of fine Ni3Al and Ni2Si was about 20 nm [Fig. 7(e)], while the size of discontinuous Ni2Si was about 150 nm, as a result, the strength increased by 337.5 MPa. The calculation results indicated that Cu–10Ni–3Al–0.8Si alloy showed lowest strengthening response after isothermally treated at 650 °C for 900 s and then aged at 500 °C for 8 h, which agreed well with our experimental results. The Cu–10Ni–3Al–0.8Si alloy showed lowest strength response after isothermal treatment at the nose temperature region and aging, because the incubation of precipitation was shorter and the nucleation and growth rate of those precipitates were faster. In addition, a plenty of discontinuous δ-Ni2Si phases precipitated at the grain boundary after isothermal treatment at the nose temperature and grew up quickly after aging, resulting in low microhardness value. Therefore, the Cu–10Ni–3Al–0.8Si alloy presented high quench sensitivity at the nose temperature region.
IV. CONCLUSIONS
This study focused on the study of the evolution of microstructure and comprehensive properties during isothermal treatment and aging. The TTP curves of Cu–10Ni–3Al–0.8Si alloy were established and the reasons for high quench sensitivity at the nose temperature region were discussed. The main conclusions can be drawn as follows:
-
(1) Both the microhardness and electrical conductivity of isothermally treated Cu–10Ni–3Al–0.8Si alloy increased with the isothermal time and decreased with the increasing isothermal temperature, the hardness of the alloys after isothermal and aging treatment decreased as the isothermal time increased.
-
(2) Ni3Al precipitates with L12 ordered structure and δ-Ni2Si precipitates with DO22 ordered structure were confirmed in isothermally treated Cu–10Ni–3Al–0.8Si alloy. DP began to occur in Cu–10Ni–3Al–0.8Si alloy isothermally treated at 550 °C for 900 s. Coarsen Ni2Si precipitates appeared at the grain boundary as the isothermal temperature increased to 650 °C. Cellular structure was observed as the isothermal temperature increased to 750 °C.
-
(3) The TTP curves of Cu–10Ni–3Al–0.8Si alloy were C-type ones and the nose temperature was about 662 °C. The alloy presented high quench sensitivity at the nose temperature region, because the nucleation and growth rate of precipitates were faster, and a plenty of discontinuous δ-Ni2Si phases precipitated at the grain boundary and grew up quickly.
ACKNOWLEDGMENTS
The authors are pleased to acknowledge the financial supply supported by the National Natural Science Foundation of China (51271203), Hunan Provincial Natural Science Foundation of China (11JJ2025), and the Nonferrous Metals Science Foundation of HNG-CSU (YSZN2013CL06).