


INTRODUCTION
Asset and income inequalities in Africa remain amongst the highest in the world, with mean levels of income inequality in Sub-Saharan Africa (SSA) falling just below that of Latin America and the Caribbean, but being significantly higher than those in Asia (Shimeles & Nabassaga Reference Shimeles and Nabassaga2018). Despite some promising declines in inequality in a few SSA states in the 2000s (Beegle et al. Reference Beegle, Christiaensen, Dabalen and Gaddis2016; Nel Reference Nel2018), there is evidence of increased polarisation of incomes given the uneven and unsustainable nature of economic growth stimulated by international resource demands (Clementi et al. Reference Clementi, Fabiani and Molini2019).
The literature proposes a range of explanations for the persistence of African income inequality (hereafter ‘inequality’) and its negative impact on poverty relief (Van de Walle Reference Van de Walle2009; Bigsten Reference Bigsten2016; Shimeles & Nabassaga Reference Shimeles and Nabassaga2018; Nel Reference Nel, Binns, Lynch and Nel2019). Surprisingly, though, very little attention has been paid to subjective factors, such as attitudes to inequality on the part of African citizens. This is a major oversight in the literature on Africa and contrasts with the attention that inequality attitudes and their effects on institutional quality and on inequality levels have received elsewhere (see Cramer & Kaufman Reference Cramer and Kaufman2011; Schröder Reference Schröder2017; Chong & Gradstein Reference Chong and Gradstein2019).
We now have systematic survey-based evidence, covering a large part of the African continent, which can help us to understand African attitudes to inequality. This paper explores a prime source of such data, namely the World Values Survey (WVS) (Inglehart et al. Reference Inglehart, Haerpfer, Moreno, Welzel, Kizilova, Diez-Medrano, Lagos, Norris, Ponarin and Puranen2014). The WVS's coverage of Africa has steadily improved since the launch of its fourth wave in 1999, allowing us to trace African responses and to contrast African attitudes with those held by respondents elsewhere in the world. The WVS is the only truly global survey programme and is unparalleled in terms of the transparency of its sampling methodology and in allowing for comparisons across a range of industrialised and industrialising states. The WVS also has the added advantage that one of its questions captures attitudes to income inequality specifically and that this same question has been asked unchanged over the three waves of surveys conducted between 1999 and 2014, the period we are focusing on here.
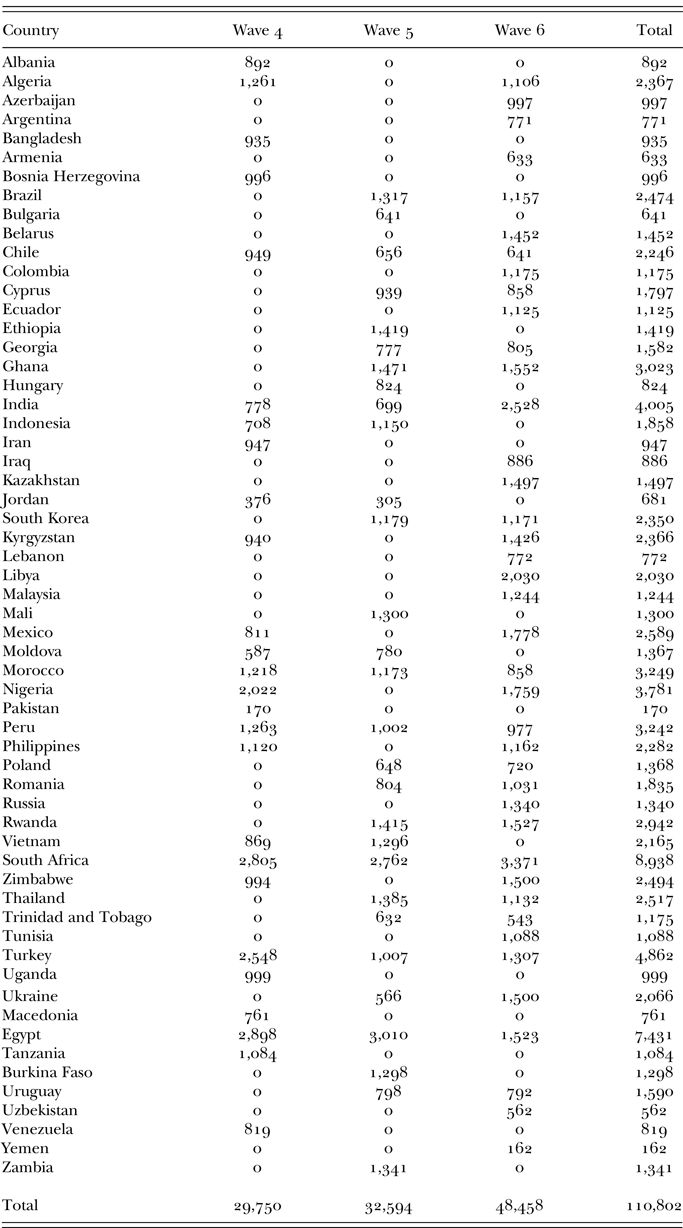
This paper focuses on three waves of the WVS (waves four to six), conducted between 1999 and 2014.Footnote 1 I construct a sample of 59 developing and transition countries covering a total of maximally 110,802 respondents, including 44,784 respondents from 16 African states.Footnote 2 The African states are Algeria, Burkina Faso, Egypt, Ethiopia, Ghana, Libya, Mali, Morocco, Nigeria, Rwanda, South Africa, Tanzania, Tunisia, Uganda, Zambia and Zimbabwe, representing all the regions of the continent. Not all states were included in all three waves of the WVS. There are altogether 27 country-wave surveys covering the 16 African states, and 95 country-wave surveys for the whole sample (see Table III in Appendix B). Country surveys are based on representative samples, and weighting is used to equalise observations/responses to 1000 per country per wave. Individual survey responses (level one) are nested within countries (level 2).Footnote 3 Apart from the African states, the criteria for inclusion in my sample of developing and transition countries are (a) whether a state was not an original Organization of Economic Cooperation and Development (OECD) member (hence Chile, Mexico, South Korea and Turkey – now OECD members – are included), and (b) whether data were available for a specific state for the range of measures employed in the analyses carried out below.
The most striking aspect of the data is that African respondents across the board are considerably more tolerant of inequality than respondents from other comparable countries, and more so than one would expect given the high levels of inequality in Africa. Our item of interest is responses to the question titled ‘Income Inequality’. Respondents are asked to specify on a 10-point scale their preference with respect to the statement ‘Incomes should be made more equal’ (scale point 1), contrasted with ‘We need larger income differences as incentives for individual effort’ (scale point 10). It is clear that answers to this question represent a normative assessment on the part of respondents of whether inequality in a society should be welcomed or not (Katic & Ingram Reference Katic and Ingram2018). I refer to the attitudes that correspond to responses at the upper end of the scale as ‘tolerance of inequality’, alternatively ‘welcoming inequality’ or ‘accepting inequality’. The opposite is ‘aversion to inequality’ and is reflected in the lower register.
Figure 1(a) reports the country means related to the inequality question for the 16 African states across the period 1999–2015. It also highlights the difference between the mean of all African responses to this question (6.4, solid line) and non-African (5.57, dashed line) responses – a difference of 0.83 on the 10-point scale. The non-African sub-sample consists of developing countries (mean 5.8) and so-called transition states, that is, states with a communist legal origin (mean 5.5). Note that Figure 1(a) treats the answers to this particular WVS question as constituting a continuous scale, as we will also do in the rest of the paper (see also Katic & Ingram Reference Katic and Ingram2018). If we treat it as an ordinal scale, and use the median as the indicator of central tendency, the median in the case of Africa is 7 while that of the non-African respondents is 6 – again a large difference. There is notable variation across the 16 African states with country means across the various surveys waves ranging from above 7 in the case of Burkina Faso, Uganda, Ghana, Algeria and Mali. In contrast, Tanzania, Rwanda, South Africa and Tunisia have means below 6. This, together with the overall variation in the data, underlines the importance of considering national-level variables as complements to individual-level attributes.
Contrasting inequality tolerance in Africa with rest of the sample.
Source: Own calculations, based on World Values Surveys, waves 4, 5 & 6.

It is reasonable to expect inequality tolerance levels to vary across class positions, although this variation does not necessarily coincide with patterns in highly industrialised societies where lower classes prefer less inequality and higher classes, more inequality (Andersen & Curtis Reference Andersen, Curtis, Banting and Myles2013; Curtis & Andersen Reference Curtis and Andersen2015).Footnote 4 This pattern does not apply to our sample of African and non-African industrialising societies, as Figure 1(b) shows. Figure 1(b) contains the means of responses across five class categories, again contrasting African responses with those of the rest of the sample. This class classification is based on a WVS question in which respondents are asked to put themselves in one of the five categories included in Figure 1(b). As we explain later, this self-classification is likely to be based on a range of comparative features, including assessment of relative income, and thus already tells us something of how respondents assess their own relative position in a society. It is noteworthy that the higher propensity for inequality tolerance on the part of Africans cuts across class lines. Our main task in this paper is to try and account for these contrasts with non-African classes.
Contrasting inequality tolerance across five self-identified classes.
Source: Own calculations, based on World Values Surveys, waves 4, 5 & 6.

To do so, in the second section I identify two sets of potential explanations based on a literature survey that stretches back to the 1970s. The first set focuses on the interpersonal comparisons that people make within their immediate reference groups and the lessons that they draw from those comparisons. Does the fact that my neighbour is doing well mean that I should envy her, or does her fortune inspire me to also hope for something better to come my way? The second set of potential explanations is based on the social-psychological literature that emphasises that people in general are prone to adjust their expectations to the status quo (Trump Reference Trump2013). This process of habituation, also called the status-quo bias, is common, but different factors in different countries determine how it pans out. In the case of Africa this bias is strongly influenced by religion, with the religiously devoted more prone to accept the status quo as being as it should be. The third section discusses the data and methods used in the paper, and then proceeds to test the validity of these explanations. The fourth section concludes.
THEORETICAL CONSIDERATIONS
Cognitive maps, reference groups and prospects of upward mobility
The earliest and still very influential explanation of why respondents tolerate inequality has to do with how they perceive their own prospects, and those of their children, being affected by dynamics in their immediate reference group and their relative position in that group. Peter Lloyd's detailed ethnographic study of social-inequality perceptions among urban Yoruba men in Nigeria in the 1960s and early 1970s is still the only detailed study on African inequality attitudes to date (Lloyd Reference Lloyd1974). His starting point is to draw a distinction between the prevalent immediate inequality ‘cognitive maps’ of his respondents on the one hand, and broader understandings of the distribution of resources and its structural underpinnings in the society as a whole. While the latter is abstract and mostly poorly developed among non-specialists, the former is detailed and conditioned by the day to day experiences of individual respondents with others within their own reference group. Respondents might have some vague notions of the distributional structure of their society, but they know very well how their neighbours and members of their extended family are doing materially. We should thus try to understand how individuals in their immediate contexts, and with respect to their own reference groups, perceive and understand the incentives and constraints that they face. This, of course, makes life difficult for the analyst: instead of relying, for instance, on social-scientific measurements of actual inequality in a society, we have to identify the constituents of elusive individual cognitive maps of lived, experienced inequality. Below, I suggest a way in which we can get an empirical handle on this.
Lloyd's study of the attitudes of urban Yoruba men reveals a large degree of tolerance of social inequality. Wealth and income inequality are very much ubiquitous features of Yoruba society, and these, and tolerance thereof, have long historical roots. For Lloyd, tolerance can be traced back to the pre-colonial and post-colonial acceptance of the power and influence of the traditional ruler (‘Big Man’), whose position and role in society are accepted as fundamental determinants of one's own position and prospects in life. If one stands to benefit from the position and role of the ‘Big Man’, there is no reason to resent the fact that this person is so much more wealthy and influential than the respondent himself is. It is only by being rich and powerful that some have the capacity to redistribute opportunities and income through their largesse. Ironically, then, redistribution (that is, the levelling of income differences) is dependent on the acceptance of the legitimacy of the very inequality that concentrates resources in the hands of the ‘Big Man’. In general, Lloyd concludes, the ‘legitimacy of great differences in wealth and income was accepted by many men so long as they, or more realistically, their children could achieve high position’ (Lloyd Reference Lloyd1974: 190). Lloyd also emphasises that these expectations can be, and have increasingly been, disappointed in the political and social turmoil that followed independence, giving rise to sentiments of envy and resentment amongst those who have not advanced, and whose children also draw no benefits from prevailing patron-client relationships. Does that mean that respondents will revolt, or are there factors that induce compliant and fatalistic acceptance of their lot? When we turn to the role of religion below, we will get back to this question.
The early work of Albert O. Hirschman on developing countries, dating roughly from the same period as Lloyd's work on the Yoruba, also highlights the fact that respondents may – at least initially – draw positive conclusions from inequality-inducing dynamics within their immediate reference groups (Hirschman Reference Hirschman1973). Like Lloyd, Hirschman is struck by the high level of acceptance of inequality among populations in unequal societies in the developing world. To explain this, Hirschman believes that we do not have to assume that people are fully informed about the true state of inequality in their society, that is, that they fully understand the structural details and ramifications of income and wealth distribution. We can accept, though, that people have access to evidence of relative improvements and other dynamics in the position and prospects of members of their immediate reference group, and that they can draw conclusions from that evidence that will affect their expectations about their own prospects and relative status within that group.
Hirschman points out that in early-modernising societies, experienced inequality due to the changing fortunes of some, bring people to tolerate inequality more. In terms that were later coined, it is the prospect of upward mobility (POUM) that drives this process (Piketty Reference Piketty1995; Benabou & Ok Reference Benabou and Ok2001). Hirschman's article in which he develops this idea is an extended parable of the so-called ‘tunnel effect’: Two backed-up traffic lanes are passing through a one-way tunnel. When motorists in one line see some movement in the other lane, they take heart that the traffic jam ahead is being resolved and that they will also be able to move soon. Their aspirations are positively shaped by available and easily accessible evidence of fortuitous improvement that others in their immediate reference group are experiencing, and the expectation that fortune could also be coming their way. Analogously, Hirschman suggests, members of a society undergoing socio-economic modernisation take heart from evidence of improving income and wealth conditions experienced by their neighbours and/or family members, even though the immediate effect of these improvements may be favouring some more than others. It is reasonable to assume that the tolerance-enhancing effect will be more pronounced among those who stand to gain the most from opportunities for upward mobility, i.e. lower income or class groups.Footnote 5
Hirschman's original formulation of the tunnel effect is not exactly clear on what the relative importance of economic growth, on the one hand, and experienced (perceived) inequality on the other hand, is. In his formal model, Davis (Reference Davis2019) shows that economic growth may have an effect independent of perceived inequality. It is thus advisable to distinguish between the effects of each factor, and with reference to different class categories. Also importantly, Hirschman's suggestions apply specifically to societies in early phases of economic modernization. Such societies provide, in the image used by Senik (Reference Senik2009) and inspired by Hirschman, new ‘ladders’ that can be scaled. Evidence that some are indeed scaling the new ladders provides reassurance that ‘our time will also come’ and POUM sets in.Footnote 6
Habituation and religion
The social-psychological literature suggests that people, as a rule, are prone to accept the status quo not only as inevitable, but also as just. This status-quo bias reflects a process of habituation in which people adjust to their conditions by accepting them as normal. Eidelman & Crandall (Reference Eidelman, Crandall, Jost, Kay and Thorisdottir2009: 85) consider this bias arises because ‘the legitimate consideration and endorsement of alternatives may require more effort, control, awareness, or intention than does supporting the status quo’.Footnote 7 Hence, people adjust to inequality, and increases in it by altering their expectations and normative assessments to comply with what they perceive around them and to avoid costly cognitive dissonance. The status quo is thus treated as if things are as they should be (Trump Reference Trump2013). While this is likely to be a general social-ideological phenomenon, one can still legitimately ask why its effect on inequality tolerance is pronounced in some societies rather than in others, and why it seems to affect some individuals more than others.
The literature suggests two possible answers to these questions. On the one hand, religion can be a powerful force in persuading people to accept the status quo. Secondly, life-satisfaction has been found to be (surprisingly) positively related to income inequality.
If what happens around us is the will of an all-powerful and benign metaphysical ‘Big Man’, then the status quo must surely be part of a divine plan, not to be challenged by mere mortals. This way of thinking is of course quite a boon for those who benefit from the existing patterns of distribution in society and, as expected, the rich thus promote religion and religious ideas to legitimise and normalise their relative power position (Solt et al. Reference Solt, Habel and Grant2011). For the poor, religion and religious affiliation act more as compensatory substitutes. Scheve & Stasavage (Reference Scheve and Stasavage2006), using WVS data among others, show that religion acts as a substitute for preferences for social insurance in that it provides insurance against life shocks. It also has what they call a ‘network externality’, meaning that religious individuals gain reassurance when those around them are religious as well. Within these networks, believers can be confident of the assistance of others when things go wrong for themselves. Apart from reassuring believers that, ultimately, society is in the hands of a benign deity, religion is also known to buffer believers against whatever shocks life throws at them and thus increases tolerance of adverse processes and outcomes, including inequality (Joshanloo & Weijers Reference Joshanloo and Weijers2016).
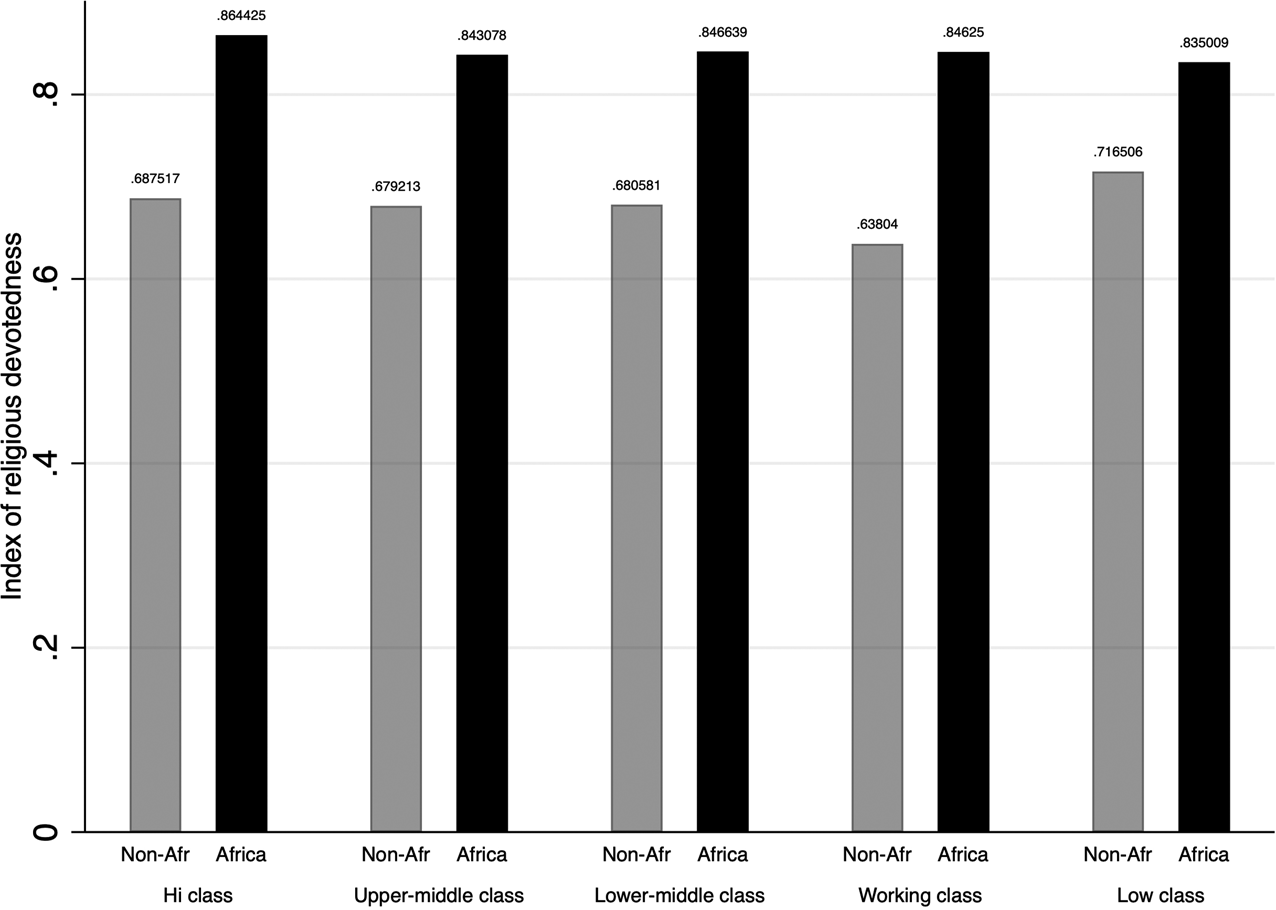
The measures of religiosity that can be gleaned from WVS responses all indicate that African respondents are, on average, highly religious and more so than others in the rest of our sample. African respondents, for example, are two-and-a-half times more likely to regard God as very important in their lives. Ninety per cent of African respondents regard religion as important or very important, while only 70% of non-African respondents agree. Religion is thus obviously an important factor in the lives of many Africans, be they Muslims, Christians, or followers of traditional African religions. As one observer on religion in West Africa puts it, ‘in Africa, religion is life and life is religion’ (Opoku Reference Opoku1978: 1). Figure 2 confirms that in our sample, Africans of all classes and across different regions are significantly more religious than their counterparts elsewhere.
Religious devotedness in Africa compared with rest of sample.
Source: Own calculations, based on World Values Surveys, waves 4, 5 & 6. Measure of devotedness is ‘Index of religious devotedness’. See text for description.

In his study of inequality attitudes among Yoruba males, Peter Lloyd (Reference Lloyd1974) also turns to religion as an explanation of why respondents who are disappointed with the lack of benefits accruing to them do not engage in more resistance. Recall that he argues that Yoruba males traditionally are tolerant of the big differences in wealth and income that they observe around them, and in particular between themselves and the ‘Big Men’ in their society. They tolerate these differences because of the expectation that they and/or their children will benefit from the largesse of a benign patron. When these benefits do not accrue to them, as has increasingly happened in post-colonial Nigeria where many expectations are continuously being disappointed, Lloyd's respondents showed a remarkable disinclination for resistance or revolt, and an inclination for fatalistic acceptance of their lot and an accommodating flight into religion. While Lloyd does not analyse the specific mechanisms at play in any great depth, he does suggest that it is the compensatory effect of religion that explains the continued acceptance of inequality, thus foreshadowing the findings of Scheve & Stasavage (Reference Scheve and Stasavage2006).
ACCOUNTING FOR AFRICAN ATTITUDES
Data and methods
In this section, I proceed to conduct tests for the two sets of explanations briefly summarised in the previous section. As mentioned, social class position and association have been identified as significant predictors of inequality attitudes (see in particular Andersen & Curtis Reference Andersen, Curtis, Banting and Myles2013; Curtis & Andersen Reference Curtis and Andersen2015). In the previous section, we also indicated that it is likely that the effects of the explanatory factors that we are looking at may differ across classes. Here, we are particularly interested in how class self-identification could moderate the relationships between outcomes and explanatory factors. There is an ongoing debate about the relevance of ascribed class positions in Africa. Is there really an African middle class, for instance? (See Melber Reference Melber2016, for example.) I wish to avoid those debates. Thankfully, the WVS comes to our assistance by asking respondents to place themselves in one of five class categories, namely upper class, high-middle class, low-middle class, working class and low class. While the meanings attributed to what it means to be a member of one of these classes surely differ from society to society, we are here not so much interested in the question of whether a respondent's class identification accurately reflects her actual/true position within the structures of society. We are more interested in what a respondent's choice tells us about how she compares herself with others in her reference group, specifically with respect to relative income, capability, and the degree to which she believes that she receives due recognition from others. In the WVS data, class self-classification is not only significantly correlated with self-placement on a spectrum of incomes. It also correlates significantly (at the 1% level) with whether a respondent believes that she has a large/small degree of control over and choice in her life, and whether a respondent believes that she is treated fairly or unfairly by others in her society. All three of these dimensions are relative, in the sense that they depend on an assessment by the individual of where she fits into a specific hierarchy. Among many benefits that this has is the fact that class self-classification also reveals something of the respondent's lived-experience of inequality in her society. As a general rule, the higher a respondent believes her household income to be, the more she believes that she is in charge of her own options and choices, and the more she believes that others treat her fairly, the more she is likely to place herself higher in the five-point class categories. We can thus be confident that class self-placement in the WVS gives us a reasonably good grasp of the individual's ‘cognitive map’ about inequality that Lloyd spoke about: how respondents experience and interpret their own relative position among their specific reference group. Attitudes to income and wealth inequality, Lloyd also pointed out, are largely determined by these cognitive maps. In what follows, these five class categories are consistently used to trace the differential effects of explanatory factors in our sample.
There is another reason why class self-identification is important. The fact that self-placement in a class category reflects an assessment of one's relative position in society implies that the underlying frequency distribution of where respondents place themselves in the five categories, reveals something about the pattern of lived-experience of inequality in a particular society. If the sample of respondents in a country is broadly representative of that society (as the WVS surveys are), then how respondents' self-classifications are distributed across the five categories would form a representative pattern of how inequality is experienced overall in that society. Following Choi (Reference Choi2019), I exploit the underlying frequency-structure of responses to this self-classification question to construct a nation-wide measure of perceived inequality, using the standard formula for calculating the Gini coefficient of distribution. A low Gini score would imply that the distribution is skewed in the sense that fewer of the respondents experience themselves to be among the lower classes. A high Gini would imply the opposite. It is important to develop a measure of experienced inequality as there is overwhelming evidence that social-scientific measures of income distribution do not necessarily reflect peoples’ own understanding or perceptions of inequality in their society (Gimpelson & Treisman Reference Gimpelson and Treisman2015; Choi Reference Choi2019). That does not mean that the lived experience of inequality has no relationship with actual income distribution in Africa at all. In our African sub-dataset there is a positive and significant correlation of 0.443 between our measure of experienced inequality and actual income distribution as measured by economists in the Global Consumption and Income Project (GCIP). The correlation is even stronger (0.493) between experienced inequality and the measure of net disposable income calculated by Solt (Reference Solt2019) in his Standard World Income Inequality Dataset (SWIID).
In testing the explanations discussed above, our workhorses are a set of generalised linear multilevel models in which the dependent variables are continuous, and individual respondent attributes are combined with national level characteristics as covariates. It is a credit to the richness of the WVS questionnaires that we are in a position to conduct tests for both explanations summarised above. Tests conducted below relying on individual and aggregated survey responses to specific questions control for a range of individual attributes, such as gender, marital status, age, education, employment status, political orientation, and whether a household is in a position to save or not. These are all covariates that previous studies of inequality attitudes have highlighted as important (Cramer & Kaufman Reference Cramer and Kaufman2011; Haggard et al. Reference Haggard, Kaufman and Long2013; Curtis & Andersen Reference Curtis and Andersen2015; Katic & Ingram Reference Katic and Ingram2018; Lierse Reference Lierse2019).
Four national-level attributes are important. The first bridges the divide between individual and national levels: our class-based measure of experienced inequality. The Gini of actual income distribution is contrasted with this measure of experienced inequality. The third is a measure of the degree of economic modernisation a society has undergone, and aims at capturing Hirschman's suggestion that the tunnel effect emerges in modernising societies in particular. I use the share of natural-resource rents as such a measure. African economies are across the board heavily dependent on rents from natural resource extraction (Taylor Reference Taylor2016), while manufacturing is not only underdeveloped, but its contribution to GDP was actually declining during the period under review, even in the most advanced economy, South Africa. In our sample, natural resource rents contributed about 6% more to African states' GDP than the non-African states during the period 1999–2015. At the same time, manufacturing was on average 5% more important among the latter states, compared with the 16 African states. It is well known that economic growth in Africa, from the early 1990s and up until 2008, was largely driven by increased exports of natural resources. These formed the largest sectoral contribution to GDP growth, considerably more than agriculture, telecommunications and manufacturing (Leke et al. Reference Leke, Lund, Roxburgh and van Wamelen2010).
To measure economic growth, our fourth national-level variable of interest, growth in real GDP per capita is used. Five-year averages of this, the Gini of actual income distribution, and the natural-resource rents-measure are taken, and lagged, thus values are used from a five-year period preceding the time that a specific survey-wave took place. Group-mean and the group-mean centred values of continuous level-2 factors are both used. Group-mean centring is achieved by subtracting the group mean from the individual observations of a variable, thus showing how the values associated with the variable have changed over the different waves. We can trace the effect of a variable across the various units of analysis (between variation), and we can also trace its within-country longitudinal effect, that is, how changes in the value of a variable over time affect the outcome/dependent variable (Fairbrother Reference Fairbrother2014). The fact that some individual level-2 units (countries) were sampled in more than one WVS wave gives the data a quasi-panel nature in testing for both the cross-country and within-country (longitudinal) effects.
Testing for the tunnel effect
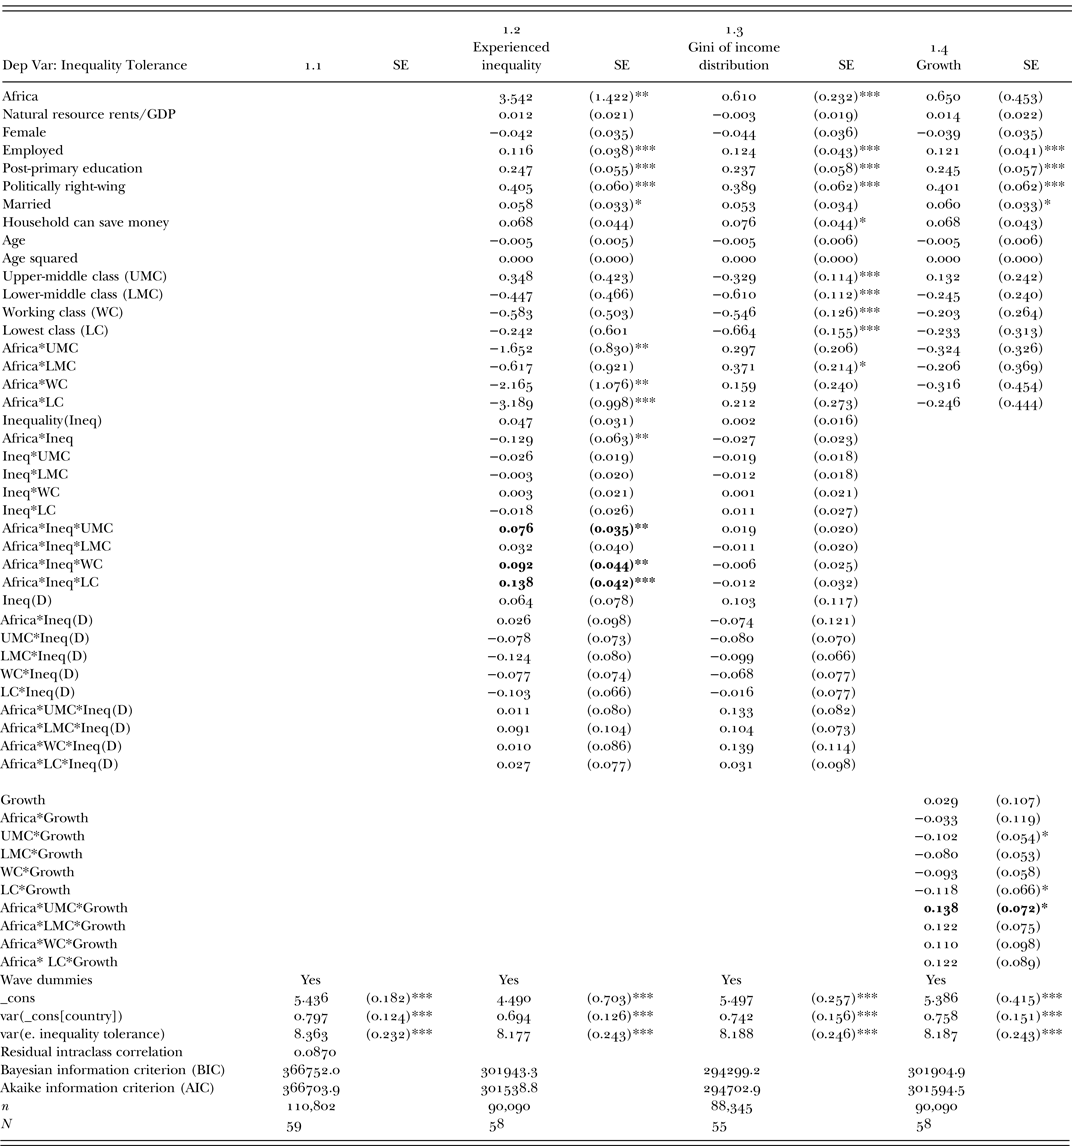
Columns 1.2–1.4 in Table I in Appendix A report the results of multilevel generalized linear regression tests of the tunnel (POUM) effect, distinguishing between the potential influence of experienced inequality on the one hand, and natural-resource-related economic growth on the other. Intercepts are allowed to vary by country. I distinguish between the relative effects of these factors across the various class-categories, treating the highest class position as the reference category. Column 1.1 contains the null model, devoid of any predictor and control variables. Significant findings among the main predictor variables in columns 1.2–1.4 are marked in bold.
There is some evidence to support the tunnel effect, both when we focus on the conditioning role of perceived inequality and the role of economic growth fuelled by natural resource rents. Both of these factors, independently of each other, enhance the tolerance of inequality among Africans. However, this does not apply equally to all four classes in our African sample. As column 1.2 in Table I (Appendix A) shows, it is only in the cases of the upper-middle class, the working class and the lowest class that experienced inequality has a significant tolerance-enhancing effect in Africa. This effect is strongest and most significant in the case of the lowest class, with the working class coming in at second place. This suggests that the expectations of potential upward mobility, as stimulated by the level of experienced inequality, are strongest among respondents who regard themselves as working and low class. Column 1.3 contrasts these results with the effects achieved when we replace our measure of lived, experienced inequality with the Gini of actual income distribution. None of the coefficients associated with the latter are significant, though. As noted, we also include longitudinal versions of both the experienced inequality and the income-distribution Gini – named Ineq(D) – in Table I. All of the coefficients are positive, suggesting that increases in experienced and in actual inequality both enhance inequality tolerance across all four classes, but none of these effects are significant.
As identified by Davis (Reference Davis2019) in his modelling of Hirschman's tunnel effect, economic growth can also trigger the tunnel effect independently of experienced inequality as people perceive that the benefits of growth may also accrue to them. We test for this in column 1.4 in Table I, using growth in GDP per capita as our measure of growth, and still controlling for the size-contribution of natural resource rents. All four African classes respond positively to economic growth. However, the effect is only significant (and only at the 10% level) in the case of the upper-middle class. It would thus seem as if economic growth stimulates prospects of upward mobility the strongest among the upper-middle class. It should be noted that GDP per capita and its growth is heavily skewed towards growth in the formal sector, and it is only to be expected that the upper-middle class, which is probably well represented in the formal sector, will be encouraged most by expanding prospects in the formal sector of the economy. The informal sector in Africa is quite large, and the other classes are most likely better represented in that sector, and are thus less significantly affected by perceptions of expanding opportunities in the formal sector.
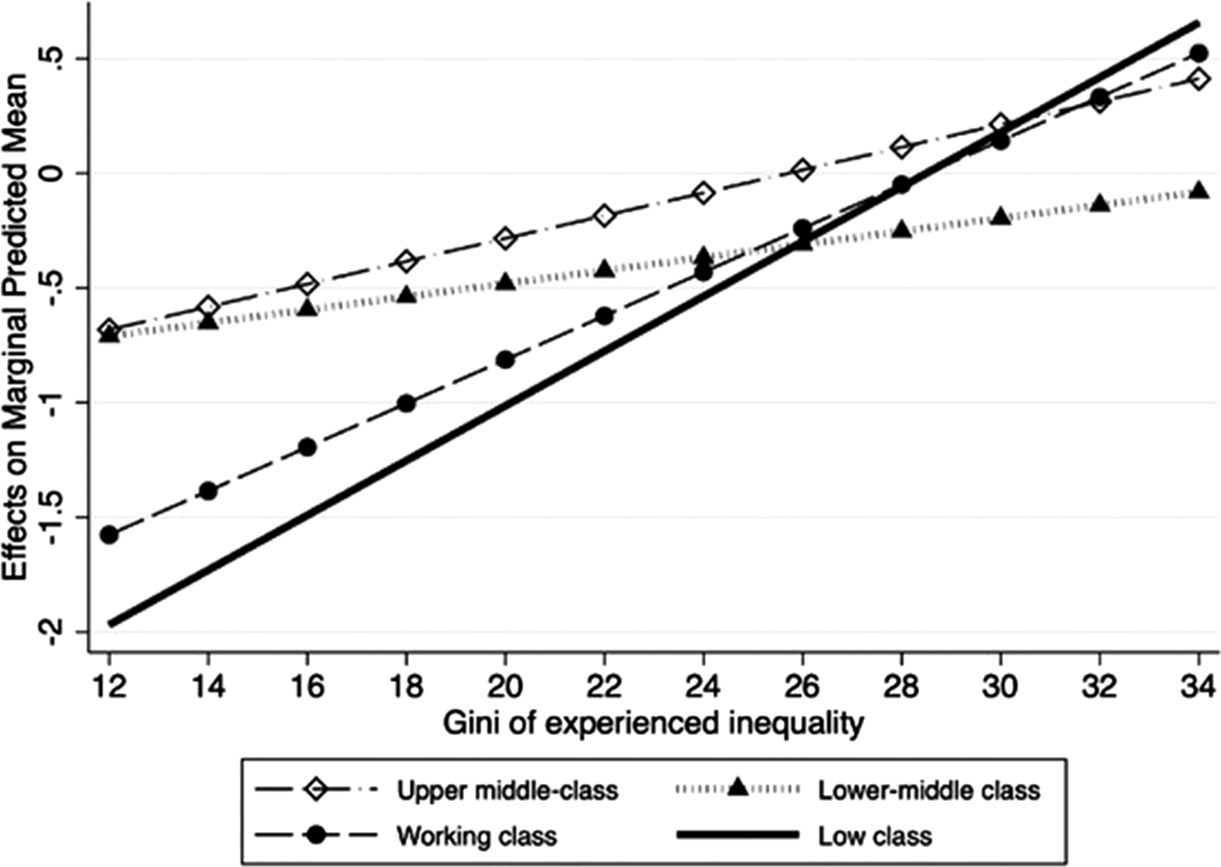
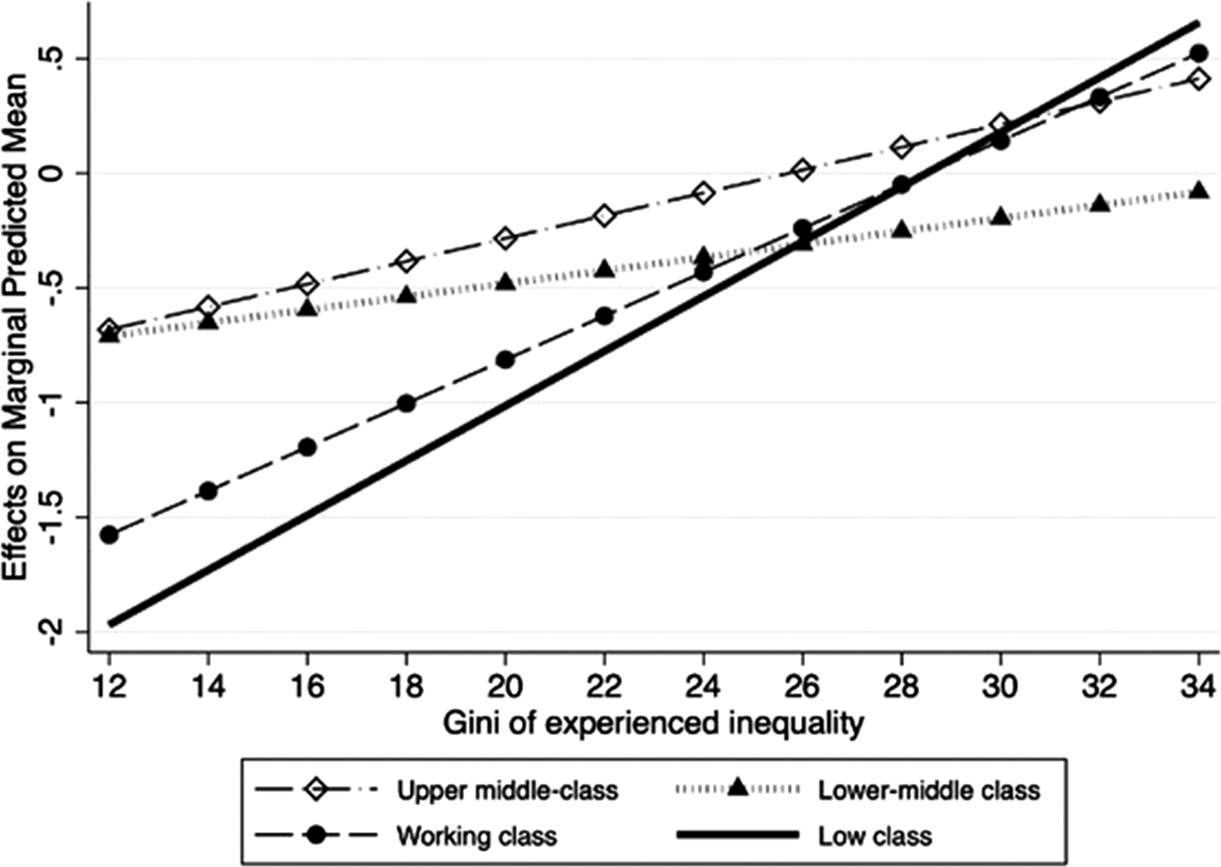
Figure 3 illustrates visually how inequality tolerance among the four African classes (that is, excluding the high class which is our reference category) grows as the value of experienced inequality increases, keeping all other covariates at their mean values. Note the steep upward trajectories of the working class and lowest class lines in Figure 3. Although not shown visually, the African responses contrast markedly with the rest of the sample, suggesting that the tunnel effect is more pronounced in the African context of modernization typified by the relatively large contribution of natural resource rents to GDP.
How inequality tolerance increases across four African classes with increasing experienced inequality (average marginal effects).
Source: Own calculations, based on World Values Surveys, waves 4, 5 & 6. Based on regression model reported in column 1.2, Table 1 in Appendix A.
The role of religion
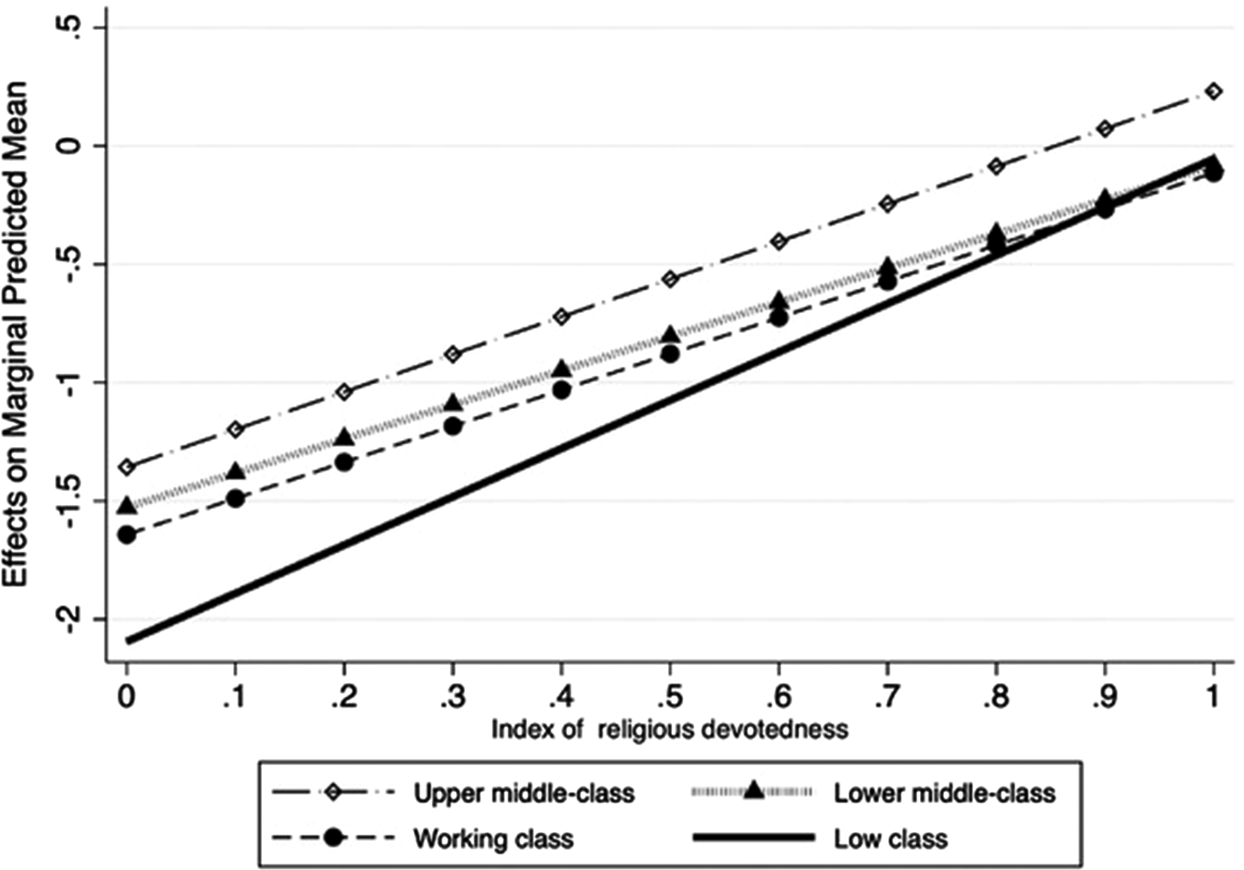
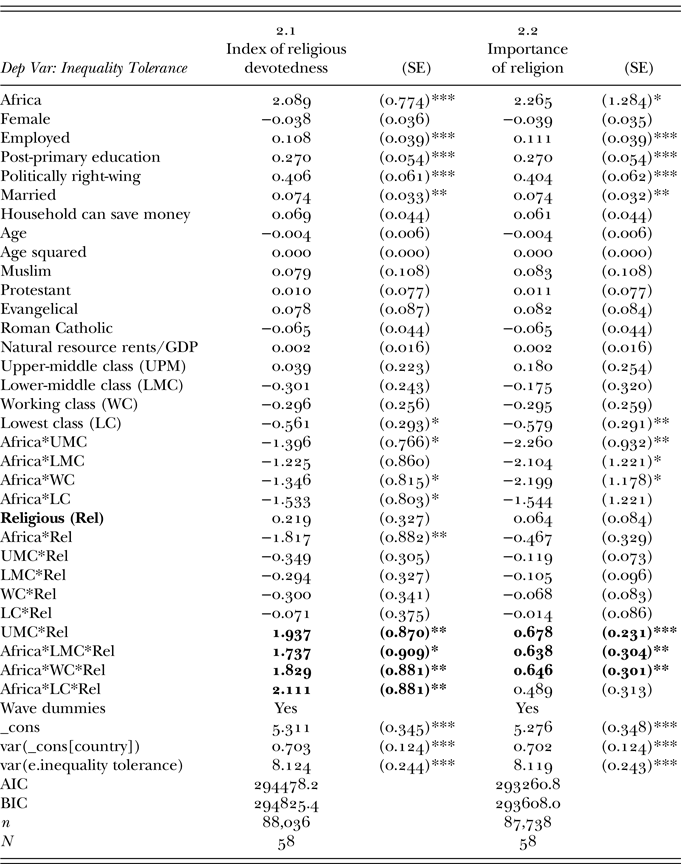
Religion, as we saw in the second section, has been proposed as one of the factors that could make respondents more tolerant of inequality, and to compensate for life's disappointments. The WVS provides us with three measures of religious devotedness: a question in answer to which the respondent has to indicate if she is a religious person or not; a question in which respondents have to indicate how important religion is in their life; and a question on how often a respondent observes/participates in religious services and ceremonies. Following but reversing Welzel's ‘disbelief’ index, I combine answers to form an additive mean-response index, scaled from 0 to 1.Footnote 8 This measure is called a measure of religious devotedness and is used in column 2.1 in Table II to test for the effect of religion on inequality tolerance, again controlling for the covariates used in Table I. I do add dummies for each of four important religious groups in Africa, namely Muslims, Protestants, Evangelicals and Roman Catholics. The results of importance are again highlighted in bold in Table II. It is clear that religious devotedness plays an important and significant role in the inequality tolerance levels of all four classes here contrasted with the reference category, namely the high class. Figure 4 proceeds to trace the marginal effect of religious devotedness, distinguishing between the low class, the working class, and the two middle class groups. As can be seen, religious devotedness has the strongest effect in the case of the lowest class, although the effect is also large and significant in the three other African classes. None of the religious denomination dummies are significant, and it is only Roman Catholicism that has a negative relationship with inequality tolerance, but the effect is not significant.
How inequality tolerance increases across four African classes with increasing religious devotedness (average marginal effects).
Source: Based on regression model in column 2.1, Table 2 in Appendix A, using data from World Values Surveys waves 4, 5 & 6. Index of religious devotedness is discussed in the text.

Religious practice, here measured in terms of how often respondents participate in services and communal prayers, may not necessarily be a good predictor of devotedness. Individuals may feel socially pressured to attend services and prayers, without necessarily sharing fully in the belief component of religion (Joshanloo & Weijers Reference Joshanloo and Weijers2016). To cater for this eventuality, the regression in column 2.2 in Table II tests specifically for the importance of religious belief in the respondent's life, that is, the second question incorporated into the devotedness index. Somewhat surprisingly, religious belief does increase inequality tolerance but it has less of an influence in the case of the lowest class than it has in the case of the working class and the two middle-class groups where the tolerance-enhancing effect is significant.
To conclude this section, note that all of the individual control covariates behave as one would expect. It is surprising, though, that the effect in the case of ‘female’ is not larger and more significant. In survey-based analyses of inequality and redistribution preferences in industrialised countries, female respondents are consistently and significantly more opposed to inequality and in favour of income redistribution (see Lierse 2018, for example). Second, it is also surprising that age and its squared version has no significant effect, given the significant non-linear effect that others have detected in this regard (see Choi Reference Choi2019, for example). It would seem that gender and age are both less significant predictors of inequality tolerance in Africa and comparable countries.
CONCLUSIONS
We set out to explain why Africans on average are so much more tolerant of inequality than respondents in other comparable countries. Two sets of explanations emerge. There is credible evidence that the expectation of upward mobility under conditions of experienced inequality, as foreseen by Hirschman and as documented by Lloyd in the case of young Yoruba males, applies generally among Africans. In contrast, economic growth as such seems to kindle expectations of upward mobility only among the upper-middle class. These findings provide credibility to Ray's general comment that ‘(t)he fact that uneven growth can both raise our ambitions and unleash our frustrations should be fundamental to our understanding of economic development’ (Ray Reference Ray2010: 57).
We have also presented evidence that, independently of the above, religious devotedness also contributes to tolerance of inequality, across different self-identified classes in Africa, excluding the high class. Again there is a noticeable contrast between African and non-African respondents in our sample. It is religious belief, rather than participation in religious practices, that has the biggest and most widespread effect. This testifies to the role of religious belief to normalise and legitimise the status quo as in some way or other reflecting the will of a benign supernatural being.
None of these findings should be interpreted to mean that Africans are not decent people, or that they do not care about altruism, sharing and cooperation. In fact, when asked in WVS surveys to name attributes that they would like their children to have, Africans are 13% more likely than respondents from the rest of our sample of developing and transition countries to name altruism as a preferred attribute. However, given specific developmental and institutional reasons, amongst others the prevalence of uneven growth and the resultant high levels of experienced inequality, Africans are more prone than others to tolerate income inequality. It was impossible to explore all of these developmental and institutional reasons here, and there is scope for more research on how religion and the tunnel effect interact with the specific post-colonial institutional features of African societies to shape inequality attitudes.
Why should we care about inequality attitudes in Africa? It is quite likely, I venture to suggest, that one of the contributing reasons why income (and wealth) inequality is so persistent in Africa is that there is more inequality tolerance than one would expect. This tolerance reduces pressure on African decision makers to implement the type of redistributive measures required to mitigate unequal income levels and access to resources (such as land). Herein lies an important clue to explaining the persistence of high inequality on the continent of Africa, and also in those countries that have taken important steps to consolidate democratic participation in recent years. The fact that democratisation has not led to significant redistribution (Bratton & Van de Walle Reference Bratton and Van de Walle1997; Van de Walle Reference Van de Walle2009) is not due exclusively to the incompleteness or deficiency of governmental institutions. It might well be that the policy processes and institutional arrangements do indeed capture voter attitudes, but that these attitudes are more tolerant of inequality than is commonly assumed. This could be an explanation of the ‘Robin Hood’ paradox (Lindert Reference Lindert2004) as it applies to Africa: states that need redistribution the most get less of it than they should because their voters (and political leaders) do not care sufficiently about inequality.
Appendix A
Testing for the tunnel effect

Religion and Inequality Tolerance

Appendix B
Countries, Waves, Respondents