1. Introduction
The subprime mortgage crisis had wide-ranging effects on the American economy (e.g., Mian et al., Reference Mian, Sufi and Trebbi2015) and, like other large-scale economic crises in the past, has led many to speculate about its role in subsequent political upheaval and the rise of populism in American politics and across the world. A Fox News opinion piece, for example, recently declared that “poor access to housing in America, and the lingering aftereffects of the 2008 housing crash, remains a chief motivator of anger and dissatisfaction amongst an electorate that views the economy and the mortgage market as rigged against ordinary people.”Footnote 1 Did the Americans most affected by the housing crash—those whose homes were foreclosed, and those who live in areas where foreclosures were most prevalent—punish incumbents electorally? Has the economic hardship they experienced during and after the Great Recession activated them, politically? These questions are important because democratic accountability relies in large part on voters translating their lived experiences into political action, whether it be to reward current officeholders at the ballot box for positive outcomes or to punish them for negatives ones. We study these key questions in this paper, focusing on the role of economic distress and its effects on elections.
We use nationwide public records data on individual home foreclosures, combined with county-level election data for the US House, Senate, and President, to study the effects of severe forms of economic distress on electoral outcomes. We also use administrative data on all registered voters in the state of Ohio, which allows us to link home foreclosures to individual voter records to examine effects on turnout.Footnote 2 To address concerns that the people and places where foreclosures are more likely to occur are unlike the people and places where they are less likely to occur, we employ a series of difference-in-differences designs comparing over-time changes in electoral outcomes and foreclosure rates.
We find precisely estimated null effects on county-level vote share outcomes. In general, increases in local foreclosure rates do not lead the incumbent party to perform worse electorally. This is true for both presidential and legislative elections, and it is true whether we consider two-year shifts in foreclosure rates or whether we zoom in on foreclosures in the last six months before the election.Footnote 3 Also, we find small but detectable decreases in the propensity to turn out to vote after a home foreclosure.Footnote 4 Rather than mobilizing disaffected individuals, economic hardship from the housing crisis appears to have discouraged individuals from participating in politics, on average.
However, follow-up analyses suggest that the effect of economic distress on elections are substantial in rare cases. Specifically, we find large effects in 2016 when Donald Trump offered a populist departure from the conventional economic policies of both the Democrats and Republicans. Although for one particular election we cannot definitively establish a particular mechanism, we consider this evidence in favor of what we call the “Stigler hypothesis,” after Stigler's (Reference Stigler1973) claim that, since the parties generally offer the same economic policies there is no reason for economically affected individuals to change votes or to become more politically active.Footnote 5 These findings are also consistent with recent study that suggests that, in the United States, adverse economic conditions lead to support for extremists (Autor et al., Reference Autor, Dorn, Hanson and Majlesi2016a, Reference Autor, Dorn, Hanson and Majlesi2016b), and for right-wing populist parties across Europe (e.g., Malgouyres, Reference Malgouyres2017; Dehdari, Reference Dehdari2018). These findings also comport to some degree with Healy and Lenz (Reference Healy and Lenz2017), which uses zipcode-level mortgage delinquencies in California and relates these to changes in support for the Democratic presidential candidate between 2004 and 2008, finding marked increases in support for Obama in places where the housing crisis was more severe, perhaps in part because Obama represented an important—if less dramatic than Trump—break from the two parties’ previous economic platforms. In the Supplementary Appendix, we replicate the California finding from Healy and Lenz (Reference Healy and Lenz2017); if we zoom in on California in the years 2004 and 2008, we, too, find a modest but positive link between foreclosures and changes in support toward Obama. Although Healy and Lenz (Reference Healy and Lenz2017) also find a general relationship between local economic conditions and incumbent vote share, their estimates are substantively very small. Similarly, we find null results when we look beyond California 2004–2008, again suggesting that the effects are only present in rare circumstances. In the Supplementary Appendix, we provide a set of analyses to help unify our study and Healy and Lenz (Reference Healy and Lenz2017).Footnote 6
Finally, this paper contributes to a growing body of literature that seeks to distinguish between economic and cultural explanations for voting behavior in the 2016 election. Economic arguments focus on the role of economic distress or insecurity to explain Trump support (e.g., Autor et al., Reference Autor, Dorn, Hanson and Majlesi2016b; Healy and Lenz, Reference Healy and Lenz2017). Racial or cultural arguments, meanwhile, suggest that negative reactions to progressive value change (Inglehart and Norris, Reference Inglehart and Norris2016), status threat (Mutz, Reference Mutz2018), racial resentment (Hochschild, Reference Hochschild2018), or rural identity politics (Cramer, Reference Cramer2016) might explain the shift toward Trump. We stress that these explanations need not be mutually exclusive. In fact, Donald Trump made appeals both to working-class concerns and white identity in the 2016 campaign, where economic concerns are activated in conjunction with racial grievances (McCall and Orloff, Reference McCall and Orloff2017). Given this, and our expectation that different groups of voters will weigh these factors differently (Green and McElwee, Reference Green and McElwee2019), we should be hesitant to ascribe either explanation as being the sole cause of increased Trump support. Nonetheless, in this paper we do find that counties experiencing greater economic distress shifted toward Trump at higher rates, suggesting that the 2016 election may have been an uncommon case where the effects of adverse economic conditions on incumbent party performance were substantial.
2. Studying the effects of economic distress on voting
Our data on home foreclosures comes from CoreLogic, a company that compiles information on the housing market culled from public records. The dataset covers foreclosures in the years 2000–2017. After limiting our attention only to deeds held by individuals, we define a foreclosure as any deed that is recorded as entering into a foreclosure, marked in varying cases by a real-estate owned transfer or sale, or by a variety of foreclosure certificates. We do not count a property as foreclosed based on pre-foreclosure events like notices of default or lis pendens. The Supplementary Appendix provides detailed information on how we process the CoreLogic data. The CoreLogic data cover of about 90 percent of all US counties, and in the Supplementary Appendix we discuss reasons to believe that our results generalize to the full set of US counties. In particular, Table A.6 shows that CoreLogic counties look just like the full set of US counties in terms of important variables such as median household income, education, and unemployment.
The events leading up to the Great Recession are well known. Starting in 2007, a large number of home owners defaulted on their mortgages, triggering the failure of several mortgage originators and high-profile financial institutions. During the subprime crisis, foreclosure rates skyrocketed. Figure 1 plots the national and state-by-state average foreclosure rates per 1000 people over time. The years 2007–2009 saw an unprecedented spike in foreclosures, with especially dramatic increases in Nevada and Arizona, but with increases in many other states as well.
US home foreclosures over time, CoreLogic counties. The left panel shows the national home foreclosure rate over time; the right panel shows the foreclosure rate by state. Both are measured using CoreLogic data, which cover roughly 90 percent of US counties, so trends and state levels may vary slightly from nationwide foreclosure data.

These foreclosures had tremendous consequences. Individuals who experience foreclosure obviously experience significant economic distress, both in the lead-up to foreclosure and in its aftermath. But foreclosures also have substantial spillover effects on local economies. Mian et al. (Reference Mian, Sufi and Trebbi2015) estimate that foreclosures lead to substantial decreases in home prices, residential investment, and consumer demand at the local level. By studying the effects of foreclosures on political behavior, we are therefore able to study two closely related issues. First, we can study the local effects of economic distress on aggregated vote choice. Here, foreclosures operate as a proxy for economic downturns that local areas experience. Foreclosures on their own do not affect nearly a large enough number of people to change overall electoral outcomes. If foreclosures drive aggregate political outcomes, it likely depends on the more widespread economic effects that foreclosures catalyze. We use foreclosures rather than unemployment or local wages because they are a more appropriate proxy for severe forms of economic distress in a locality, which is the key independent variable we seek to measure in this paper.
Second, within counties, by studying foreclosures we can estimate individual-level effects of economic distress on voter participation. As discussed above, foreclosures on their own likely do not affect a large enough number of people to change overall election outcomes. But their effects on participation at an individual level identify one possible mechanism for the overall non-effects of foreclosures on aggregated election outcomes. Even if individuals with the most severe forms of economic distress—those whose homes were foreclosed on—might have the most reason to vote against incumbent officeholders, they also become much less likely to participate, on average. We believe this offers a partial explanation for the generally muted overall effects of foreclosures on elections.
For the aggregate analysis on vote share, we sum up the total number of individual foreclosures in a given county in each year, and we divide by the county's population in that year, as estimated from the Census. We linearly interpolate county population for non-Census years. We then take the average foreclosure rate within an electoral cycle—a four-year period, when we study presidential elections, and a two-year period, when we study legislative elections (House and Senate).Footnote 7 This information is then merged, by county and election period, with data on county-level vote share for these offices, which comes primarily from Dave Leip's Atlas of US Presidential Elections.Footnote 8
Table 1 presents descriptive statistics for these county-level datasets. Panel A covers the presidential elections dataset, where each time period is a four-year presidential term; panel B covers the legislative elections dataset, where each time period is a two-year congressional term. In addition to raw means, the panels also show population-weighted means, which accounts for the well-known fact that Republicans dominate the low-population rural counties of the United States whereas Democrats dominate the high-population urban counties.
Descriptive statistics, county level, 2004–2016

Note: Panel A presents descriptive statistics for the merged dataset on presidential elections. In this panel, every observation is a county within a four-year presidential election period. Panel B presents descriptive statistics for the merged dataset on legislative elections. In this panel, every observation is a county within a two-year congressional election period. The foreclosure rate is calculated as the mean of annual total foreclosures divided by county population in thousands of people, where the mean is computed over the relevant time period (either the four-year presidential term of the two-year congressional term). Vote percentages are the Democratic percentage of the two-party vote in a given county. County population is linearly interpolated for non-Census years. The second column provides means that are weighted by county population.
On average, counties experience 1.27–1.29 foreclosures for every 1000 people (column 1, panels A and B). As column 2 shows, these averages go up when we weight by population—foreclosures are somewhat more common in more populous, urban areas. As these numbers show, foreclosed individuals are a small fraction of the population, an important fact when considering potential electoral effects at the aggregate level. Foreclosure rates run from a minimum of 0—in certain low population counties—to a maximum of 19.97 over a four-year period (panel A). This maximum value comes from Archuleta County, Colorado, over the four-year period from 2008 to 2012. When we zoom in on two-year periods in panel B, we find an even higher maximum (21.94 foreclosures per 1000 people), which reflects Archuleta County in the period 2010–2012.
Panel A also shows average Democratic presidential vote share. Columns 1 and 2 show the urban–rural divide quite clearly. The raw average Democratic vote share is less than 40 percent; but when we weight by county population, this average increases to over 50 percent. We see the same phenomenon for the US House and Senate elections in panel B. House and Senate elections, as panel B shows, include cases where the Democrats received 0–100 percent of the vote—these are uncontested races.
For the individual analysis on voter turnout, we focus on the state of Ohio. Ohio is a good test case because it is a closely contested state, electorally, which also happens to offer administrative data on individual voter turnout at no cost. We obtained the Ohio voter file from the Ohio Secretary of State website, and we joined it to CoreLogic's individual-level foreclosure data using the full name and county of each individual. The voter file provides three important pieces of information. First, anyone who appears in the voter file is, by definition, registered to vote. Second, the voter file shows who, among registered voters, actually turns out to vote in each election. Third, the voter file records the individual's party registration. Ohio determines an individual's political party based on which party's ballot they request in the most recent primary election for which they turned out to vote. Therefore, party registrants in our study are all voters who cast a ballot in a primary election in Ohio.
In studying the voter file, we face a difficult post-treatment problem. Individuals only appear in the voter file when and if they register to vote, but the choice to register could itself be influenced by home foreclosure. If we study the effect of foreclosures only for the set of people who choose to register, we risk missing many people who either (a) experienced foreclosure, but did not register to vote, and so did not turnout or (b) did not experience foreclosure and did not register to vote, and so did not turnout. We address this issue in two ways. First, we include anyone from the CoreLogic data who experiences foreclosure, whether or not they appear in the voter file; anyone who does not appear in the voter file is recorded as not turning out to vote, as are any individuals who register to vote but do not turn out. This ensures that we do not eliminate people who were foreclosed on but did not vote. Second, we also perform analyses where we include only people who were registered to vote before the period of our study—thus avoiding post-treatment issues. In particular, for these analyses, we study only people who registered to vote in 2003 or earlier.
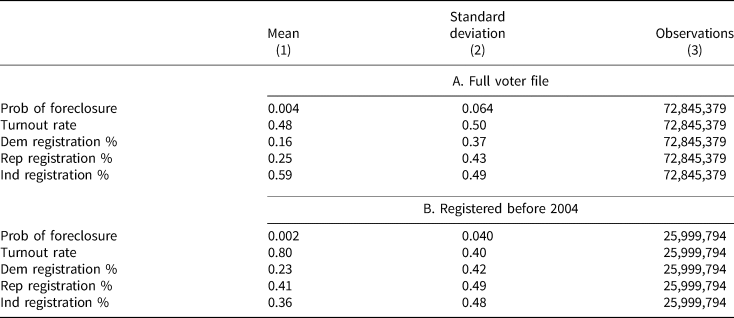
Table 2 presents summary statistics for this individual-level analysis. Panel A provides these statistics for the full voter file + CoreLogic dataset, whereas panel B provides them for the set of people registered to vote before 2004 (we do not provide minimums or maximums in this table because all variables run from 0 to 1). In both panels, the unit of analysis is the individual-year. The probability that any individual is foreclosed on in any given year is 0.004, in the full dataset, and 0.002 among people registered to vote before 2004—this makes sense since we have reasons to suspect that long-time registered voters are relatively more affluent than non-voters or non-habitual voters (Verba et al., Reference Verba, Schlozman and Brady1995).
Descriptive statistics, individual level, Ohio, 2004–2016

Note: Panel A presents summary statistics for all individuals who appear either in Ohio's voter file or in the Ohio foreclosure records. Panel B presents these same summary statistics only for individuals who registered to vote prior to the timeframe of our study. The unit of analysis for all rows is an individual-year pair. An individual is marked as foreclosed on if she experienced at least one foreclosure at any time in the year up to the election date in early November. Turnout rate is measured as the percentage of all individuals in the dataset who are marked as turning out in the general election. Dem, Rep, and Ind registration percentages are calculated using party registration as provided in the Ohio voter file, and reflect the proportion of registered voters who register with each party. A negligible number of Ohio voters register for third parties. The number of observations in panel A is slightly larger for foreclosures and turnout rate than for the party registration variables because we include foreclosed individuals who do not register to vote. These individuals are not included in panel B, so all sample sizes in panel B are equal.
The second row of each panel shows the turnout rate. Among the full dataset, 48 percent of person-year observations show that the individual turns out to vote (panel A). This rate is substantially higher among long-time registered voters (panel B), as we might expect. The final three rows of each panel show the breakdown of party registration, among registered voters. The majority of registered voters do not affiliate with a party (panel A), but the majority of long-time registered voters do (panel B). Among both sets of people, Republican registration is significantly more common than Democratic registration.
3. Electoral non-effects of economic distress
We first estimate the effects of economic distress on incumbent vote share at the county level. Specifically, we estimate equations of the form

where Dem Vote Pct it measures the Democratic candidate's percentage of the two-party vote in county i at time t, running from 0 to 100. The variable Foreclosures it measures total foreclosures per capita in county i during the period from the last election to the election at time t. This variable is also interacted with Dem Inc it, which takes the value 1 when the Democratic party held the office in the previous cycle and −1 when the Republican party held it. Finally, γ i and δ t stand in for county and year fixed effects, respectively. In many specifications, δ t is made more flexible, either using state-by-year fixed effects or population decile-by-year fixed effects. For many cases, including when studying the presidency, the main effect on Dem Inc it is omitted because it is absorbed by the time fixed effects.
Given that we want to study how foreclosures affect incumbent performance, it might seem more logical to use incumbent party vote share, rather than Democratic party vote share, as our dependent variable. This would allow us to forego the interaction term between foreclosures and Democratic incumbency. However, it seems unlikely that counties trend in terms of their general support for incumbents, and far more likely that they might trend in terms of their partisanship. As such, it makes more sense to use the interactive specification with Democratic vote share as the dependent variable, so that we can account for these trends directly. The main quantity of interest is therefore the interaction between foreclosures and the incumbent party variable.
3.1 Evaluating the parallel trends assumption
As the above specification makes clear, the analysis is a difference-in-differences design in which we compare within-county changes in incumbent and non-incumbent party vote shares over time across within-county changes in home foreclosures. For the resulting estimate to be causal, the trends in vote share in counties with smaller increases (or decreases) in foreclosures must provide valid counterfactuals for the trends we would have observed in counties with larger increases (or decreases) in foreclosures, had these counties instead had smaller increases (or decreases). The main advantage of the difference-in-differences design is that we can employ a variety of strategies to get a sense of whether the parallel trends assumption might be satisfied. We evaluate the parallel trends assumption in two ways. First, we can relax the assumption of parallel trends by altering the set of fixed effects in a variety of ways and see if the results change (e.g., Bilinski and Hatfield, Reference Bilinski and Hatfield2019). Below, we show results across a range of specifications, and the results do not change meaningfully. We interpret this as suggestive, albeit indirect, evidence that the parallel trends assumption might be satisfied in our case.
Second, we can add leads of the foreclosure rate variable to see if future foreclosures affect current presidential vote share. Finding a large coefficient on this lead would suggest there might be pre-trending. To carry out this test, we code a foreclosure rate lead variable, which takes the value the county's foreclosure rate in time t + 1. We show these results in Section A.3 of the Supplementary Appendix. We find the coefficients on these leads are small, again suggesting that the parallel trends assumption might hold in our case.
Finally, we can evaluate the plausibility of the parallel trends assumption in substantive terms. We know that counties that experienced large increases in foreclosures throughout the financial crisis tended to be in urban or suburban counties with high populations, which also happen to be the types of counties that become increasingly Democratic over time. Given that, we might be worried that our main difference-in-differences estimates would be biased upward—meaning counties with small increases in foreclosures, which are often rural, might be trending toward the Democratic party at slower rate than (often urban) counties with large increases in foreclosures, in ways that are unrelated to their experiences of economic distress. To address this concern, in our main results we also include specifications that only make counterfactual comparisons within sets of similarly populous counties. Our results do not change meaningfully in these specifications, which suggests that this substantive source of bias is likely to be small. Overall, we interpret this as reassuring evidence that the parallel trends assumption might be satisfied.
3.2 Electoral non-effects of foreclosures
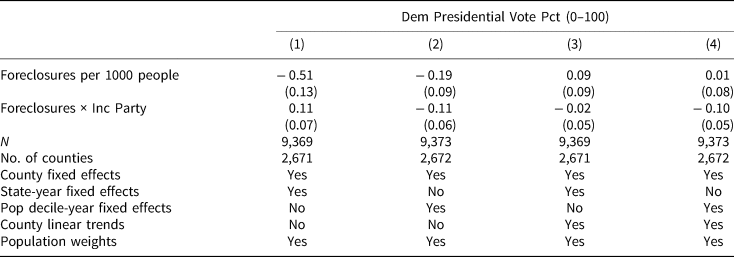
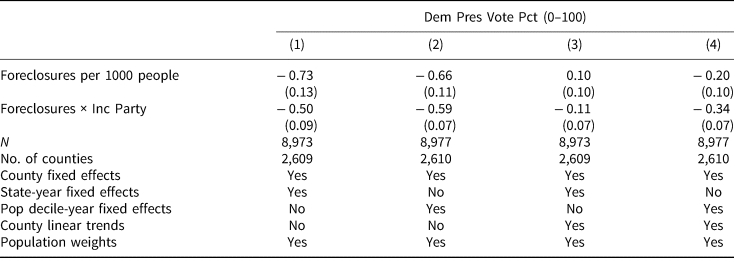
Table 3 presents the estimates for four possible specifications, and we weight each of the estimates using county population weights. The first column is the most simple, in which we use county fixed effects and state-by-year fixed effects—implicitly doing a separate difference-in-differences for each state and averaging the estimates together. Here we find a substantively small, but not statistically significant, benefit to the incumbent party in presidential elections when a county suffers more foreclosures. Specifically, an increase of one foreclosure for every 1000 people in the county is estimated to increase the incumbent party's presidential vote share by roughly a tenth of a percentage-point. Put another way, it is estimated to take an increase of 10 foreclosures per 1000 people to move the incumbent party's vote share by a full percentage-point—roughly 7 standard deviations in the foreclosure rate variable, and about 10 standard deviations in the county-demeaned foreclosure rate variable (see Table 1).
Effects of housing foreclosures on Presidential elections, county level, 2004–2016

Standard errors generated from 1000 iterations of a county-level block bootstrap procedure. Inc Party is 1 for Dem, − 1 for Rep. Main effect for Inc Party is absorbed by fixed effects.
We have reasons to be skeptical of this specification. The state-year fixed effects mean that we compare the changes over time in counties with more foreclosures to the changes over time in counties with fewer foreclosures in the same state. These counties may not give us the best counterfactual trend. Counties that experienced big spikes in foreclosures tend to be urban or suburban counties with high populations—the same types of counties that have become increasingly Democratic over this same time period. As such, it might be better to use similarly populous counties as counterfactuals, even if they are in different states. We do this in column 2, where we create fixed effects for every population decile-year. That is, we chunk cities into deciles based on their population as of 2003 (before the treatment window), and we create year fixed effects within each population decile, so that our difference-in-differences counterfactual trends come from counties in the same population decile who vary in their foreclosure rates over time. When we do this, the estimates are again substantively small. As column 2 shows, we now estimate that an increase of 1 foreclosure per 1000 people in a county decreases incumbent vote share by about 0.11 percentage points, or 11 basis points. In this specification, it would take an increase of almost 10 foreclosures per 1000 people to swing incumbent vote share by a full percentage point—an increase that spans over half of the entire range of the data, where foreclosures per 1000 people range from 0 to roughly 19.
Besides being substantively tiny, this null result is relatively precisely estimated. The 95 percent confidence interval for this estimate ranges from roughly − 0.23 to + 0.01, which mean we can reject any substantively meaningful relationship between changes in foreclosure rates and changes in incumbent electoral support.
The remaining specifications explore the robustness of this null result. We include county-specific linear time trends, and in the Supplementary Appendix we also explore differences in the results when we do not weight by county population (see Table A.9). In all cases, we continue to find precisely estimated, substantively small effects.Footnote 9
3.3 Using a lagged dependent variable approach
The main results in our paper come from the difference-in-differences framework. We prefer the difference-in-differences framework to a lagged dependent variable setup because, as we show in the previous section, we can offer a range of tests to interrogate its key identifying assumption, parallel trends. Moreover, we know that the lagged dependent variable approach is biased when parallel trends, the difference-in-differences assumption, is met (Angrist and Pischke, Reference Angrist and Pischke2009)—and, as we have just discussed, we have reasons to believe the parallel trends assumption could be met in this case. Nonetheless, both strategies require assumptions and neither is a silver bullet, so it is informative to look at estimates from both designs.
Following Angrist and Pischke (Reference Angrist and Pischke2009) and Ding and Li (Reference Ding and Li2019) we can use a lagged dependent variable approach to bracket the true effect, if we assume that one of the two designs’ identifying assumption is correct. We show these estimates in Section A.2 of the Supplementary Appendix.
The two foreclosures estimates give us the most extreme estimates in either direction, positive and negative; as such, using the bracketing principle, we can offer an estimated effect range from − 0.33 to 0.11, where again these are effects on incumbent vote share from increasing the foreclosure rate per 1000 people by 1. Taking the largest estimated decline in incumbent vote share of − 0.33, it would take an increase of about 3 foreclosures per 1000 people to move the presidential vote share by one percentage point. Because an increase of 3 foreclosures per 1000 people represents larger than a 3 standard deviation increase in the county-demeaned foreclosure rate, this suggests to us that the link between local economic conditions and incumbent electoral fortunes is in general very modest, if it exists.
3.4 Evidence for a “Trump effect” of economic distress
Why don't foreclosures alter localities’ aggregated vote choices? One possibility is that voters don't react to foreclosures in their area by altering their support for one party or the other because the parties’ positions on policies related to the housing market and to financial regulation are relatively similar, most of the time. One way to investigate this possibility, although it is crude, is to see whether effects seem to be different in the 2016 election. Donald Trump deviated sharply from policy positions traditionally held by both parties, particularly related to free trade, infrastructure spending, student loans, and other economic issues that voters might care about. Whether any of these issues is linked to home foreclosures specifically is unclear, but as we have mentioned earlier, upticks in home foreclosures in an area are likely signs of other forms of economic distress. Trump's overall separation on economic policy might make the 2016 election different from previous ones.
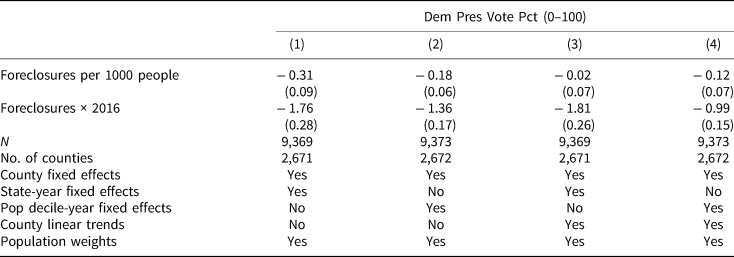
In Table 4, we reestimate the effects adding an interaction of the foreclosures variable with a dummy variable for the 2016 election cycle. The results suggest that Trump benefited from foreclosures, electorally. Across specifications, an increase of 1 foreclosure per 1000 people is estimated to decrease the Democratic vote share (the Clinton vote share) by 0.99–1.81 percentage points more in 2016 than in past few years (this is the range of the interaction coefficient estimates, not their confidence intervals). We should note, however, that these effects are smaller when we do not weight by county population (see Table A.10). The larger effects in the weighted specifications suggest that, if foreclosures led voters to punish Clinton (and the incumbent Democratic party), and to reward Trump, this behavior was concentrated in more populous counties.
Effects of housing foreclosures on presidential elections, county level, 2004–2016: testing for Trump-–Clinton effects

Standard errors generated from 1000 iterations of a county-level block bootstrap procedure. Main effect for 2016 is absorbed by fixed effects.
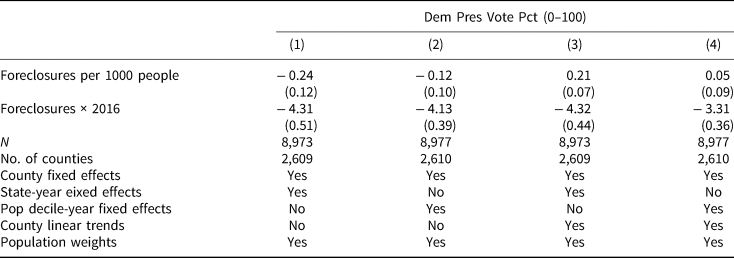
The timing of foreclosures might also influence voters’ responsiveness to economic performance. To construct our foreclosure rate measure, we take the average foreclosure rate within an electoral cycle. It could be, however, that voters are myopic in their evaluation of incumbents, considering only economic circumstances in the time leading up to the election. Accordingly, in Table 5 we consider the effects of recent foreclosures on the 2016 election, where the foreclosures variable is the foreclosure rate in the six months leading up to election day, instead of over the past election cycle like in the main analysis before. Here, we again find effects of recent housing foreclosures on the Democratic vote share in 2016. An increase of 1 foreclosure per 1000 people in the last six months before the election is estimated to decrease the Democratic vote share by 3.31–4.32 percentage points more in 2016 than in previous years. Because our main goal is to test for the effects of the foreclosure crisis on elections, we prefer using the foreclosure rate from the entire electoral cycle, as we do in Tables 3 and 4, but it is notable that the Trump-specific effects hold whether we look at the foreclosure rates from the entire electoral cycle or only the foreclosure rates from the few months leading up to the election.
Effects of recent housing foreclosures on presidential elections, county level, 2004–2016: testing for Trump–Clinton effects

Standard errors generated from 1000 iterations of a county-level block bootstrap procedure. Main effect for 2016 is absorbed by fixed effects.
It is difficult to be confident in the identification of these effects, relying as they do on changes for one election period, but they are at least suggestive. Voters may rarely switch parties or punish incumbents in response to personal economic distress not only because they do not care about politics, but also because most of the time the two parties offer relatively similar economic policies. However, the results, particularly the effects of foreclosures in the six months before the election, provide suggestive evidence in favor of this claim in 2016, perhaps because of Trump's populist appeal.
4. Home foreclosures reduce individual turnout
So far, we have documented overall non-effects of foreclosures on election outcomes, with one exception being the 2016 presidential election. What explains these overall non-effects? The economic voting literature often suggests that those who benefit economically will reward their incumbent officeholders, whereas those whose economic prospects weaken will punish incumbents at the ballot box. For our aggregate analyses, however, we do not observe counties most affected by the foreclosure crisis systematically punishing incumbents.
To understand why we might observe overall non-effects, we zoom in to individuals in the entire state of Ohio to estimate how the experience of foreclosure affects individual turnout. The effects of individual-level foreclosures on turnout are not obvious ex ante. On the one hand, experiencing such a severe form of economic distress might particularly motivate individuals to participate in politics to hold elected officials accountable for their economic circumstances. On the other hand, foreclosures cause financial stress and many new obligations for those they affect. Foreclosed individuals have complicated financial situations to deal with, not to mention that they must find a new residence. More prosaically, simply being forced to change addresses may reduce their probability of registering to vote (e.g., Squire et al., Reference Squire, Wolfinger and Glass1987). Strains like these raise the opportunity cost of participating in politics, and might reduce participation as a result.
To estimate effects of foreclosure on individual voter turnout, we estimate equations of the form

where Turns Out it is a binary variable that takes the value 1 if individual i turned out to vote in the election at time t, and 0 otherwise. The variable Foreclosed it is an indicator for whether individual i experienced a foreclosure during election period t; γ i stands in for individual fixed effects, while δ t stands in for zip code-by-year fixed effects. In some specifications, we also add unit-specific linear time trends, and in some we include interactions of the Foreclosed variable with an indicator for party registration.
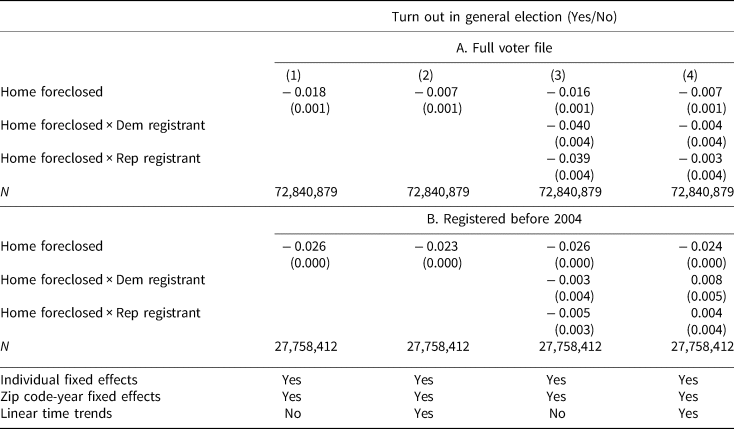
Table 6 presents the results. Panel A uses the full sample, whereas panel B uses only the individuals registered to vote before 2004, as discussed along with Table 2. In column 1 of panel A, we find a modest but highly precise negative estimate. Individuals who suffer foreclosure are less likely to turn out to vote—nearly 2 percentage-points. Interestingly, this estimate is quite similar to those in a previous study of residential mobility. Gay (Reference Gay2012) studies individuals who randomly received the opportunity to move out of public housing and into private apartments during the 1994 Moving to Opportunity for Fair Housing Demonstration Program. Experimental estimates of the effect of this opportunity on turnout suggest that it decreased turnout by roughly 2–4 percentage points. The similarity in our estimates further supports the idea that home foreclosures have generally not galvanized political activity; instead, foreclosures seem to affect individuals in much the same way other forms of residential mobility—even those that are the result of an intentional opt-in program and that are not associated with a political crisis—do. We find that this effect is similar when using only individuals registered before 2004: the estimated effect is about a 2.6 percentage point decrease in turnout in column 1 of panel B. In column 2 of both panels we include individual-specific linear time trends, and the result is attenuated slightly—but again remains negative and precisely estimated.
Difference-in-differences effects of housing foreclosures on individual turnout in Ohio, 2004–2016

Robust standard errors clustered by individual in parentheses. Each observation is a person-election year.
Although foreclosures seem to decrease individuals’ likelihood of voting overall, it could be that different types of affected individuals respond differently. For example, individuals who are already engaged in politics and have strong partisan attachments might be especially likely to link their foreclosure to public policy compared to voters who are either less engaged in politics or who have weak partisan attachments. To test this potential mechanism, we interact our foreclosure variable with party registration to see if Democrats, Republicans, and those who do not register with either party respond differently to the experience of economic distress. Again, here we face a difficult post-treatment issue, which is that in Ohio party registration is determined by the most recent partisan primary ballot that a voter requests. Because the measure of party registration is itself a measure of participation, we would not want to condition on a measure of party registration that happens post-treatment. To avoid post-treatment issues, we code party registration according to the party of which partisan ballot an individual requested in the 2000 presidential primary.
Column 3 shows the results by party registration. Foreclosures seem to lead to a decrease in turnout among those who did not register with a political party, about 1.6 percentage points in column 3 of panel A, but we also see a decrease among Democratic and Republican party registrants. Summing the coefficients in column 3 of panel A, foreclosures led to a decrease in turnout among Democratic and Republican party registrants of about 5.6 and 5.5 percentage points, respectively. In column 4, where we include person-specific linear time trends, the effect size shrinks to a 1.1 percentage point decrease and 1.0 percentage point decrease for Democrats and Republicans, respectively. Again, we see a similar pattern in panel B when subsetting only to those registered before our study window.
In sum, experiencing a home foreclosure makes an individual in Ohio less likely to turn out and vote, on average. This effect is very precisely estimated, which means we can certainly rule out positive effects. It does not appear to be true that, on average, home foreclosures galvanize individuals to participate in politics, in Ohio at least. Moreover, this effect holds for those who had previously participated in partisan primaries, who are likely more engaged in politics and have stronger partisan attachments than those who did not—and yet their turnout still decreases after experiencing foreclosure.
Why don't foreclosures galvanize people in general, the way some popular accounts have suggested they might? Foreclosures no doubt upset people, and the people who experience economic distress may have the greatest incentives to pay more attention to the political process, but they also cause financial stress and this may encourage them to become politically active, but they are also the people experiencing life events that reduce their ability or desire to spend time involved in politics. For these reasons, we should probably be skeptical of posited links between other forms of economic distress and individual political behavior.
5. Why don't foreclosures affect incumbents’ electoral fortunes, generally?
So far, we have shown that foreclosures do not have large effects on elections, and part of the reason could be that foreclosures reduce individuals’ likelihood of participating, on average. In this section, we consider a set of alternative explanations for the finding that, in general, foreclosures do not affect incumbent vote shares, paying careful attention to ones that might bias us toward finding null results. We conclude that none of these possibilities explains the results.
5.1 Foreclosure rates as a measure of economic distress
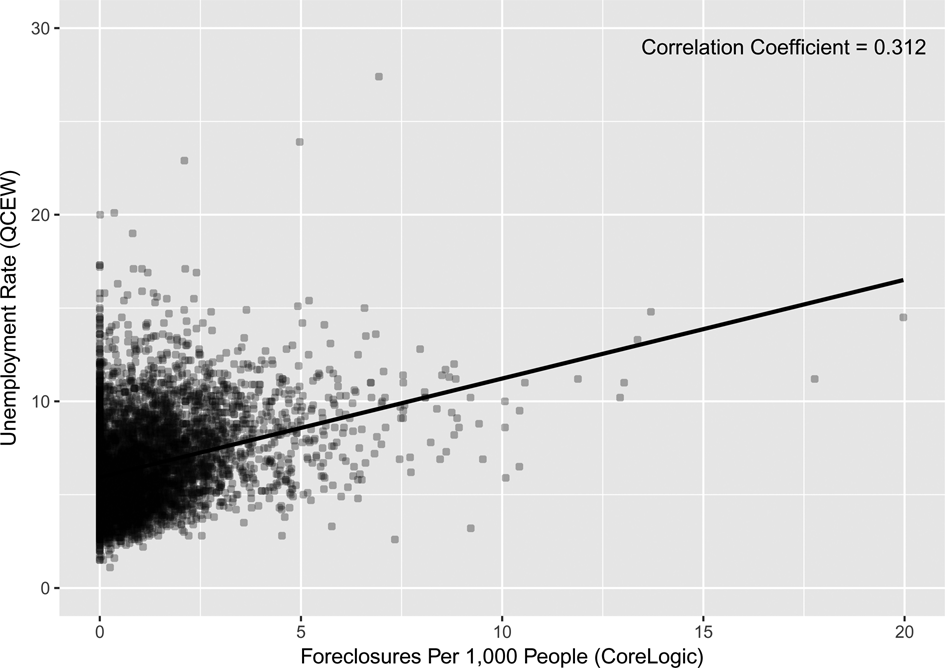
We use foreclosure rates as our treatment variable because we think it is the most natural proxy for a county's level of economic distress. To what extent do foreclosures characterize a county's general economy, though? To examine this, we correlate our foreclosure rate measure with other county-level economic indices (Figure 2). In line with our expectations, our CoreLogic foreclosure rate positively correlates with the unemployment rate from the Quarterly Census of Employment and Wages (QCEW). Moreover, the CoreLogic foreclosure rates in Figure 1 accord with accounts of which states were hit hardest by the recession (e.g., Yagan, Reference Yagan2016), and we use our data to replicate the result from Healy and Lenz (Reference Healy and Lenz2017) on the effects of the housing crisis in California (see the Supplementary Appendix). All of this suggests that our foreclosure rate measure gives a good sense of a county's general economy, in addition to being a more theoretically compelling measurement of our intended independent variable—economic distress in a county.
CoreLogic foreclosure rate validation we compare our foreclosure rate measure to the unemployment rate from the QCEW. Each point in the scatterplot represents a county-year observation. As expected, we observe a positive relationship.

5.2 Non-effects of economic distress in legislative elections
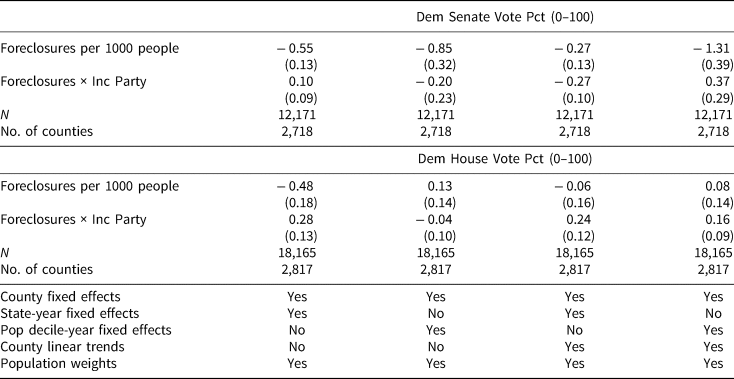
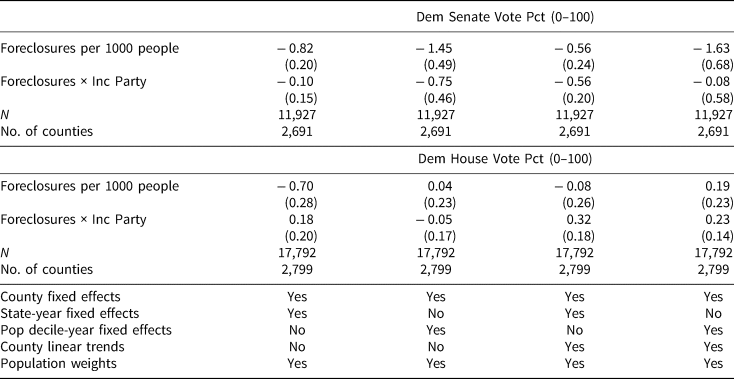
Second, it could be that voters attribute blame for adverse economic conditions to offices other than the president (de Benedictis-Kessner and Warshaw, Reference de Benedictis-Kessner and Warshaw2019). To explore this possibility, we examine effects of foreclosures on legislative elections. Table 7 presents the results for House and Senate elections, respectively, using the same specifications from Table 3. We continue to define party incumbency based on the presidency. In the interest of brevity, we do not walk through each individual estimate; but they are largely null. The only arguably large effects are for effects on Senate races in the last two columns and on House races in some columns. However, these estimates are primarily positive, not negative, which would indicate that incumbent party candidates may benefit, slightly, from an increase in foreclosures. In any case, these estimates are also still substantively very small.
Effects of housing foreclosures on legislative elections, county level, 2002–2016

Standard errors generated from 1000 iterations of a county-level block bootstrap procedure. Inc Party is 1 for Dem, − 1 for Rep. Main effect for Inc Party is absorbed by fixed effects.
5.3 Voter myopia and the timing of foreclosures
Third, as discussed earlier, the timing of foreclosures might affect voters’ responsiveness to economic performance. In Table 8, we consider the effects of recent foreclosures on presidential elections, where the foreclosures variable is the foreclosure rate in the six months leading up to election day, instead of over the past election cycle like in the main analysis before. Interestingly, the estimates range from − 0.59 to − 0.11, suggesting that an increase in foreclosures in the last six months before election day decreases incumbent vote share. However, as we showed in Table 5, this effect is particularly large for the 2016 election, and the estimates from this specification are all null when we do not include 2016.
Effects of recent housing foreclosures on presidential elections, county level, 2004–2016

Standard errors generated from 1000 iterations of a county-level block bootstrap procedure. Inc Party is 1 for Dem, − 1 for Rep. Main effect for Inc Party is absorbed by fixed effects.
Table 9 estimates the effect of recent foreclosures on House and Senate races. The results are null across most specifications. Although these estimates are somewhat less precise, we generally find no evidence of an effect of recent housing foreclosures on incumbent performance in House or Senate elections.
Effects of recent housing foreclosures on legislative elections, county level, 2002–2016

Standard errors generated from 1000 iterations of a county-level block bootstrap procedure. Inc Party is 1 for Dem, − 1 for Rep. Main effect for Inc Party is absorbed by fixed effects.
These analyses also raise a distinction between testing for the systematic effects of the foreclosure crisis, itself, versus testing theories of retrospective voting. Our main results on the electoral effects of foreclosures (Table 3) are designed to test the former, whereas the results for the effects of recent housing foreclosures might be better suited to test the latter. We focus primarily on the systematic effects of the foreclosure crisis—where issues of timing are not relevant—so for the main results we use all of the information on foreclosures in the election cycle. The timing of foreclosures is crucial, however, for testing theories of retrospective voting.
5.4 County size and economic perceptions
Fourth, it could be that the county economy does not reflect the experiences of the typical person in that county. If foreclosures are felt only by a small number of people in a large county, it might be difficult to pick up any effects of foreclosures on election outcomes. We do observe foreclosures at the individual level in the CoreLogic data, but we cannot observe vote choice at the individual level. In order to test for these effects on presidential elections in counties where the foreclosure rate might be a better measure of the typical person's experiences in that county, we subset the analysis to small counties, defined as those with a 2003 population at or below the median (Table A.7). We find null effects across all specifications. Similarly, we find no evidence that voters in small counties reward or punish House or Senate incumbents based on housing foreclosures (Table A.8).
5.5 Competitive counties
Finally, it is also possible that voters might not typically react to foreclosures because of strong ideological views and/or strong partisan loyalties. Even if historically voters did punish incumbents for a host of economic outcomes, polarization may have dulled this response in more recent elections. Although there is no perfect way to test this claim, we try to get at it indirectly by examining if the effects of foreclosures are different in counties that are more politically competitive—counties where voters, as a whole, have not consistently supported one party in the past. This is not a perfect test since a county might be competitive only because it contains partisan or ideological voters of each party in equal proportion, rather than containing more swing voters, but it is at least a possibility, and one which would be consistent with empirical research that suggests incumbents offer more moderate positions in more competitive places (Ansolabehere et al., Reference Ansolabehere, Snyder and Stewart2001). Specifically, we compute each county's “normal vote” as the average Democratic vote share for president in the county in all elections from 1972 to 2000 (thus avoiding any post-treatment issues). We then re-estimate the regressions from Table 3 focusing only on competitive districts, which we define to be districts where the normal vote is between 40 and 60 percent. As Table 10 shows, we continue to find null results. If even more politically competitive districts do not appear to punish incumbent party candidates for foreclosures, it seems less likely that the null results are driven by ideological voters or partisan loyalty.
Effects of housing foreclosures on presidential elections, county level, 2004–2016: including only competitive counties

Standard errors generated from 1000 iterations of a county-level block bootstrap procedure. Inc Party is 1 for Dem, − 1 for Rep. Main effect for Inc Party is absorbed by fixed effects.
5.6 Summary
In summary, looking across presidential, US House, and US Senate races, we do not find a systematic link between economic distress and the punishment of incumbents. Counties that have suffered disproportionate home foreclosures do not appear to have voted against incumbents at a different rate than counties experiencing fewer foreclosures. These null results are not the result of noise; in many cases we have very precise estimates which can rule out any substantively meaningful effects. The results hold when subsetting to counties with small populations, and when subsetting to electorally competitive counties. The only case where these results do not hold is when we consider only the effects of foreclosures in the six months before election day on presidential elections, and these estimates are particularly sensitive to the inclusion of the 2016 election. Despite the salience of home foreclosures, they do not seem to alter vote choices across localities in general.
6. Conclusion
The political aftermath of the Great Recession has raised a number of questions about the possible links between the housing crisis and electoral politics. In this paper, we report three relevant empirical patterns. First, local areas more affected by home foreclosures do not appear to have changed their voting patterns, in general. Second, one of the reasons for this lack of change may be that individuals are, if anything, less likely to participate in elections after experiencing foreclosure. And third, areas with more home foreclosures in 2016 appear to have voted for Trump at substantially higher rates, on average.
Together, these results suggest that localized economic hardship does not guarantee any sort of electoral backlash against incumbents—in the case of foreclosures, at least, such backlash is the exception rather than the rule. However, we find that backlash appears in a particularly salient case where a populist candidate stands for office and breaks with economic orthodoxy. Although these results are tentative, and should be explored further in future study, this finding suggests that to understand the links between economic distress and political behavior, it is important to consider the interplay of economic conditions, candidate responses, and voter behavior. In general, localized economic hardship may not affect observed electoral outcomes because candidates react and, in the case of policies like foreign trade, converge in the platforms they offer. But in cases where a new candidate emerges offering views sufficiently radical that establishment candidates cannot match them, there may be substantial effects of local economic conditions on electoral outcomes.
In addition to its substantive findings, our paper also adds to a growing literature concerned that publication bias has systematically skewed empirical estimates of many important phenomena across many disciplines (De Long and Lang, Reference De Long and Lang1992; Gerber and Malhotra, Reference Gerber and Malhotra2008; Gelman and Loken, Reference Gelman and Loken2014; Simonsohn et al., Reference Simonsohn, Nelson and Simmons2014). Historically, it has been difficult for null results to appear in published academic journals. Most published estimates are non-null as a result, even in cases when underlying relationships actually are null. The large literature on economic and retrospective voting is just as likely to face these issues as any other literature. Although each individual published study may be perfectly executed, the selection of positive results for publication has most likely led our aggregate view of economic and retrospective voting to overstate the effect of economic stimuli on incumbent electoral fortunes. Our results are consistent with this possibility, and they add a contrasting finding to the empirical literature on retrospective voting. Losing one's home to foreclosure, or living in an area where foreclosures are prevalent, constitutes a clearly visible, highly salient, and emotional experience, yet we find no major response in voter behavior.
Supplementary material
The supplementary material for this article can be found at https://doi.org/10.1017/psrm.2021.3.
Acknowledgements
For comments and suggestions, the authors thank Avi Acharya, Anthony Fowler, Judy Goldstein, Justin Grimmer, Gabe Lenz, Zhao Li, Chloe Lim, John Marshall, Pablo Montagnes, Julia Payson, Ken Scheve, Dan Thompson, Mike Tomz, Eric Zwick, and participants of the Governing the Global Economy Faculty Workshop at Stanford. For generously sharing data, the authors thank Andy Healy and Gabe Lenz. The protocol for this study has been approved by the Stanford IRB (No. 39468).