INTRODUCTION
Winter wheat (Triticum aestivum L.) is a widely grown cereal crop in most of northern and western Europe due to its high yield potential. However, this yield potential has been estimated in many model-based studies to decline with the projected increases in temperature under climate change, possibly exacerbated by increasing frequency of droughts (Olesen et al. Reference Olesen, Jensen and Petersen2000b; Trnka et al. Reference Trnka, Dubrovsky, Semeradova and Zalud2004). The effect of increasing temperatures is often projected to be more than counterbalanced by the effect of increased CO2 on crop photosynthesis. The combination of both effects would, for a moderate climate change, lead to moderate to large yield increases in comparison with yields simulated for the present situation (Ghaffari et al. Reference Ghaffari, Cook and Lee2002; van Ittersum et al. Reference van Ittersum, Howden and Asseng2003).
The effect of climate change on winter wheat yield is mediated through a range of biological, physical and chemical processes (Olesen & Bindi Reference Olesen and Bindi2002). Temperature affects crop yield through effects on growth rate and on plant development. At low temperatures (c. <10°C), both photosynthesis and plant sink strength would be restricted by temperatures (Gavito et al. Reference Gavito, Curtis, Mikkelsen and Jakobsen2001), and low temperatures would also delay development of the crop canopy and thereby delay the period with maximum light interception. At higher temperatures, the start of active growth is advanced, plants develop faster, and this reduces crop growth duration for most annual crops. In wheat, an increase of 1°C during grain fill has been estimated to reduce the length of this phase by 5%, and yield declines by a similar amount (Olesen et al. Reference Olesen, Jensen and Petersen2000b). There are also clear indications that increasing temperatures are causing grain yield reductions globally (Lobell & Field Reference Lobell and Field2007).
Most of Europe has experienced increases in the surface air temperature during 1901 to 2005, of c. 0·9 °C in annual mean temperature over the entire continent (Alcamo et al. Reference Alcamo, Moreno, Nováky, Bindi, Corobov, Devoy, Giannakopoulos, Martin, Olesen, Shvidenko, Parry, Canziani, Palutikof, Van Der Linden and Hanson2007). However, the recent period shows a trend considerably higher than the mean trend (+0·4°C/decade for the period 1977–2001; Jones & Moberg Reference Jones and Moberg2003). In Denmark, both summer and winter temperatures have increased during recent decades, and average winter and summer temperatures have over the period 2000 to 2008 been 1·5 and 1·1°C higher, respectively, than normal for the period 1961–90.
There are indications of changes in the rainfall pattern over Europe as indicated by the frequency of drought events during spring and early summer. There has been an increase in frequency of droughts in large parts of western and eastern Europe, with particularly large increases in the Mediterranean region (Trenberth et al. Reference Trenberth, Jones, Ambenje, Bojariu, Easterling, Klein Tank, Parker, Rahimzadeh, Renwick, Rusticucci, Soden, Zhai, Solomon, Qin, Manning, Chen, Marquis, Averyt, Tigor and Miller2007). Mean annual precipitation is increasing in most of the Atlantic and northern Europe and decreasing along the Mediterranean (Klein Tank et al. Reference Klein Tank, Wijngaard, Können, Böhm, Demarée, Gocheva, Mileta, Pashiardis, Hejkrlik, Kern-Hansen, Heino, Bessemoulin, Müller-Westermeier, Tzanakou, Szalai, Pálsdóttir, Fitzgerald, Rubin, Capaldo, Maugeri, Leitass, Bukantis, Aberfeld, van Engelen, Forland, Mietus, Coelho, Mares, Razuvaev, Nieplova, Cegnar, López, Dahlström, Moberg, Kirchhofer, Ceylan, Pachaljuk, Alexander and Petrovic2002). In Denmark, there has been a tendency for an increase in winter precipitation over recent decades, whereas summer rainfall on average has not changed.
The main changes in climate have occurred for temperature and rainfall. However, there are also indications of minor changes in global radiation in Denmark. The number of sunshine hours during winter has increased over the past two decades, whereas there has been no significant trend in summer sunshine hours.
Most analyses of climate change impacts on wheat yield have been based on the application of mechanistic and deterministic crop models that simulate the effects of weather on crop growth and yield, most often by incorporating effects of temperature, radiation and rainfall on crop development and growth processes (e.g. Wolf et al. Reference Wolf, Evans, Semenov, Eckersten and Iglesias1996; van Ittersum et al. Reference van Ittersum, Howden and Asseng2003; Trnka et al. Reference Trnka, Dubrovsky, Semeradova and Zalud2004). However, the weakness is that these models are almost exclusively concerned with direct effects of climatic factors on crop growth, whereas indirect effects (e.g. through pests and diseases or through crop losses by unfavourable harvest conditions) are ignored. To evaluate the importance of direct and indirect effects requires an empirical approach, analysing the statistical relationships between weather indices and observed crop yields.
Since the observed weather in Denmark has varied considerably over the past 20 years with a general trend for increasing temperatures, this provides opportunity to use observed winter wheat grain yields and observed weather for estimating the effects of weather variability on grain yield in Denmark. The objective of the present study was to develop a regression model of climate effects on wheat grain yield, and apply the regression model to estimate how climate change projections could affect wheat grain yield over the next 40 years.
MATERIALS AND METHODS
Data used for model estimation
The data originate from the national database of field trial data, held at the Danish Agricultural Advisory Service. From the database, trials carried out in Denmark between 1992 and 2008 with winter wheat (T. aestivum L.) under conventional farming practices were considered. The grain yield data from standard treated or control plots were extracted. Treatments typically had 3–5 replicates and the mean yield (tonne grain/ha, expressed at 0·85 dry matter) was used (Fig. 2). In addition, the information on location and soil type was used. The soil types were given according to the Danish soil classification system (Madsen et al. Reference Madsen, Nørr and Holst1992; Heidmann et al. Reference Heidmann, Christensen, Olesen, Petersen and Olesen2002), and soil types ranging from JB1 to JB10 were present in the data. In total, 6045 observations were extracted from variety trials, fertilizer trials and pesticide trials. The trials were mainly located at private farms spread over the country. Of the 6045 observations, 1897 were located on sandy soils (JB1 to JB4, ⩽0·10 clay) and 4148 were located on loamy soils (JB5 to JB10, >0·10 clay).
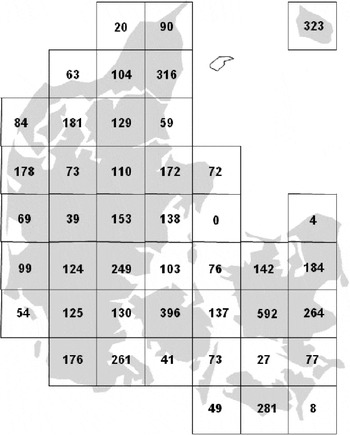
Location of the 44 grids from which daily weather variables were collected. The number of winter wheat trials available for the analysis has been indicated for each grid.

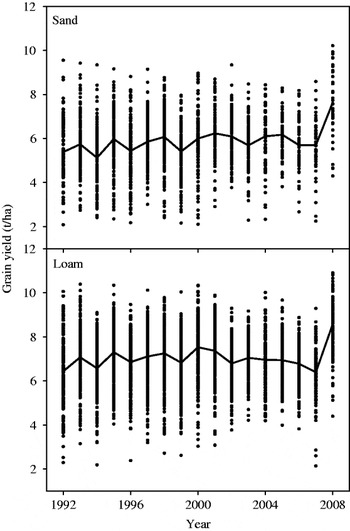
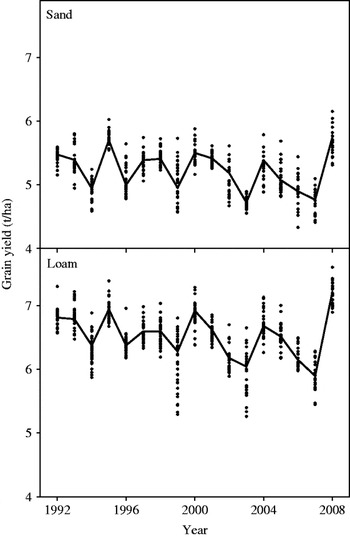
Average yield per grid for each year (as points) and weighted average per year (lines) for sandy soils (top) and loamy soils (bottom).

The yield data was combined with climate data available for each of the 44 grids of 40×40 km covering Denmark. Data from all climate grids except one were present in the analysed yield data (Fig. 1). Denmark covers a small area of Europe (max. 450 km from north to south and from west to east). However, being coastal, gradients in climate still exist across the country, particularly in precipitation which generally declines from west to east (Frich et al. Reference Frich, Rosenørn, Madsen and Jensen1997). To illustrate the variability in the grid-based climate within the 17-year period, annual sums or averages of air temperature, global radiation and precipitation for each year and grid were calculated. In order to characterize the temporal variability, the minimum and maximum of each climate variable, averaged over all 44 grids, were extracted. Likewise, the regional variability was found by extracting minimum and maximum climate variables across grids after averaging over years. It was found that annual global radiation varied only slightly across years and grids (minimum 3·4 GJ/m2 in 1998, maximum 4·0 GJ/m2 in 2008). The minimum value of mean annual air temperature (6·7°C) was experienced in 1996 and the maximum (10·5°C) occurred in 2007. Regional mean annual air temperatures ranged from 8·1°C in the north to 9·0°C in the southeast. The largest variability was found for mean annual precipitation that ranged from 423 mm in 1996 to 865 mm in 1999, and from 526 mm in the east to 854 mm in the west/Central Jutland.
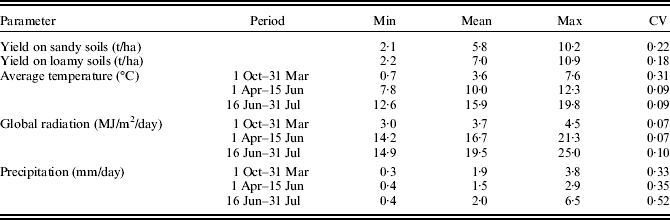
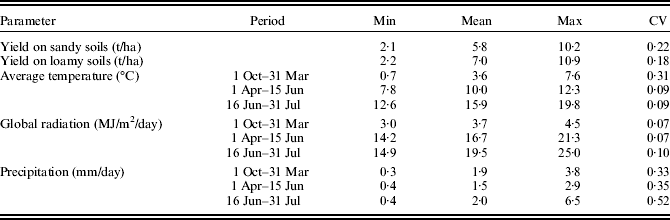
For the basic weather variables (air temperature, global radiation and precipitation), agroclimatic indices were calculated for each of the following three periods: winter: 1 October–31 March, spring: 1 April–15 June, and summer: 16 June–31 July (Table 1). All indices were calculated as daily averages. The winter period corresponds to the crop establishment phase, the spring period to the vegetative period and the summer to grain filling from anthesis to maturity.
Minimum, mean, maximum and coefficient of variation (CV) for yield and applied agroclimatic indices in Denmark
Statistical analyses
The selected agroclimatic indices were used for analysing winter wheat grain yield. All effects were estimated using mixed models in which the indices were included as regressors and the effect of soil type was included as a factor. In addition, a linear effect of year was included. The error term was defined as a sum of four components: year, grid, year×grid and residual – meaning that observations from the same grid and/or the same year were assumed to be correlated. The full mixed model including all nine agroclimatic indices (three indices of each of three weather variables), soil classification, change in management over years and random effects may be written as

where Y i is the average yield (t/ha of observation i), μ is the intercept, φ i is the effect of weather indices and θ i is the effect of soil classification and year for observation i, E i are deviations between observed yields and expected yield for observation i, and E i is assumed to be normally distributed with a mean of 0 and covariance matrix Σ, with Σ determined by the variance components σ A2, σ B2, σ C2 and σ D2. The terms φ i, θ i and E i are described in detail below:

where x ji is the value of index j for observation i and α j and β j are the linear and quadratic effects of index j

where λ s(i) is the effect of soil classification s for observation i (s is JB1 to JB10), γ is the linear trend over years – expected to describe management changes, and y i is the year in which the grain for observation i was harvested.

where A y(i) is the random effect of year y for observation i, A y(i)∼N(0, σ A2), B g(i) is the random effect of grid g for observation i, B g(i)∼N(0, σ B2), C y(i)g(i) is the random effect of grid g in year y for observation i, C y(i)g(i)∼N(0, σ C2) and D i is the residual variation within grid and year, D i∼N(0, σ D2).
The model described by eqns (1)–(4) was first fitted separately to data on sandy soil and loamy soil. Secondly, the model for each soil type was reduced in a stepwise manner by leaving out non-significant effects (P>0·05). At each step, the effect with the highest P-value was left out. Finally, a simplified model, including all effects that were statistically significant for at least one of the two soil types, was chosen, and this final model was then applied to data from each soil type.
The parameters of all models were estimated by restricted maximum likelihood (REML), although separate estimations were performed using maximum likelihood in order to compare the models. The estimation was performed using the function lme in the package nlme (Pinheiro et al. Reference Pinheiro, Bates, Debroy and Sarkar2009) of the statistical software R (www.r-project.org). The models were compared using Akaike's Information Criteria (Akaike Reference Akaike1974) and the estimated variance components.
Climate change projections
Climate change projections included in the study were based on two European climate model simulations carried out within the ENSEMBLES project (Beniston Reference Beniston2009). The climate models simulated the climate over Europe in the transient mode through the 21st century using the A1B emission scenario (Nakicenovic et al. Reference Nakicenovic, Alcamo, Davis, de Vries, Fenhann, Gaffin, Gregory, Grübler, Jung, Kram, Lebre la Rovere, Michaelis, Mori, Morita, Pepper, Pitcher, Price, Riahi, Roehrl, Rogner, Sankovski, Schlesinger, Shukla, Smith, Swart, van Rooijen, Victor and Dadi2000). A subset of model combinations were collected, namely two regional circulation models (RCMs) driven by two bounding global circulation models (GCMs), to provide a range of climate scenarios reflecting the uncertainties within climate modelling. The RCMs originated from the Royal Netherlands Meteorological Institute (‘KNMI’, bounding GCM being ECHAM5) and from Met-Office Hadley Centre (‘METO’, bounding GCM being HadCM3Q0).
For each model, two time slices, 2020 (2011–30) and 2040 (2031–50), were extracted. A control period, ‘Baseline 1985’ (1975–94) was used for reference, and observed gridded daily data from the control period was used to calibrate the LARS-WG stochastic weather generator (Semenov Reference Semenov2007). Statistics on the difference between the control and the future periods with the two RCMs were used to estimate climatic change parameters for the weather generator. The parameterized weather generator produced five 50-year records of climate, characteristic for baseline, 2020 and 2040 conditions and reflecting the variability among the two RCMs. From the climate projections produced by the weather generator at a European 50 km grid, two Danish grids were picked representing climate conditions in Central Jutland (central mainland of Denmark, which is relatively cool and wet) and West Zealand (the western part of the largest eastern island, which is relatively warm and dry).
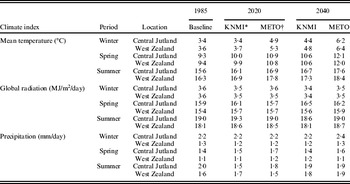
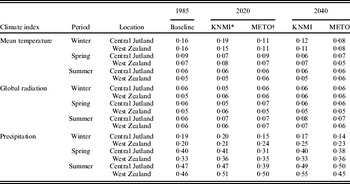
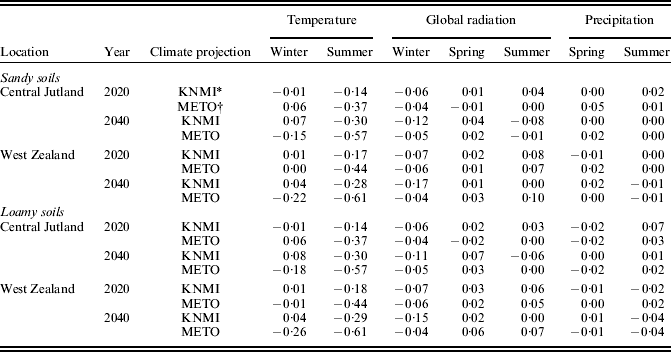
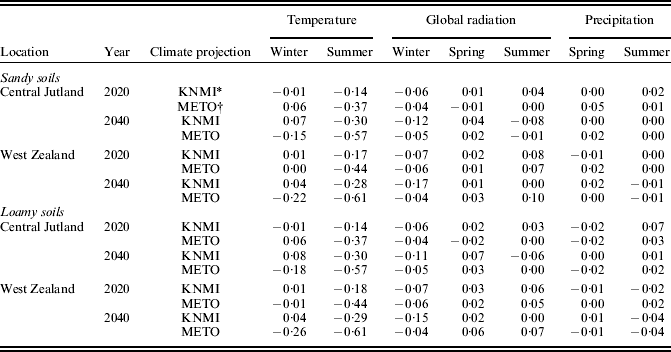
The estimated parameters of the final yield models for sandy and loamy soils were used to predict the winter wheat yield for 49 replicates (since data across the new year were used, only 49 replicates were possible from 50 complete years) for each of the climate change projections at the two selected locations in Denmark. The effect of the different projections on the agroclimatic indices are shown in Tables 2 (mean of 49 years) and 3 (variability among 49 years). To ease the comparison of climate change effects, the year effect of the model was fixed to that of 2008 for all climate change projections, and the results were compared in terms of change in mean yield and coefficient of variation (CV).
Mean value of agroclimatic indices under observed baseline conditions and for climate change projections for winter (1 Oct–31 Mar), spring (1 Apr–15 Jun) and summer (16 Jun–31 Jul) for two locations in Denmark

* Royal Netherlands Meteorological Institute.
† Met-Office Hadley Centre.
CV for agroclimatic indices under observed baseline conditions and for climate change projections for winter (1 Oct–31 Mar), spring (1 Apr–15 Jun) and summer (16 Jun–31 Jul) for two locations in Denmark

* Royal Netherlands Meteorological Institute.
† Met-Office Hadley Centre.
To evaluate the effect on predicted yield changes caused by each agroclimatic index in the regression model, the components of the predicted yield were calculated for each replication of each combination of climate projection and agroclimatic index. The components were then averaged for each combination of climate projection and climate index and finally the baseline climate projection was used as a reference within each soil type and location by subtracting the mean component of the baseline climate projection from the mean of the climate change projection. As an example the component for the average winter temperature for the KNMI climate projection for 2020 on sandy soils in Central Jutland was calculated as

where
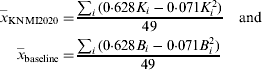
where K i is the average winter temperature for replicate i of the KNMI projection in 2020 in Central Jutland and B i is the average winter temperature for replicate i of the baseline projection in Central Jutland.
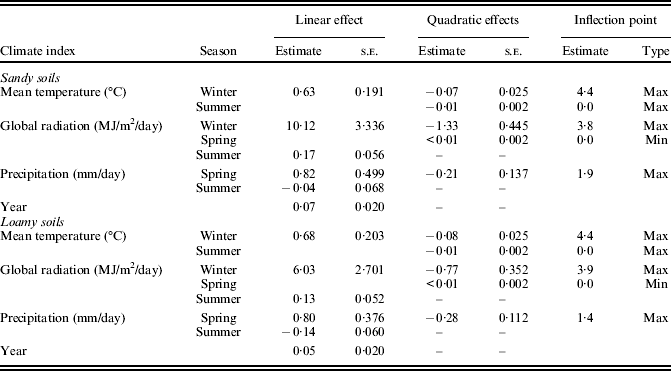
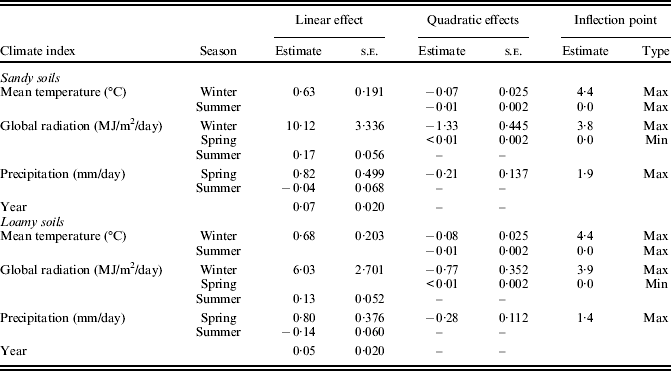
The coefficients 0·628 and −0·071 were taken from Table 5. For indices where either the linear or the quadratic effect is missing, the expressions were simplified.
RESULTS
Model and effects for applied data
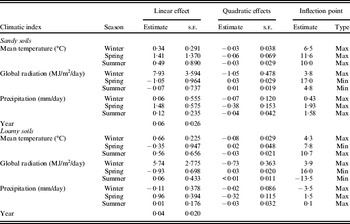
The estimates for the parameters of the full yield model are shown in Table 4. For most indices, the relation was estimated as a maximum and in those cases where a minimum was estimated, neither term was significantly different from zero.
Parameter estimates for the full model of grain yield (t/ha) on sandy soils and loamy soils in Denmark

When simplifying the model, more agroclimatic indices remained significant on loamy soils than on sandy soils. This was expected to be caused partly by the larger number of observations on loamy soils than on sandy soils (4841 on loamy soils and 1897 on sandy soils). For that reason and because it is difficult to compare parameter estimates in models that do not include the same parameters, a common model was defined by including all indices that were significant for at least one of the soil types. In this final model, the agroclimatic indices of precipitation during winter and temperature during spring were removed. For temperature during summer and global radiation during spring, only the quadratic term was retained, forcing the inflection point to occur at zero for those two agroclimatic indices. For global radiation and precipitation during summer, only the linear term was retained. For temperature and global radiation during winter and precipitation during spring, both the linear and quadratic terms were retained. The parameter estimates for the final model are shown in Table 5.
Parameter estimates for the final model of grain yield (t/ha) including all effects that were significant on either sandy soils or loamy soils in Denmark
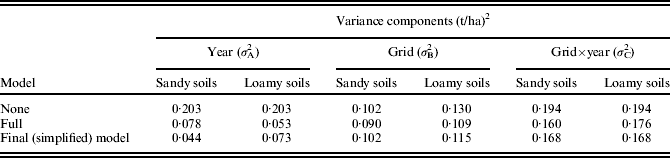
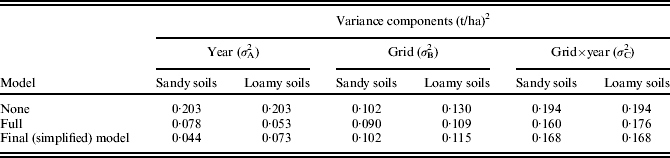
The simplified and final model seemed to explain the variation caused by agroclimatic indices as well as the full model. The Akaike's information criteria were smallest in the final model for both soil types (the difference in Akaike's information criteria between models was 3–5 units). Both the full and the final model reduced the variance component for year by 20–40% (Table 6). The models only marginally reduced the variation between grids and grids×year.
Estimated variance components for grain yield (t/ha) in the full model and the final (simplified) model for two soil types in Denmark
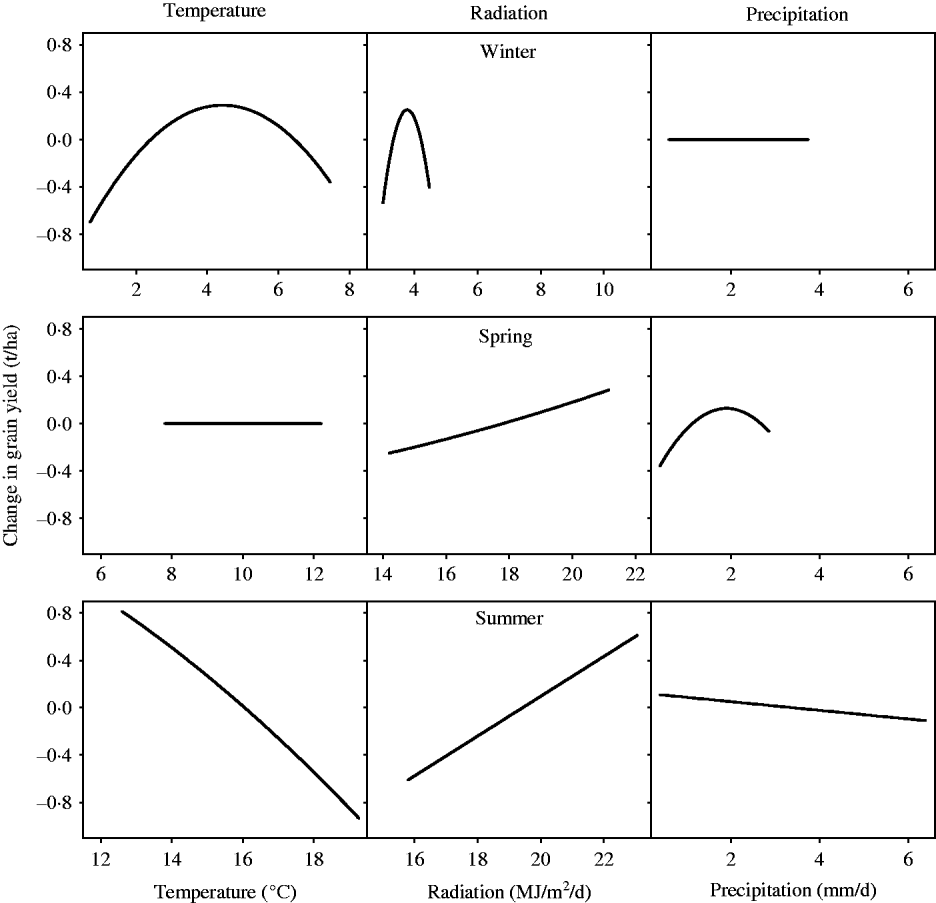
To obtain maximum yield, temperature during winter, global radiation during winter and precipitation during spring should be about 4·4°C, 3·8–3·9 MJ/m2/day and 1·4–1·9 mm/day, respectively (Table 5). Within the limits of the examined climate the average temperature and precipitation during summer should be as low as possible, whereas the radiation during spring and summer should be as high as possible to maximize yield.
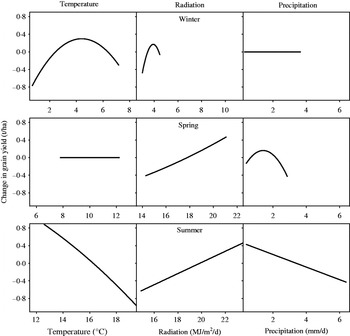
The largest effect seemed to be caused by temperature during the summer period, where an increase in average temperature from c. 13 to c. 20°C could decrease winter wheat yield by almost 2·0 t/ha (Figs 3 and 4). However, if such an increase in temperature is accompanied by higher radiation, then this increase in radiation may (partly) compensate for the effect of increased temperature.
Effect of agroclimatic indices in the final model for sandy soils.
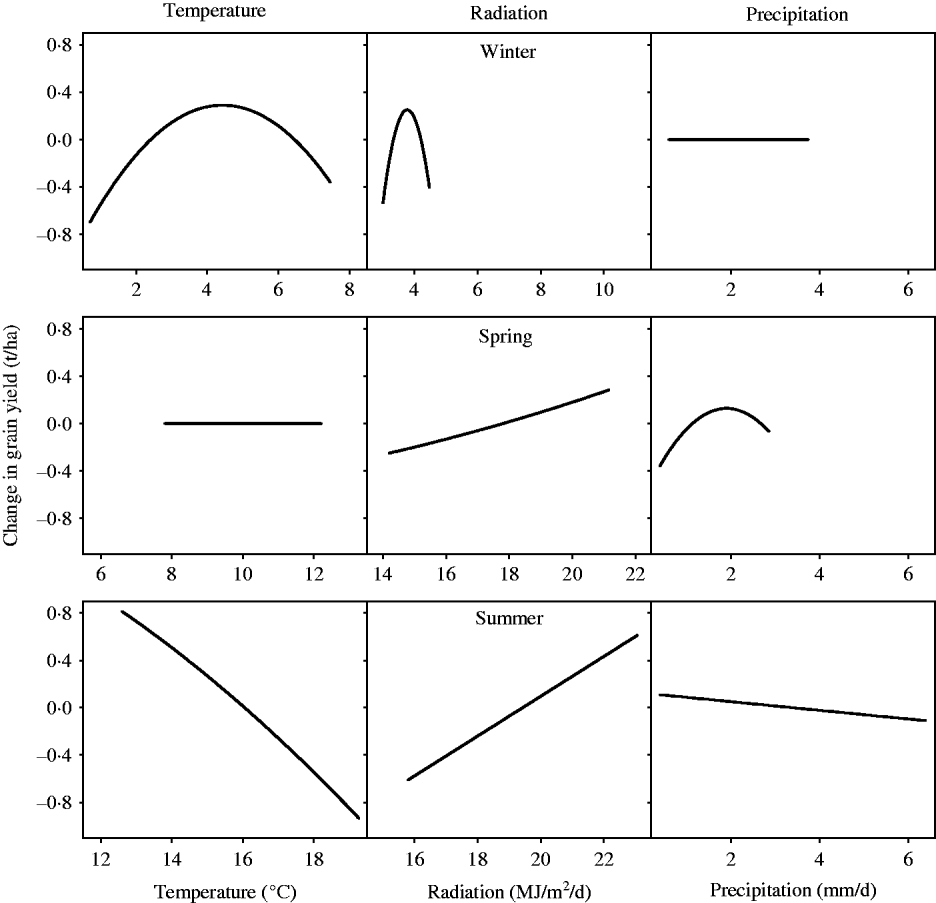
Effect of agroclimatic indices in the final model for loamy soils.

The largest difference between the two soil types was found for the effect of precipitation during the summer period, where the negative effect of precipitation was almost four times higher on loamy soils than on sandy soils (Table 5). Also, the positive effect of global radiation during the spring period was higher on loamy soils than on sandy soils (about 50% larger on loamy than on sandy soils).
All models seemed to explain a large part of the observed difference in yield for 2007 and 2008, which represent the lowest and highest yielding years, respectively, and a weather induced difference of about 1·0–1·5 t/ha between those 2 years was estimated (Fig. 5).
Predicted effects of agroclimatic indices for each grid (points) and year (line) for sandy soils (top) and loamy soils (bottom).

The model estimated an annual increase of about 0·07 t/ha on sandy soils and about 0·05 t/ha on loamy soils (Table 5).
Effect in climate change projections
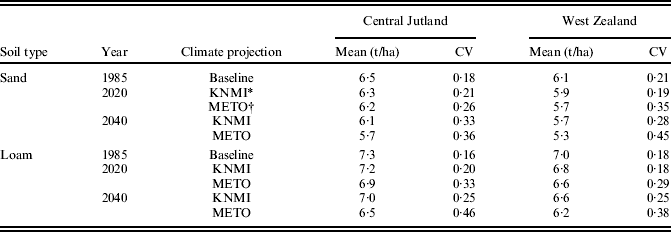
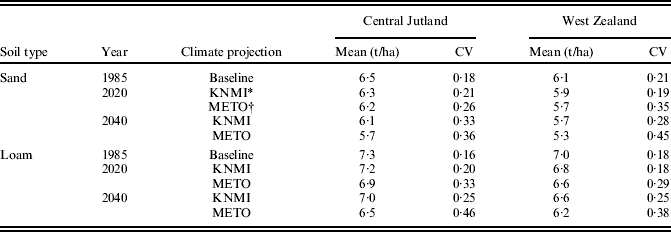
Applying the statistical yield model to the climate change projections resulted in yield decreases for all locations, soil types and climate change projections (Table 7). The average reductions from 1985 to 2020 were 0·26 t/ha and reductions from 1985 to 2040 were 0·57 t/ha and more pronounced for the METO than for the KNMI projections. For all climate change projections, the predicted yield was larger for the climate in Central Jutland than for West Zealand – and the yield reductions were most often larger for loamy soils than sandy soils and also larger in West Zealand than in Central Jutland.
Summary of predicted yield for baseline climate and four climate change projections, two soil types and two locations in Denmark
* Royal Netherlands Meteorological Institute.
† Met-Office Hadley Centre.
The estimated inter-annual yield variation depended on climate change projection and the CV in the climate change projection with the largest variation was up to three times that of the climate change projection holding the smallest variation (Table 7). The smallest variation in the predicted yield was found for the baseline climate and the KNMI projection in 2020. The largest variation was found for the METO climate projection in 2040. The KNMI climate change projection in 2040 and the METO projection in 2020 showed an intermediate variation.
A very large part of the yield changes between climate change projections seemed to be caused by the mean summer temperature (Table 8). The average temperature during summer thus explained 0·61 t/ha of the total decrease of 0·78 t/ha between the baseline climate and the METO climate projection for both soil types for 2040 in West Zealand. For this projection, temperature during winter also had a noticeable effect. The small decline in global radiation during winter seemed to decrease the yield slightly for future climate projections.
Contribution to predicted grain yield changes (t/ha) for future climate projections compared to 1985 baseline for two agroclimatic indices in Denmark
* Royal Netherlands Meteorological Institute.
† Met-Office Hadley Centre.
The difference in predicted yield for Central Jutland and West Zealand for all climate projections seemed primarily to be caused by a lower mean temperature and a higher radiation in Central Jutland during the summer (Table 2).
DISCUSSION
When developing the regression equations for yield effects of climatic variables in winter wheat, the growing season was divided into three parts, which represented three phases of crop growth and development; establishment (winter), vegetative growth (spring) and grain filling (summer). Winter wheat in Denmark is normally sown during September, and the crop establishment phase was therefore set to start on 1 October. The vegetative growth phase was set to start on 1 April, at which time the temperatures are usually high enough for active and vigorous growth to start, which is soon followed by stem elongation. The grain filling period was set to start on 16 June, which is the usual time of anthesis in winter wheat in Denmark, and physiological maturity is normally obtained in late July.
Crop establishment
During crop establishment, the crop has to develop a deep and healthy root system and a sufficient number of active tillers to be able to support and sustain rapid growth in the following vegetative period. The regression model showed that both temperature and radiation during winter affected crop yield, and in both cases non-linear responses were obtained.
The response of grain yield to mean temperature during winter had an inflection point at 4·4°C. Above this temperature, higher mean temperatures result in lower grain yields (Figs 3 and 4). The non-linear response of grain yield is probably caused by two or more opposing effects, which then vary in importance depending on temperature.
Olesen et al. (Reference Olesen, Jensen and Petersen2000b) analysed grain yield of winter wheat from 1971 to 1997 at seven Danish experimental stations. The yield data were first detrended and then correlated with monthly values of temperature, rainfall and solar radiation. Yields were positively correlated with temperatures during autumn and winter, and no non-linear temperature response was found. However, during 1971–92 winter temperatures were generally lower than during the period from 1992 to 2008, and the high winter temperatures leading to yield reductions may simply have been absent during 1971–92.
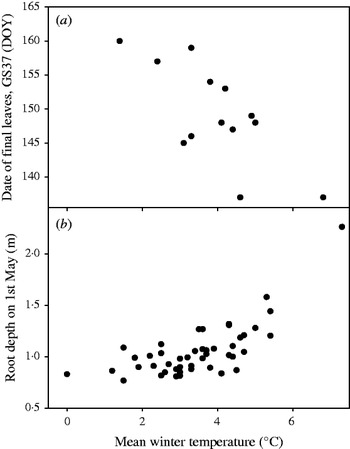
Higher winter temperatures enhance crop development leading to earlier appearance of final leaves, as illustrated in Fig. 6a using data from the monitoring network for plant diseases in Denmark. The date of flag leaf appearance varied by more than 3 weeks, and this variation was largely determined by winter temperatures. An earlier appearance of the final leaves shortens the period that the crop has available for developing its canopy, thus reducing the capacity to intercept radiation. The period for developing tillers and ears is also reduced, possibly also reducing the sinks for carbohydrates during grain-filling. When this vegetative period becomes too short, it negatively affects the yield potential, and this is the likely explanation for high winter temperatures resulting in lower yields.
Date of flag leaf appearance (corresponding to BBCH stage 37): (a) in winter wheat for the years 1996–2008 in the Danish monitoring network for plant disease v. mean winter temperature (Oct–Mar) for Denmark and (b) simulated root depth on 1 May v. mean winter temperature for emergence at 1 Oct for 1961–2006 at Jyndevad in Denmark.

Low winter temperatures can lead to low grain yields in winter wheat. This can partly be explained by very low winter temperatures giving rise to frost or cold damage (Olesen et al. Reference Olesen, Jensen and Petersen2000b). Using wheat yield data from field experiments in Britain, Landau et al. (Reference Landau, Mitchell, Barnett, Colls, Craigon and Payne2000) accordingly found that winter minimum temperatures above −3·2°C increased grain yields, which they attributed to the effect on winter kill of the crop. Another reason is that cold temperatures during winter limit root growth, since the development of deep root systems is primarily controlled by soil temperature. Cold temperatures therefore result in the root system of the winter wheat in spring being too shallow, which makes the crop more susceptible to drought during spring and summer. This is illustrated in Fig. 6b, which shows simulated root depth on 1 May for a crop that emerged on 1 October using the root growth procedures of the FASSET wheat model (Olesen et al. Reference Olesen, Petersen, Berntsen, Hansen, Jamieson and Thomsen2002) using data from the Jyndevad meteorological station in Denmark for 1961–2006. In the simulations, soil temperature was assumed to track air temperature. The average root depth increased from about 0·8 m at winter temperatures of 1°C to c. 1·1 m at 4°C. For most soil types, this represents a difference in plant available water of about 40 mm, corresponding to c. 10 days of crop transpiration. Such a difference can be critical for crop growth in dry years.
Grain yield also had a non-linear response to global radiation during winter with an inflection point at about 3·8 MJ/m2/day. Increasing solar radiation is generally expected to have a positive effect on crop growth and establishment. However, during winter, high solar radiation would be associated with clear skies and low (freezing) night temperatures that may lead to crop damage or desiccation of the above-ground parts of the crop. Such an effect could reduce plant vigour and lead to lower yields.
Vegetative growth
There was no estimated response of grain yield to increasing temperatures during the spring period, but higher global radiation was estimated to stimulate yield (Figs 3 and 4). Olesen et al. (Reference Olesen, Bøcher and Jensen2000a) correlated regional winter wheat yields for 1971–97 in Denmark with seasonal temperature and precipitation, and found a slightly positive effect of temperature during April–July on grain yield. However, their analysis did not include any effect of global radiation, and it is possible that the temperature effect found in their study was caused by the positive inter-correlation of temperature and global radiation during spring.
Global radiation has a positive effect on grain yield, most likely because higher global radiation stimulates photosynthesis and dry matter accumulation as pointed out by Monteith (Reference Monteith1977). The response of grain yield to radiation was about twice as high for loamy compared to sandy soils. Sandy soils in Denmark are prone to drought, but a large proportion of the wheat area on sandy soils is irrigated in Denmark (Olesen et al. Reference Olesen, Bøcher and Jensen2000a). A high global radiation is associated with high evapotranspiration, which leads to higher drought risk, in particular, on sandy soils. It is therefore likely that the lower effect of global radiation on grain yield on sandy soils is caused by the higher risk of droughts under dry conditions for these soils.
Grain yield is stimulated by increasing rainfall up to c. 1·9 mm/day on sandy soils and to c. 1·4 mm/day on loamy soils. The higher inflection point for the sandy soil is probably due to the low soil water holding capacity for sandy soils leading to greater dependency on spring rainfall for sustaining crop growth. The negative effects of high spring rainfall could be due to more disease under rainy conditions. Shaw et al. (Reference Shaw, Bearchell, Fitt and Fraaije2008) using archived samples from the long-term wheat experiment in Rothamsted in Britain thus found that higher rainfall in May and June caused higher abundance of septoria leaf blotch (Mycosphaerella graminicola) and septoria glume blotch (Phaeosphaeria nodorum). Septoria leaf blotch has been the most yield reducing disease in wheat in Denmark over the past 20 years (Olesen et al. Reference Olesen, Jørgensen, Petersen and Mortensen2003; Jørgensen et al. Reference Jørgensen, Nielsen, Ørum, Jensen and Pinnschmidt2008), and it is therefore likely that the negative effect of high rainfall on grain yield is related to higher occurrence of this disease in wet years.
Grain filling
During grain filling, there was a strong negative effect of temperature on grain yield. A temperature increase of 1°C is predicted to reduce yield by c. 0·25 t/ha, corresponding to c. 4·3% on sandy soils and 3·5% on loamy soils. This corresponds well with simulated effects of temperature increase on grain yield in Denmark, where an increase of 1°C during grain filling was predicted to reduce the duration of the grain filling phase by 5%, and yield was predicted to decline by a similar amount (Olesen et al. Reference Olesen, Jensen and Petersen2000b). In a simulation study using several different wheat simulation models, Wolf et al. (Reference Wolf, Evans, Semenov, Eckersten and Iglesias1996) found a reduction of grain yield of c. 4–5% for each 1°C increase in mean temperature. This is in close agreement with the estimated results found in our study. There is a significant non-linear response to summer temperature, which was also found for several simulation models (Wolf et al. Reference Wolf, Evans, Semenov, Eckersten and Iglesias1996).
In the study by Olesen et al. (Reference Olesen, Jensen and Petersen2000b) there was no correlation between June or July temperature and observed grain yield in wheat. This absence of correlation may have been due to the strong positive effect of global radiation during summer on grain yield (Figs 3 and 4). Global radiation promoted crop photosynthesis, but may also contribute to reduce prevalence of diseases. There is positive inter-correlation between temperature and global radiation and this may have been the reason for the lacking summer temperature effect observed by Olesen et al. (Reference Olesen, Jensen and Petersen2000b). In the present study, a yield increase of 0·0027 to 0·0037 t/ha/(MJ/m2) was found for this 45-day period. This is about twice as high as found in the regression study by Landau et al. (Reference Landau, Mitchell, Barnett, Colls, Craigon and Payne2000) for a 20-day period around anthesis in wheat in Britain.
As for the spring period, the negative effect of summer rainfall may partly be due to increased prevalence of septoria diseases during wet summers. However, rainfall during late July before the harvest period may also hamper and delay the harvesting with potential negative effects on yield, in particular, if heavy rainfall results in lodging. Olesen et al. (Reference Olesen, Jensen and Petersen2000b) also found a negative effect of July temperature on grain yield in wheat, and Landau et al. (Reference Landau, Mitchell, Barnett, Colls, Craigon and Payne2000) found that rainfall in the week before harvesting negatively affected grain yield in Britain, suggesting difficult harvesting conditions may reduce yields.
The analysis also shows that precipitation during the spring and summer period does not appear to be a very important factor. There seems to be a positive effect of avoiding droughts during spring, which is in line with similar estimates made by Landau et al. (Reference Landau, Mitchell, Barnett, Colls, Craigon and Payne2000), who also found that rainfall during grain filling did not affect yield and attributed this partly to compensation from using stem reserves for the grain filling. On most sandy loams and loams in Denmark, winter wheat establishes a very deep root system, which means that water shortages and most droughts do not result in yield losses. However, in some years with early droughts yield losses may occur, in particular, in late sown crops, where root growth is delayed resulting in water shortages.
On sandy soils, drought effects are much more likely to occur. Large yield benefits from irrigation on sandy soils (c. 2 t/ha) have previously been observed in experiments (Olesen et al. Reference Olesen, Mortensen, Jørgensen and Andersen2000c). Therefore, winter wheat is commonly irrigated on these soils in Denmark. When irrigation is applied in an optimal way relatively high yields can be obtained. However, irrigation strategies and methods vary in efficiency, and therefore the yields of winter wheat on sandy soils are considerably lower than for loamy soils (Fig. 5). Therefore, the use of irrigation generally masks the effects of precipitation on grain yield. The smaller negative response of grain yield to precipitation on sandy compared to loamy soil suggests that the irrigation has not always been optimal and some drought stress may have affected yields on the sandy soils.
Using regression models
The statistical analyses assumed that the weather variables were known without any random error (variation). From linear regression theory, it is known that a violation of the assumption of no random error may cause the estimates to be biased towards zero (e.g. Fuller Reference Fuller1987), meaning that the true effect of the applied indices may be larger than estimated here. However, ignorance of the effects of random error on weather variables does not bias the predicted changes in grain yield if the regressors can be assumed to come from the same distribution as the one used for estimation (Fuller, Reference Fuller1987). The assumption is only approximately fulfilled here as the mean future climate is different from the present, but because the difference is moderate, we do not assume this to be serious.
The final model was used for predicting the effect of projected climate changes in 2010–30 and in 2030–50. The model was not applied to more extreme projections than those broadly covered by the observed range of the agroclimatic indices used for developing the yield model. For the climate change projections, the agroclimatic indices marginally exceeded the range of variables used for estimating the parameters of the model only in a few cases.
Climate change projections
The climate change projections showed yield reductions that are higher in 2040 than in 2020 and higher for the METO model runs than for the KNMI runs. It should be noted that the projected effects of these climate change scenarios only include the effects of changes in agroclimatic indices and not the effects of change in atmospheric CO2 concentration on crop growth. Simulation model estimates for climate change scenarios that include both climatic and CO2 effects on crop growth and yield have generally shown that yield increases caused by elevated CO2 concentrations compensate for the yield reduction caused by changes in temperature and rainfall (Semenov et al. Reference Semenov, Wolf, Evans, Eckersten and Iglesias1996; Weiss et al. Reference Weiss, Hays and Won2003). Simulations have shown net yield increases in Northern Europe and reductions in Southern Europe under climate change scenarios for the latter part of the 21st century (Olesen et al. Reference Olesen, Carter, Diaz-Ambrona, Fronzek, Heidmann, Hickler, Holt, Minguez, Morales, Palutikof, Quemada, Ruiz-Ramos, Rubæk, Sau, Smith and Sykes2007).
There is a clear tendency towards increased yield variability in the climate change projections (Table 7), in particular, for the METO projection for 2040. This increase is only slightly caused by increased variability of the agroclimatic indices in the climate change projections (Table 3); rather it is mainly caused by non-linear responses of grain yield to the agroclimatic indices. The response to winter temperature is probably the primary driver of increased yield variability in the climate change scenarios, since the inflection point in the estimated response is located at about average winter temperature and winter temperature is projected to increase under climate change. This is also indicated by the fact that winter temperature contributed to overall yield reductions in the METO scenario for 2040, where the largest increase in yield variability was estimated.
Some of the projected yield reductions and increased yield variability under climate change may be avoided by having a smaller negative response of winter temperature on grain yield. This requires that the date of anthesis becomes less responsive to increased winter temperature than indicated by the present study. This may be obtained either by delayed sowing or by growing varieties that have a higher vernalization requirement and/or a stronger day length requirement. It may also be necessary for breeding to consider varieties that are more heat tolerant during anthesis and grain filling (Ortiz et al. Reference Ortiz, Sayre, Govaerts, Gupta, Subbarao, Ban, Hodson, Dixon, Ortiz-Monasterio and Reynolds2008).
In conclusion, regression equations for yield effects in winter wheat as a function of agroclimatic indices were developed by dividing the growing season into three parts representing three phases of crop growth and development: establishment (winter), vegetative growth (spring) and grain filling (summer). The agroclimatic index for summer temperature showed the strongest effect causing lower yields with increasing temperature, whereas the yield increased with increasing radiation during summer and spring. Grain yield responded non-linearly to mean winter temperature with the highest yield at 4·4°C and lower yields both below and above this inflection point.
The application of the model showed that the average yield was predicted to decrease under projected climate change. On average, the grain yield decreased by c. 0·25 t/ha from 1985 to 2020 and by c. 0·55 t/ha from 1985 to 2040. Yield decreases varied between 0·1 and 0·8 t/ha and were larger for wheat grown in West Zealand than in Central Jutland and in most cases also larger for loamy soils than for sandy soils.
The inter-annual variation in grain yield varied greatly between climate projections. The CV varied between 0·16 and 0·46 and was smallest for wheat grown on loamy soils in Central Jutland in the baseline climate and largest for winter wheat grown under one of the 2040 climate projections. The increase in CV is not as much an effect of increased climatic variability under the climate change projections, but more an effect of increased winter temperature, where more extreme winter temperatures (lower or higher than the inflection point at 4·4°C) increased the effect of winter temperatures.
This study was carried out within the project ‘Impacts and adaptation to climate change in cropping systems’ funded by the Danish Ministry of Food, Agriculture and Fisheries. We thank the Danish Agricultural Advisory Service, Skejby, Denmark, for providing the dataset on winter wheat trials during 1992–2008. The climate change projection data used in this work was provided by the EU FP6 Integrated Project ENSEMBLES (Contract 505539).