Implication
A multiple breed approach for predicting direct genomic values in three cattle breeds is presented. The use of multiple breed reference populations might help to increase genomic selection accuracy in small cattle populations. This approach is extendable to populations of other species with reduced number of genotyped animals.
Introduction
Dense marker maps are currently used in the dairy cattle industry for predicting genomic enhanced breeding values (GEBV) in genomic selection (GS) programs (Meuwissen et al., Reference Meuwissen, Hayes and Goddard2001). The advantages of GS in cattle have been extensively reviewed (Hayes et al., Reference Hayes, Bowman, Chamberlain and Goddard2009b; VanRaden et al., Reference VanRaden, Van Tassell, Wiggans, Sonstegard, Schnabel, Taylor and Schenkel2009). GEBV accuracy is related to the size and structure of the reference population, the level of linkage disequilibrium (LD) between markers and quantitative trait loci (QTL), the number of QTL underlying the trait and its heritability. Among them, the size of the reference population probably plays the key role to accomplish the theoretical expectations of GS (Goddard and Hayes, Reference Goddard and Hayes2009).
The need for increasing the size of the reference population for improving GEBV accuracy led to the creation of consortia among breed associations and breeding companies. Thus, genotypes have been exchanged and larger common reference populations have been created as, for instance, in Holstein (Lund et al., Reference Lund, Roos, Vries, Druet, Ducrocq, Fritz, Guillaume, Guldbrandtsen, Liu, Reents, Schrooten, Seefried and Su2011) and Brown Swiss (Jorjani et al., Reference Jorjani, Jakobsen, Hjerpe, Palucci and Dürr2012). The problem still remains in small or admixed populations. Some authors proposed to use prediction equations estimated in a breed with a large reference population for calculating GEBV in others of small size. Poor results have been obtained, especially for populations that are genetically distant (Hayes et al., Reference Hayes, Bowman, Chamberlain, Verbyla and Goddard2009a; Pryce et al., Reference Pryce, Gredler, Bolormaa, Bowman, Egger-Danner, Fuerst, Emmerling, Solkner, Goddard and Hayes2011; Olson et al., Reference Olson, VanRaden and Tooker2012). The use of a multiple breed (MB) reference population could be an alternative for improving GEBV accuracy in small populations. The MB rationale relies on the use of statistical models able to capture LD between SNPs and QTLs when different breeds are analyzed jointly. The combination of different breeds in a larger reference population was simulated by de Roos et al. (Reference de Roos, Hayes and Goddard2009). The authors concluded that a large marker density was needed to preserve the marker-QTL association across breed, when genetically divergent breeds were pooled together. Furthermore, Kizilkaya et al. (Reference Kizilkaya, Fernando and Garrick2010) reached the same conclusions simulating MB performances from actual 54K genotypes. A slight improvement in the accuracy of genomic predictions was achieved in real data using medium density chip in MB populations. To date, the increase of marker density (e.g. the use of BovineHD beadchip; Illumina inc., CA, USA) hardly improved GEBV accuracy both in pure breed and MB cattle populations (Harris et al., Reference Harris, Creagh, Winkelman and Johnson2011; Erbe et al., Reference Erbe, Hayes, Matukumalli, Goswami, Bowman, Reich, Mason and Goddard2012; VanRaden et al., Reference VanRaden, Null, Sargolzaei, Wiggans, Tooker, Cole, Sonstegard, Connor, Winters, van Kaam, Valentini, Van Doormaal, Faust and Doak2013).
In all, two main approaches have been proposed in the MB framework: SNP effect estimation (GBLUP or Bayesian methods) from a MB reference considered as homogenous population (Hayes et al., Reference Hayes, Bowman, Chamberlain, Verbyla and Goddard2009a; Brondum et al., Reference Brondum, Rius-Vilarrasa, Stranden, Su, Guldbrandtsen, Fikse and Lund2011; Pryce et al., Reference Pryce, Gredler, Bolormaa, Bowman, Egger-Danner, Fuerst, Emmerling, Solkner, Goddard and Hayes2011), or adaptation of multiple-trait model to the MB case. For instance, Makgahlela et al. (Reference Makgahlela, Mantysaari, Stranden, Koivula, Nielsen, Sillanpaa and Juga2013) proposed a multiple-trait random regression model, fitting breed proportions as random predictors and an interaction between marker and breed effects. Similar approaches have been implemented by Olson et al. (Reference Olson, VanRaden and Tooker2012) and Karoui et al. (Reference Karoui, Carabano, Diaz and Legarra2012) in US and French MB dairy cattle populations, respectively. Although these models allow marker effects to differ among breeds, no or slight gain in accuracy were obtained in comparison with less computational intensive models.
An interesting option for across breed genomic evaluation may be represented by the use of multivariate statistics. Principal component analysis (PCA) originally proposed to take into account population structure in human genetics by Cavalli-Sforza (Patterson et al., Reference Patterson, Price and Reich2006), is currently used in animal breeding for several purposes. In the GS framework, PCA has been used to reduce the number of predictors in the estimation of direct genomic values (DGV) by Solberg et al. (Reference Solberg, Sonesson, Woolliams and Meuwissen2009). Furthermore, eigenvalues of SNP correlation matrix were also used as variance priors to estimate DGV in simulated and real cattle data (Macciotta et al., Reference Macciotta, Gaspa, Steri, Nicolazzi, Dimauro, Pieramati and Cappio-Borlino2010; Pintus et al., Reference Pintus, Gaspa, Nicolazzi, Vicario, Rossoni, Ajmone-Marsan, Nardone, Dimauro and Macciotta2012). In this context, PCA was used to reduce the computational demand and the co-linearity among predictors to calculate DGV of pure breed animals. Daetwyler et al. (Reference Daetwyler, Kemper, van der Werf and Hayes2012) developed a PCA approach to correct for population structure in a complex MB sheep population.
The overall objective of this work was to test the effect of the use of principal components (PCs) instead of SNP genotypes as predictors in the calculation of DGV either in single breed (SB) or MB scenarios. In particular, the effects of the size and the composition of the MB reference population on DGV accuracy were investigated.
Material and methods
Data
A total of 3559 bulls of three Italian breeds (2093 Italian Holstein, 749 Italian Brown Swiss and 717 Italian Simmental) were genotyped at 54K SNP. Animals were genotyped with both Illumina Bead chip v1 and v2 that hold 54 001 and 54 069 SNPs, respectively. Therefore, only common markers (52 340) were retained. A total of seven scenarios of breed composition were considered: Holstein, Brown Swiss, Simmental, Holstein+Brown Swiss+Simmental (HBS), Holstein+Brown Swiss (HB), Brown Swiss+Simmental (BS) and Holstein+Simmental (HS) (Table 1). Bulls with poor quality genotypes (callrate <97.5%) were discarded. Furthermore, checks for Mendelian inconsistency were performed within each breed examining sire–son pairs (animal with >2% inconsistency were eliminated). Finally, bulls with missing phenotypic records were included in the data set to perform PCA but excluded from the DGV estimation.
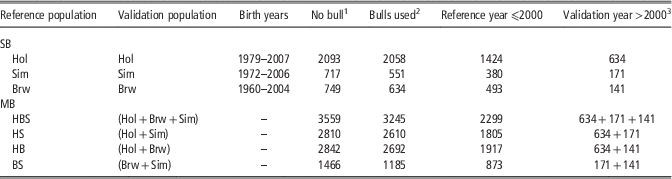
Composition of reference and validation data sets used for direct genomic value estimation in Italian Holstein (Hol), Italian Simmental (Sim) and Italian Brown Swiss (Brw) either in single breed (SB) or multiple breed (MB) populations

Number of bulls left after data editing and cut-off year of birth used to define reference and validation population were reported both for SB or MB population.
1 Bulls used in principal component analysis.
2 Bulls used for genomic evaluation: differences in the number of bulls are due to missing phenotypes.
3 Validation bulls of MB data set were the same as SB analysis.
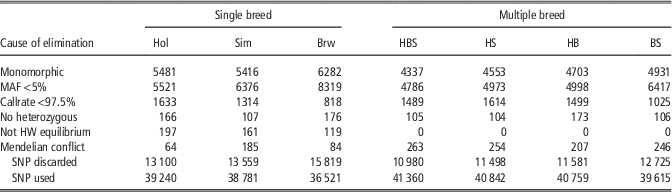
Quality control was performed separately in each data set. The causes of SNP elimination are summarized in Table 2. SNP with minor allele frequency lower than 5% were discarded (monomorphic SNP ranged from 8% to 12% of the total number of SNP). SNP with callrate <97.5% (~3% of total) were eliminated. SNP out of Hardy–Weinberg (HW; Bonferroni corrected P<0.01) were removed in SB scenarios. SNP that deviated from the HW equilibrium in the MB scenarios (HBS, HB, HS and BS) were retained in order to preserve markers potentially able to discriminate among breeds. Moreover, a high percentage of SNP would have not passed this test in a mixed population. The number of SNP retained after data editing ranged from 36 521 (Brown Swiss) to 39 240 (Holstein) in the case of SB and from 39 615 (BS) to 41 360 (HBS) across breed, respectively (Table 2). For the remaining missing values (<0.5% of the total), alleles were imputed using the most frequent allele at each involved locus within each breed.
Number of SNP retained after data editing and related causes of elimination for Holstein (Hol), Simmental (Sim) and Brown Swiss (Brw) considered both as separate (Hol, Brw, Sim) or pooled population (HBS, BS, HB, HS)
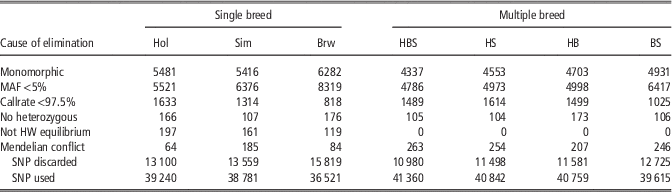
MAF=minor allele frequency; HW=Hardy–Weinberg; SNP=single nucleotide polymorphism.
Animals born before 31 December 2000 were included in the reference whereas those born after 2000 represented the validation either in SB or MB scenarios. Within each MB scenario the reference populations were set up pooling together bulls belonging to different breeds according to the date of birth. The validation population included always the same bulls across different scenarios (634 Holstein, 171 Simmental and 141 Brown Swiss). Phenotypes used were deregressed proofs (DRGP) provided by the three breed associations and calculated separately for each breed. Procedure of Interbull’s deregression were carried out in order to remove the effect of pedigree. Moreover, phenotypes of sires that had daughters in foreign countries were corrected according to the multiple across country evaluation (MACE) enhanced breeding values for Simmental and Brown Swiss. For Holstein a set of effective daughter contributions (EDC) consistent with the set of reliabilities and the pedigree was derived iteratively. Then full animal model deregression was performed using those EDCs by iteratively finding a set of DRGP consistent with the set of proofs. This procedure is similar to Interbull’s deregression, with two differences, namely lack of genetic groups and treating MACE proofs on the Italian scale as if they were domestic proofs (Biffani, personal communication). In order to have SNP effects comparable across breeds, DRGP (within and across breeds) were standardized to mean=0 and s.d.=1. A total of three traits were considered: milk yield (MY), fat yield (FY) and protein yield (PY). Average DRGP reliabilities for yield traits were 0.93±0.02 (0.90±0.04), 0.90±0.07 (0.81±0.06) and 0.88±0.06 (0.85±0.05) in Holstein, Brown Swiss and Simmental reference (validation) bulls, respectively.
PCA
The genotype at each locus was coded as −1 and 1 for the opposite homozygotes and 0 for the heterozygotes, respectively. PCA was carried out by chromosome in the whole population (reference+validation). PC scores were computed separately for each chromosome in the different scenarios (SB or MB) (Pintus et al., Reference Pintus, Gaspa, Nicolazzi, Vicario, Rossoni, Ajmone-Marsan, Nardone, Dimauro and Macciotta2012). This chromosome-wise approach was aimed at handling, whenever possible, full rank correlation matrices. The rank of a matrix is defined as the maximum number of independent rows (or columns). For SNP genotype data matrix, the rank is lower or equal to the minimum value between number of animals and number of SNP. In case of small reference population size, the number of observations << number of SNP. Thus, the marker (co)variance matrix is not full rank, resulting in a reduction of the maximum number of PC that can be potentially extracted. Previous results obtained on simulated data showed no differences in DGV accuracies between chromosome-wide or genome-wide PC extraction (Macciotta et al., Reference Macciotta, Gaspa, Steri, Nicolazzi, Dimauro, Pieramati and Cappio-Borlino2010). Differently from the abovementioned papers, where the number of PC was chosen based on the proportion of variance explained, in the present investigation the MINEIGEN criterion was adopted (Kaiser, Reference Kaiser1960). In particular, for each chromosome a PC was retained if its eigenvalue was greater than the average (i.e. one in the case PC are extracted from correlation matrices). Finally, individual PC scores were calculated combining the eigenvectors of correlation matrices and original genotypes.
GS models
Genomic predictions were obtained within each breed using either all marker genotypes available (SB-SNPBLUP) or PC scores (SB-PC) as predictors. The SB-SNPBLUP was considered as the base scenario for comparison with the other approaches. DGV for the different MB sets also were calculated using either SNP genotypes (MB-SNPBLUP) or PC scores (MB-PC).
SB-SNPBLUP
Effects of the SNP were estimated using the following model:
 $$\bf y=1\mu {\plus}Zg{\plus}e$$
where y is a vector of DRGP standardized across breeds with mean 0 and
 $$\sigma _{y}^{2} =1$$
, 1 a vector of ones, μ the general mean, Z the matrix of SNP genotypes coded as −1, 0 and 1, g a vector of random SNP effects g~N(0, I
m
 $$\,\sigma _{g}^{2} $$
) and e a vector of random residuals e~N(0, I
n
 $\,\sigma _{e}^{2} $
), where m and n are the number of markers and the number of animals, respectively. Variance components
 $$\hat{\sigma }_{e}^{2} $$
and
 $$\hat{\sigma }_{g}^{2} $$
and SNP effects were estimated running a Gibbs sampling using 100 000 cycles and thinning interval of 10 (20 000 samples were discarded as burn in). Estimated variance components were successively used to run a SNPBLUP model. GS3 software was used to perform the analysis (Legarra et al., Reference Legarra, Ricard and Filangi2012).
SB-PC
The effects of PC scores on phenotypes were estimated with model (1) by replacing genotypes with PC scores in Z. For jth breed, mixed model equations were set up using as λ
 $$\lambda ^{j} ={{\sigma _{{ej}}^{2} } \mathord{\left/ {\vphantom {{\sigma _{{ej}}^{2} } {{{\sigma _{{gj}}^{2} } \over {2\mathop{\sum}\limits_i {p_{i}^{j} q_{i}^{j} } }}}}} \right. \kern-\nulldelimiterspace} {{{\sigma _{{gj}}^{2} } \over {2\mathop{\sum}\limits_i {p_{i}^{j} q_{i}^{j} } }}}}$$
where
 $$\sigma _{{ej}}^{2} $$
and
 $$\sigma _{{gj}}^{2} $$
, are variance components estimated using Gibbs sampling and
 $$p_{i}^{j} $$
and
 $$q_{i}^{j} $$
are the allelic frequency at ith locus for the jth breed. (j=Holstein, Brown Swiss or Simmental).
MB-SNPBLUP
Data of MB animals considered as an homogenous population were analyzed according to model (1). A unique set of solutions for SNP effects were estimated and then used to compute DGV of validation animals. The λ ratio for the pooled three-breed population was calculated as weighted average of SB variance components:
 $$\lambda _{{\rm HBS}} ={{{{n_{\rm H} \hat{\sigma }_{{e{\rm H}}}^{2} {\plus}n_{\rm B} \hat{\sigma }_{{e{\rm B}}}^{2} {\plus}n_{\rm S} \hat{\sigma }_{{e{\rm S}}}^{2} } \over {n_{\rm H} {\plus}n_{\rm B} {\plus}n_{\rm S} }}} \over {{{\hat{\sigma }_{{g{\rm H}}}^{2} } \over {2\mathop{\sum}\limits_i {p_{i}^{H} q_{i}^{H} } }}{\plus}{{\hat{\sigma }_{{g{\rm B}}}^{2} } \over {2\mathop{\sum}\limits_i {p_{i}^{B} q_{i}^{B} } }}{\plus}{{\hat{\sigma }_{{g{\rm S}}}^{2} } \over {2\mathop{\sum}\limits_i {p_{i}^{S} q_{i}^{S} } }}}}$$
where n
h
, n
b
and n
s
are the population size for Holstein, Brown Swiss and Simmental, respectively;
 $$\hat{\sigma }_{{ej}}^{2} $$
and
 $$\hat{\sigma }_{{gj}}^{2} $$
are the estimated variance components (j=Holstein, Brown Swiss or Simmental, respectively);
 $$p_{i}^{j} \matrix{ {} \cr } q_{i}^{j} $$
are the allelic frequencies at ith locus for the jth breed. λ ratios for the other MB combinations were calculated in the same way.
MB-PC
Effects of PCs were estimated with model (1) by replacing SNP genotypes with PC scores in Z. Different λ ratios were calculated for each MB scenario following the approach of MB-SNPBLUP.
For each model, MME were solved by using a Gauss–Seidel iterative method. SNP or PC effects (ĝ) were then used to calculate DGV of validation bulls as:
 $$\rm DGV=\mu {\plus}Z\vskip-3pt\hat{\vskip3pt\bf g}$$
Assessment of model accuracy
Pearson correlation coefficients between DGV and DRGP (r
DGV) scaled by the squared root of the mean DRGP reliability (REL
drgp
), were used to evaluate DGV accuracy
 $(r_{{{\rm DGV}}} ={{r_{{{\rm DRGP,DGV}}} } \mathord{\left/ {\vphantom {{r_{{{\rm DRGP,DGV}}} } {\sqrt {{\rm REL}_{{{\rm DRGP}}} } }}} \right. \kern-\nulldelimiterspace} {\sqrt {{\rm REL}_{{{\rm DRGP}}} } }})$
. The scaling was aimed at accounting for inaccuracy of the phenotypes used in the genomic evaluation (Hayes et al., Reference Hayes, Bowman, Chamberlain and Goddard2009b; Calus et al., Reference Calus, de Haas and Veerkamp2013). It does not have any effect on r
DGV when REL
drgp
is equal to 1. Furthermore, the correlation between DRGP and pedigree index (PI) was calculated (r
Pl). Slope of the regression of DRGP on DGV (b
DGV) was also calculated to evaluate the different models. Both r
DGV and b
DGV were calculated separately for each breed, for both SB and MB scenarios.
Results
PCA
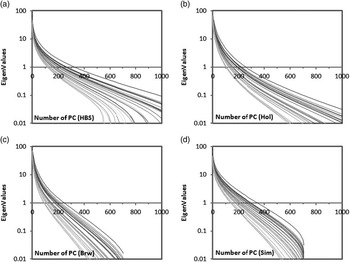
The patterns of eigenvalues obtained for the different chromosomes in the SB and MB scenarios are reported in Figure 1. This is a useful tool for a visual detection of PC that met the eigenvalue >1 criterion. PC are extracted in order to maximize successively the amount of the original variance explained. Hence, the first component has the largest eigenvalue (i.e. the variance accounted for), the second PC the maximum after the first, and so on. Thus, the plot of eigenvalues is commonly characterized by a drop as the PC extraction proceeds. In the present study, such a drop was more pronounced for the breeds with the smallest number of genotyped animals (i.e. Simmental and Brown Swiss).
Pattern of eigenvalues as function of number of principal components extracted: each line represents the eigenvalues on logarithmic scale for each of the 29 chromosomes analyzed for the combination of the three breeds (a), Holstein (b), Brown (c), Simmental (d).

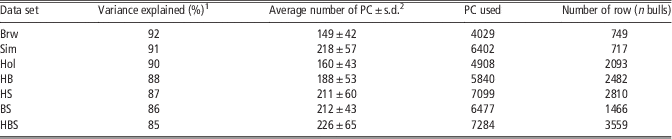
The variance accounted for by retained PCs varied from 0.85 (±0.01) in HBS to 0.92 (±0.01) in Brown Swiss scenario, corresponding to 7284 and 4029 PC, respectively. The average number of PC retained per chromosome ranged from 149±42 (Brown Swiss) to 226±65 (HBS). The Simmental showed the largest number of PC in comparison with the small size of its population (Table 3).
Average variance explained by principal component (PC; %) for single breed and multiple breed data sets, average number of PC by chromosome and total number of PC used
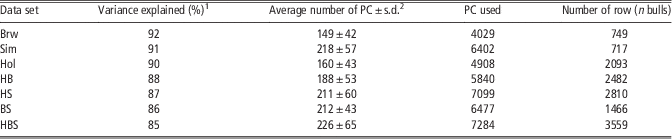
Brw=Brown Swiss; Sim=Simmental; Hol=Holstein; HB=(Hol+Brw); HS=(Hol+Sim); BS=(Brw+Sim); HBS=(Hol+Brw+Sim).
Number of rows of chromosome-wise single nucleotide polymorphism data matrices.
1 Variance explained by all PCs which eigenvalues was >1 averaged by 29 chromosomes (s.d. 1%).
2 These values represent the average across 29 chromosomes.
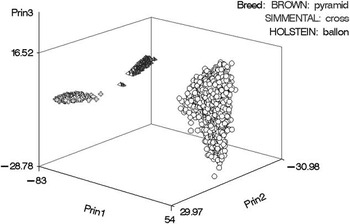
Figure 2 reports individual PC scores for the first three PCs. Although they were able to explain only about 9% of the original variance, the three breeds are clearly separated. In particular, the first PC separates Holstein from the other two breeds, whereas Brown Swiss and Simmental clustered in two different group along the second PC. The third PC summarizes the interior variability of the largest group of bulls (Holstein).
Plot of the individual scores that animals belonging to different breeds obtained on the first three principal components (PCs) (variance explained by PC1=5.1%, PC2=2%, PC3=1.6%).

Genomic prediction accuracy
SB-SNPBLUP
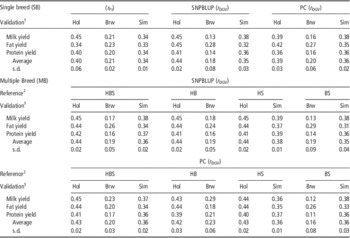
DGV accuracies for both SB and MB scenarios are reported in Table 4. In the SB scenarios the accuracy varied across breeds and traits. The highest value was observed in Holstein, the lowest in Brown Swiss. The accuracy of DGV was in most cases higher than accuracy of PI. However, in Brown Swiss r DGV was lower than r Pl for MY and PY (Table 4).
Realized pedigree index accuracy (r PI) and DGV accuracy (r DGV) for milk, fat and protein yield in single breed or multiple breed approach

DGV=direct genomic value; PC=principal component; SNP=single nucleotide polymorphism; PCA=principal component analysis; Hol=Holstein; Brw=Brown Swiss; Sim=Simmental; HBS=Hol+Brw+Sim; HB =Hol+Brw; HS=Hol+Sim HS; BS=Brw+Sim.
DGV accuracy (r DGV) for SB approach using the whole set of markers (SB-SNPBLUP) or PCA approach (SB-PC). MB DGV accuracy using SNPBLUP (MB-SNPBLUP) or PCA approaches (MB-PC) for different combination of reference population.
1 Hol (n=634); Brw (n=141); Sim (n=171).
2 HBS (n=2299); HB (n=1805); HS (n=1917); BS (n=873).
SB-PC
PCA reduced the number of predictors by 85% (±3%) on average. However, r DGV for Holstein decreased by about 5% when PC scores instead of SNP genotypes were used as predictors. Conversely, the application of PCA did not affect r DGV in the other two breeds (Table 4).
MB-SNPBLUP
The combination of a MB reference population with the SNPBLUP model did not affect the average r DGV in comparison with the SB scenario. If compared with SB-SNPBLUP, the maximum r DGV difference were +3% (HS) in Simmental validation. With the exclusion of Holstein, the application of MB-SNPBLUP produced similar r DGV if compared with SB-PC.
MB-PC
In general, the use of a MB-PC slightly affected r DGV compared with the other models. In Holstein, an average r DGV difference of +4% (v. SB-PC), −1% (v. SB-SNPBLUP) and no difference (v. MB-SNPBLUP) were observed when HBS instead of SB was used as reference, respectively. Average accuracy did not change in Simmental for MB-PC scenario, whereas slight differences of r DGV were observed compared with MB-SNPBLUP. Increases of 2% and 5% (v. SB-SNPBLUP) were observed for Brown Swiss using HBS and HB reference population, respectively. However, an average decrease of 2% (v. SB-PC) and 4% (v. SB-SNPBLUP) was found using BS as reference (Table 4). Looking at MB scenarios, most of the results are fairly comparable. MB-PC average r DGV difference spanning from −3% (BS) up to +4% (HB) if compared with MB-SNPBLUP in Simmental and Brown Swiss validation set, respectively.
As far as DGV accuracy across traits is concerned, no clear pattern may be observed in the different MB scenarios (Table 4). The use of MB-PC was advantageous for Brown Swiss over SB for MY and PY. For instance, r DGV of MY nearly doubled when Holstein were also present in the reference (HB +13% and +16% v. SB-PC and SB-SNPBLUP, respectively). These gains were reduced (+7% SB-PC and +10% SB-SNPBLUP) when also Simmental was included in the reference (HBS scenario), whereas a drop in r DGV was observed by combining Brown Swiss and Simmental (−4% SB-PC and −1% SB-SNPBLUP). A similar pattern can be observed for PY, with gain of reduced magnitudes. Conversely, a reduction of r DGV was obtained for FY in all MB scenarios especially when Holstein bulls were in the reference population (−9% HB, −7% HBS and −1% BS, respectively). Accuracy of DGV increased across different MB scenarios for yield traits in Holstein: up to 6%, 5% and 2% for MY, PY and FY, respectively (HBS reference).
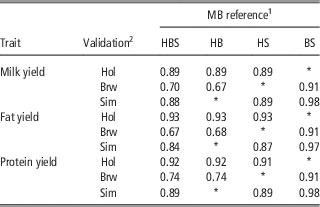
Pearson correlations between DGV for validation bulls calculated using MB-PC or SB-PC approaches are reported in Table 5. Across traits and MB reference population, the correlation ranged from 0.89 to 0.93, from 0.67 to 0.91 and from 0.88 to 0.98 for Holstein, Brown Swiss and Simmental, respectively. Very similar values for different validation set were observed across traits. Holstein did not show variation of correlations among different MB references and presented the highest value for FY (0.93). DGV calculated for Simmental using BS reference were highly correlated with DGV estimated using Simmental only for all the traits (>0.97). The correlation among SB and MB DGV of Brown Swiss were lower for the breed combinations HB and HBS (from 0.67 to 0.74 depending on the trait) in comparison with the breed combination BS (0.91).
Pearson correlations among direct genomic values calculated for yield traits in validation bulls using single breed and multiple breed (MB) reference population
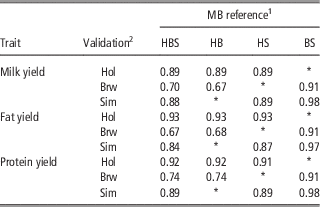
HBS=Hol+Brw+Sim; HB=Hol+Brw; HS=Hol+Sim HS; BS=Brw+Sim; Hol=Holstein; Brw=Brown Swiss; Sim=Simmental.
1 HBS (n=2299); HB (n=1805); HS (n=1917); BS (n=873).
2 Hol (n=634); Brw (n=141); Sim (n=171).
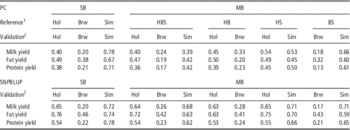
Table 6 reports the regression slopes of DRGP on DGV in SB and MB scenarios using SNPBLUP or PC approaches. For SB-PC and MB-PC, the regression slopes were fairly <1 for all scenarios denoting a bias of prediction. No substantial changes were observed for Holstein passing from SB to MB. In general, the bias of prediction was higher both in Brown Swiss and Simmental when MB-PC genomic evaluations were carried out, with a generalized reduction of the regression coefficients.
Regression slopes of deregressed proofs on direct genomic value (bDGV) for single breed (SB) and multiple breed (MB) approach for yield traits using principal component (PC) or SNPBLUP methods

SNP=single nucleotide polymorphism; HBS=Hol+Brw+Sim; HB=Hol+Brw; HS=Hol+Sim HS; BS=Brw+Sim; Hol=Holstein; Brw=Brown Swiss; Sim=Simmental.
1 HBS (n=2299); HB (n=1805); HS (n=1917); BS (n=873).
2 Hol (n=634); Brw (n=141); Sim (n=171).
DGV estimates of the SNPBLUP models were biased as well, albeit that the magnitude of the bias was smaller than for the PC models.
Discussion
PCA
In the present work a multivariate SNP reduction method was tested both in SB and MB populations and compared with the conventional approach of using SNP genotypes as predictors.
The determination of the number of components to retain represents a crucial problem that researcher must handle when using PCA. In fact, an incorrect choice may imply the under-extraction of components, can lead to the loss of relevant information and it is likely to introduce distortion in the solutions (Ledesma and Valero-Mora, Reference Ledesma and Valero-Mora2007). On the other hand the extraction of a redundant number of PC may also be possible with less serious consequences. In the current investigation, the number of retained PC was based on the definition of a threshold for eigenvalues extracted from chromosome-wise SNP correlation matrices. Cross-validation procedures or Monte Carlo simulations are often used to establish the significant number of PC (Ledesma and Valero-Mora, Reference Ledesma and Valero-Mora2007). In GS framework, different approaches have been proposed. For instance, in supervised PC regression proposed by Long et al. (Reference Long, Gianola, Rosa and Weigel2011), a panel of SNP was preselected according to associations with phenotypes and then PC were extracted. An increase of genomic prediction accuracy was observed for PC extracted from the selected SNP panel in comparison with the PCA carried out on the whole set of SNP (Long et al., Reference Long, Gianola, Rosa and Weigel2011). However, in this approach the number of retained PC may change across phenotypes. Whereas, The MINEIGEN criterion was adopted in the present work for identifying the optimum amount of variance accounted for PC in data sets of different size and for any traits. Despite some criticism on the MINEIGEN criterion, it is still valid for decomposition of correlation matrix with unities at the diagonal elements (Ledesma and Valero-Mora, Reference Ledesma and Valero-Mora2007).
The retained PC were able to explain comparable amounts of variance (~90%) in the three breeds for the SB scenario. Despite that, a higher number of PC were found for Simmental. This feature was already observed in our previous work (Pintus et al., Reference Pintus, Gaspa, Nicolazzi, Vicario, Rossoni, Ajmone-Marsan, Nardone, Dimauro and Macciotta2012) and it can be explained by differences in the genetic structure of this population (e.g. LD pattern, see discussion), or by an overestimation of the significant number of PC able to best explain original correlation among SNP variables (Ledesma and Valero-Mora, Reference Ledesma and Valero-Mora2007). Although the number of PC retained was higher than previous reports (Long et al., Reference Long, Gianola, Rosa and Weigel2011; Pintus et al., 2012) a considerable reduction of the predictor dimensionality was achieved though.
Genomic prediction accuracy
SB approach
The average DGV accuracy for SB-SNPBLUP model in Holstein, Brown Swiss and Simmental reflects somehow the difference in the size of the reference populations, as previously observed in the same (Pintus et al., Reference Pintus, Gaspa, Nicolazzi, Vicario, Rossoni, Ajmone-Marsan, Nardone, Dimauro and Macciotta2012; Pintus et al., Reference Pintus, Nicolazzi, Van Kaam, Biffani, Stella, Gaspa, Dimauro and Macciotta2013) or other Holstein populations of similar size (VanRaden et al., Reference VanRaden, Van Tassell, Wiggans, Sonstegard, Schnabel, Taylor and Schenkel2009).
The application of SB-PC in Holstein resulted in a large reduction of predictor dimensionality, with some negative effects on predictive ability. The reduction in r DGV were systematic, and probably related to the number of retained PC. A substantial equivalence among PC and other methods was highlighted, in our previous work, when a larger number of PC was extracted (15 609 v. 4908 used in the present paper) (Pintus et al., Reference Pintus, Nicolazzi, Van Kaam, Biffani, Stella, Gaspa, Dimauro and Macciotta2013). Conversely, no substantial changes (or slight improvement) in r DGV were observed in Simmental and Brown Swiss in comparison with SB-SNPBLUP. For Simmental, the r DGV of PY was lower than values obtained by Gredler et al. (Reference Gredler, Nirea, Solberg, Egger-Danner, Meuwissen and Sölkner2009) and Gredler et al. (Reference Gredler, Schwarzenbacher, Egger-Danner, Fuerst, Emmerling and Sölkner2010) using a partial least squares regression approach. However, in both cases the reference population size was larger than in the present work (1091 and 2477 bulls, respectively). DGV accuracies for Brown Swiss were consistent with our other previous work, but lower than those reported in literature. For instance the r DGV for PY was 0.16 in comparison with 0.32 (Olson et al., Reference Olson, VanRaden and Tooker2012), 0.55 (Olson et al., Reference Olson, VanRaden, Tooker and Cooper2011) and 0.60 (Jorjani et al., Reference Jorjani, Jakobsen, Hjerpe, Palucci and Dürr2012) using reference population of 506 (US), 1056 (US) and 4800 (InterGenomics) Brown Swiss bulls, respectively. This fact clearly denotes the effect of population size on DGV accuracy.
MB approach
The application of MB slightly improved average r DGV of yield traits in comparison with SB-PC. Across MB scenarios, MB-SNPBLUP and MB-PC performed similarly. The r DGV for Holstein were lower than those reported by Hayes et al. (Reference Hayes, Bowman, Chamberlain, Verbyla and Goddard2009a) even if they used less animals in the reference. In a study by Pryce et al. (Reference Pryce, Gredler, Bolormaa, Bowman, Egger-Danner, Fuerst, Emmerling, Solkner, Goddard and Hayes2011), after a further enlargement of the previous MB reference population (including Holstein, Simmental and Jersey) no substantial changes in the r DGV were recorded for milk production traits.
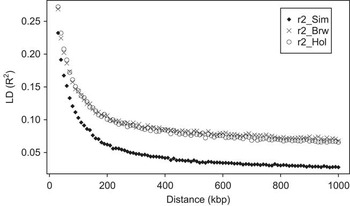
Looking at specific traits, some interesting results came up, even if without a clear and constant pattern across MB scenarios. Difference among traits are probably due to the sampling effect owing to the reduced size of the population involved in the present work. However, interesting pattern in r DGV can be observed among traits. The highest gain in r DGV for MY and PY was observed by pooling Holstein and Brown Swiss population together. A partial decrease was observed when Simmental was added to the data set (HBS), whereas the combination BS gave the worst results. Brown Swiss and Simmental together presented the largest difference at LD level (Figure 3), and this could explain the reduced accuracy of milk traits from their combination.
Pattern of linkage disequilibrium (LD) within 1000 kbp of distance among all pairs of marker for Holstein (Hol), Brown Swiss (Brw) and Simmental (Sim), values reported are the average r 2 across 29 chromosomes.

Presented results are in agreement with reports on Nordic Red Cattle (Brondum et al., Reference Brondum, Rius-Vilarrasa, Stranden, Su, Guldbrandtsen, Fikse and Lund2011). In particular, MB genomic evaluation produced gain of 7% and 9% for MY (+10% for PY) in Swedish and Finnish validation populations, respectively. Adding a third breed (Danish Red) sometime was beneficial for the other two breed, whereas just slight gain in accuracy were recorded for Danish itself, across different traits. Their results probably rely on similar LD among breeds (0.20) (Brondum et al., Reference Brondum, Rius-Vilarrasa, Stranden, Su, Guldbrandtsen, Fikse and Lund2011) and particularly on reduced genetic distances between Swedish and Finnish cattle. In fact, these two breeds are of the Ayrshire type, while the Danish Red has some old influence from Brown Swiss and Holstein (Brondum et al., Reference Brondum, Rius-Vilarrasa, Stranden, Su, Guldbrandtsen, Fikse and Lund2011). A similar pattern may be observed in our data set for two traits under control of many genes such as PY and MY. Indeed, Brown Swiss and Holstein have similar LD patterns (Figure 3) and probably this similarity makes possible to pick up QTL effects across breeds using PCA. However, this conclusion is not supported by the literature. For instance, in US Brown Swiss just a slight increase of accuracy was achieved by adding Holstein in the reference population. This fact was probably due to small contribution (<10%) of Brown Swiss to the whole MB population (Olson et al., Reference Olson, VanRaden and Tooker2012) in comparison with our data set (30% and 20% of Brown Swiss in HB and HBS, respectively).
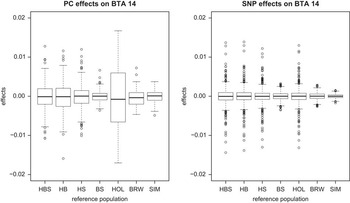
If MY and PY showed an increase of accuracy in MB scenarios, opposite behavior was observed for FY, specially for MB-PC approach. The genetic background of FY may explain these results. It is known that a polymorphism in DGAT1 gene (BTA14) explains >40% of genetic variance of FY, whereas the genetic background of MY and PY is markedly polygenic. Despite DGAT1 polymorphism is not included in the 54K panel, SNP markers in LD with this gene can capture part of its genetic variance. DGAT1 is segregating in the Italian Holstein population, but not in Italian Brown Swiss (Scotti et al., Reference Scotti, Fontanesi, Schiavini, La Mattina, Bagnato and Russo2010). Hence, PC effects mighty be biased by the fact that in Italian Brown Swiss and Italian Simmental one of the allele is fixed. This hypothesis need to be verified but the comparison with PC effects on BTA14 both in SB and MB scenarios might have led to such conclusion (Figure 4). In fact, no large effects were observed on BTA14 for Italian Brown Swiss and Italian Simmental. Conversely, in Holstein a big PC signal was found on BTA14 as well as in any MB scenario including Holstein.
Boxplots of principal components or single nucleotide polymorphism effect estimates for fat yield in BTA14 in single breed (Hol, Sim, Brw) or multiple breed reference population (HBS, HB, HS and BS).

In general, prediction biases were observed in our model. In all cases regression slopes of DRGP on DGV were lower than one, indicating inflation of variance for all prediction methods. An optimal prediction would led to regression slope of 1, in the present work the DGV estimates are inflated in both MB and SB scenarios, even if BLUP estimates presented b DGV coefficients slightly higher than PC scenarios. A clear pattern across traits and scenarios hardly can be identified, likewise other MB papers (Brondum et al., Reference Brondum, Rius-Vilarrasa, Stranden, Su, Guldbrandtsen, Fikse and Lund2011). Moreover, prediction bias increased for MB in comparison with either SB analysis in the present paper or other work involving the same populations (Pintus et al., Reference Pintus, Gaspa, Nicolazzi, Vicario, Rossoni, Ajmone-Marsan, Nardone, Dimauro and Macciotta2012 and Reference Pintus, Nicolazzi, Van Kaam, Biffani, Stella, Gaspa, Dimauro and Macciotta2013), and this could be also due to the increase of the dimensionality of predictors. Another possible explanation is related to the expected value of slopes: b DGV is 1 only if the genotyped animals are a representative sample of the animals population in the corresponding age classes (Mäntysaari et al., Reference Mäntysaari, Liu and VanRaden2011; Patry et al., 2013). For Simmental and Brown almost all the available bulls were genotyped, whereas a bias can be introduced by selecting the Holstein bulls from a larger population. Probably, in MB reference population (with a higher proportion of Holstein) an expected values for b DGV different from 1 could be hypothesized, depending on selective genotyping of bulls. Biases in genomic predictions can also be because of the multi-step GS procedure in population under selection. The application of prediction equations developed in training population using pseudo-phenotypes as observations (DRGP) was claimed to introduce bias in the DGV (Vitezica et al., 2011). Inflation of DGV variance were also observed in other works that use multivariate regression methods for genomic prediction. For instance, Solberg et al. (Reference Solberg, Sonesson, Woolliams and Meuwissen2009) found that the b DGV decreases as the number of latent variables used grew. In multivariate context, this problem can be overcome by cross-validation to identify the number of PC that provide unbiased estimate of DGV (Solberg et al., Reference Solberg, Sonesson, Woolliams and Meuwissen2009).
General discussion
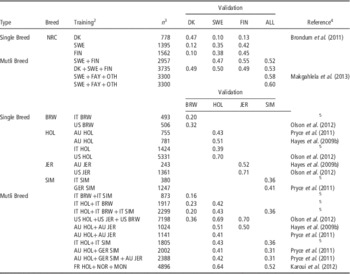
The summary of DGV accuracy as function of the reference population size, obtained in the present work, together with some of the results retrieved from recent literature is presented in Table 7. The increase in population size pooling together MB populations gave rise just to slight increase in DGV accuracy according to most of reported results. Figures in Table 7 might suggest that MB approach works better when breeds are not too genetically distant, especially for some of the Nordic Red Cattle. For reference population of reduced size, an apparent overestimations of DGV accuracy was observed for some breeds, whereas there are other cases of underestimation as Brown Swiss in our data. Actually, a possible explanation for this apparent overestimation can be found in the different strategy for the calculation of GEBV reliability implemented in diverse genomic evaluation softwares.
Average genomic selection accuracyFootnote 1 across yield traits as function of the size of the reference population

DGV=direct genomic value; PC=principal component; NRC=Nordic Red cattle; BRW=Brown Swiss; HOL=Holstein; JER=Jersey; SIM=Simmental or Fleckvieh; DK=Danish; FIN=Finnish dairy cattle; SWE=Swedish Red dairy cattle; FAY=Finnish Ayrshire; OTH=other breeds; AU HOL=Australian Holstein; AU JER=Australian Jersey; GER SIM=Austrian & German Fleckvieh; FR HOL=French Holstein; MON=Monbeliarde; NOR=Normande; US HOL=US Holstein; US JER=US Jersey; US BRW=Brown Swiss; IT HOL=Italian Holstein; IT SIM=Italian Simmental; IT BRW=Italian Brown Swiss.
Data for DGV accuracy for milk, protein and fat yield were averaged from recent literature on multiple-breed genomic selection.
1 DGV accuracy were expressed as simple correlation. Squared correlation from literature were converted using the square root of the published values.
2 Reference populations used in within- or across-breed genomic predictions.
3 Number of animals of different reference populations used in within- or across-breed genomic predictions.
4 References of the corresponding figures.
5 Refers to the results presented in the current papers applying PC multiple-breed approach.
In order to try to explain these results of accuracy the within breed LD level was investigated. The patterns of LD in Simmental and Holstein populations are in agreement to the finding of Pryce et al. (Reference Pryce, Gredler, Bolormaa, Bowman, Egger-Danner, Fuerst, Emmerling, Solkner, Goddard and Hayes2011) in Australian Holstein and German Fleckvieh. The LD values at the average marker distance in the 54K panel (about 67 kbp) were similar between Brown Swiss and Holstein (0.19) and slightly lower in Simmental (0.15). For the latter a lower LD persistency was also observed, with a sharp drop of LD over short distance in comparison with Holstein and Brown Swiss. Although Simmental had similar number of genotyped bulls compared with Brown Swiss, its effective population size (N e ) is greater. That was expected to have a negative effect on the accuracy of genomic prediction of Simmental but did not. A possible explanation is that a fair number of Brown Swiss bulls (~1/4) were born before 1980 (and the oldest bull dates 1960) in contrast to the Simmental and Holstein reference population whose bulls were more closer to each other (Pintus et al., Reference Pintus, Gaspa, Nicolazzi, Vicario, Rossoni, Ajmone-Marsan, Nardone, Dimauro and Macciotta2012 and Reference Pintus, Nicolazzi, Van Kaam, Biffani, Stella, Gaspa, Dimauro and Macciotta2013). Another possible explanation could be found in the influence of relatedness between reference and validation populations (96 and 70 father–son pairs were included in the Brown Swiss and Simmental population, respectively) as also hypothesized by Habier et al. (Reference Habier, Tetens, Seefried, Lichtner and Thaller2010) and Pszczola et al. (Reference Pszczola, Strabel, Mulder and Calus2012).
Conclusions
Results of the present study showed a slight average increase of DGV accuracy in the MB approach compared with the SB, although differences have been observed between breeds. In particular, r DGV seemed to be quite in agreement to the theoretical expectation for Holstein, whereas Simmental did not exhibit gains in accuracy using a MB reference population. Brown Swiss showed an increase of DGV accuracy in MB scenarios for PY and MY and a decrease for FY. Differences in the LD structure of the three breeds and in their sample size may at least partially explain these results. Within the MB approaches, basically no clear differences in DGV accuracy were observed between the use of SNP genotypes or PC scores as predictors.
Acknowledgment
Research funded by the Italian Ministry of Agriculture (grant INNOVAGEN) and by the Fondazione CARIPLO (grant PROZOO). The research leading to these results has received funding from the European Union’s Seventh Framework Programme (FP7/2007-2013) under grant agreement No. 289592 – Gene2Farm. Authors wish also to acknowledge Italian Holstein (ANAFI), Brown Swiss (ANARB) and Simmental (ANAPRI) association for providing phenotypic data.