Political experience is a double-edged sword for any politician who dares to swing it. On the one hand, experienced politicians have long public records of decisions that can easily be exploited by skillful opponents. They are also vulnerable to charges that they are “career” politicians or, in the case of congressional and presidential campaigns, “Beltway” politicians. On the other hand, experience increases name recognition, fundraising ability, and seniority, which for legislators can mean more opportunities to send money back to home states. Experienced incumbents in Congress are rarely ever beaten (Jacobson Reference Jacobson1983; King Reference King1991).
One of the central questions facing voters in the 2008 presidential campaign was how much value political experience adds to a candidate's resume. Senator Hillary Clinton, the early Democratic Party frontrunner, made her life in politics the cornerstone of her campaign strategy. “Ready to lead on day one” was a key line in Clinton's stump speech, stressing her proximity to power and the lessons she had learned through direct observation. “What I believe is that my experience and my unique qualifications on both ends of Pennsylvania Avenue equip me to handle the problems of today and tomorrow,” she told the moderator of a Democratic debate in Ohio (New York Times 2008).Footnote 1 For the media, the experience question became a running narrative throughout the primary season (Nicholas Reference Nicholas2007; Noah Reference Noah2008; Healy Reference Healy2007; Baker and DeYoung Reference Baker and DeYoung2008). In the end, Democratic voters decided that experience—or at least Hillary Clinton's experience—was overrated. In her place, they chose one of the least experienced presidential candidates in American history, Barack Obama, who downplayed his own political career, largely because he barely had one. Voters seemed to care little that four years before announcing his run for president, he had been an unknown Illinois state legislator. Obama himself asked voters to assess his presidential potential on the basis of his judgment, promises, biography, and experiences outside Washington, or even Springfield, Illinois, for that matter.
In this article, I analyze the value of experience. More specifically, I ask: Is political experience associated with presidential greatness? If so, what kind of political experience? Legislative, executive, judicial, or civil service and administrative experience? Experience at the federal or state and local levels? All of these factors, from presidential greatness to various forms of political experience, are difficult to identify and measure for social scientific purposes. Although I rely on subjective measures for these factors, they represent a consistent and reasonable first attempt at addressing the question. Political science journals have not spent much time assessing presidential greatness or its link to experience (for exceptions, see White Reference White1990; Schlesinger, Jr. Reference Schlesinger1997). Surveys of historical scholars have been used to rank presidents since Reference Schlesinger1948, when historian Arthur Schlesinger, Sr., asked 55 scholars to rank the U.S. presidents and published the results in Life magazine. Since then, ranking presidents has become a popular parlor game and a sure way to generate media buzz and controversy. Since 1948, academics have conducted 13 additional surveys ranking presidents.Footnote 2
In order to gain leverage on my research question, I use seven prominent surveys of historical and political scholars across the ideological spectrum, to measure presidential greatness, perhaps the most subjective factor of all.Footnote 3 Each survey was published at some point between 1994 and 2009, so that it could include at least 41 presidents.Footnote 4 This list includes the recent C-SPAN survey, conducted after Barack Obama's victory over George Bush, and announced in early 2009. To take advantage of variations between surveys, I use a multilevel approach that can make multiple assessments of greatness and maximize the amount of information to be gleaned about the value of political experience. Relevant variations could be in the form of the mix of scholars invited to rank presidents or the year the survey was conducted.
DATA
I measure experience as the number of years served in 11 broad categories of political positions: (1) governor, (2) mayor, (3) member of U.S. Congress, (4) member of a state legislature, (5) federal attorney or judge, (6) state attorney or judge, (7) federal administrator,Footnote 5 (8) state administrator, (9) diplomat,Footnote 6 (10) general,Footnote 7 and (11) soldier.Footnote 8 I also include a broad twelfth category for work experience in the private sector.Footnote 9 Although a critic may argue that the number of years served does not capture the quality of that experience, underemphasizes a sharp politician's capacity to learn a great deal in a short period, and ignores specific political or private sector achievements, it does provide a consistent benchmark for measuring presidents. In addition, the goal of this study is to measure the effect of experience—not innate political ability—and the amount of time spent in or away from politics and in or out of specific political institutions should be highly correlated with the volume and range of different political issues that are likely to be useful once a person becomes president, regardless of political skill.
Drawing from online encyclopedia biographies of presidents, I compile years of experience on the basis of full-time work. I recognize that this is a problematic approach for some positions, particularly those in the nineteenth century, when the U.S. government and most state governments had yet to be institutionalized and professionalized (Polsby Reference Polsby1968). For example, most nineteenth-century legislators spent only a few months each year legislating in the U.S. or state capitals and the rest of the time back home in a private profession.Footnote 10 Nevertheless, I treat a two-year legislative term in 1860 in the same manner as a two-year term in 1960. I separate political experience at the national or federal levels from political experience gained at the state and local levels.Footnote 11 I exclude years spent working or volunteering for political parties because of incomplete records.
Descriptive Statistics and Hierarchical Model
Among academics, there is a strong consensus about the country's best presidents. The top three rankings in all seven surveys are some order of George Washington, Abraham Lincoln, and Franklin Roosevelt. Considering the wide range of political experiences between these three men—Washington served 32 years as a soldier, general, and legislator; Roosevelt was elected governor and appointed as an assistant secretary of the Navy; and Lincoln spent most of his political life in the Illinois state House—at first glance, it appears that an unusual environment of political, social, or economic crises is a prerequisite for greatness. Beyond the top trio, there is considerable stability among the next seven to nine presidents. Thomas Jefferson, Andrew Jackson, James Polk, Theodore Roosevelt, Woodrow Wilson, and Harry Truman generally make the top 10. In recent years, Dwight Eisenhower, Lyndon Johnson, and Ronald Reagan have begun to move up. Few qualities, either in experience, height, age, IQ, education, or self-restraint in one's personal life, are shared among these presidents (Schlesinger, Jr. Reference Schlesinger1997).
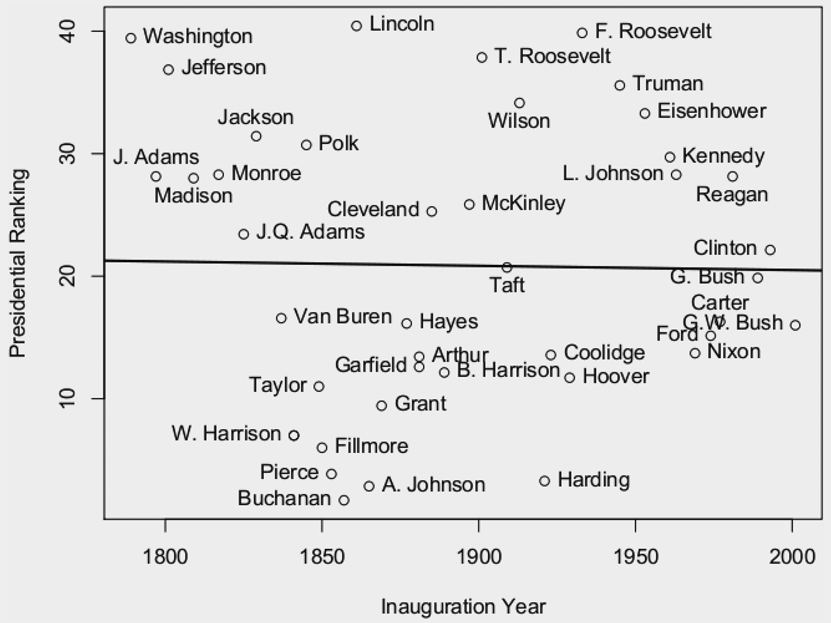
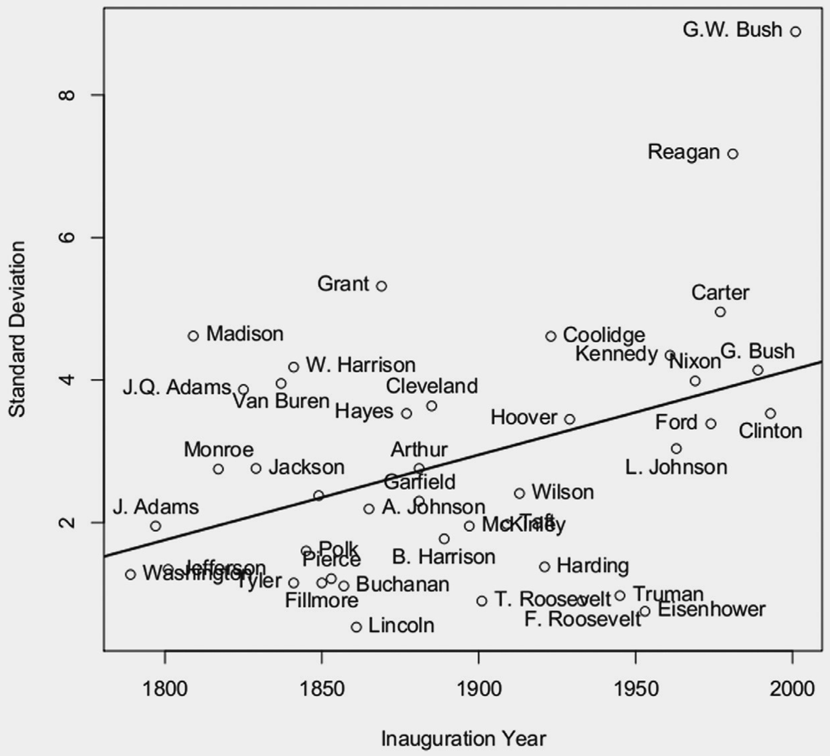
Figure 1 plots presidential rankings (summarized as an average of all seven surveys) and makes clear that great presidents have occurred throughout American history. Time has not been a strong indicator of greatness, as is clear from the bivariate regression line of ranking on inauguration year. Disagreement about a president's rank is related to time, as shown in figure 2, with the ranking standard deviation between the surveys increasing with time. This relationship may reflect the difficulty that scholars have in assessing the recent past. George W. Bush hovered around the rank of 20 in two surveys conducted earlier in his presidency, but plummeted to 36 in the recent C-SPAN survey. Because academic surveys of presidents are relatively new, it is hard to generate a large sample of presidents whose ranking changes can be analyzed over time.Footnote 12
Scatterplot of Presidential Rankings Averaged over the Seven Surveys versus Inauguration Year
Note. For visual purposes, rankings are reversed so that better presidents received higher numbers. Bivariate regression line is shown with a solid black line.

Scatterplot of Ranking Standard Deviation versus Inauguration Year
Note. Bivariate regression line is shown with a solid black line.

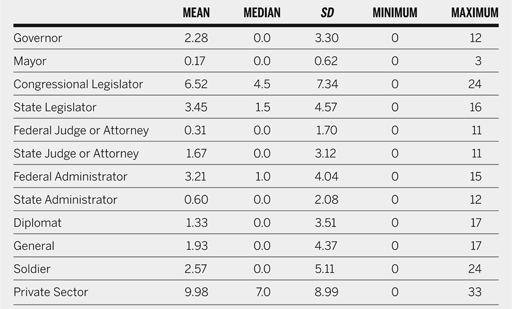
As the Washington-Roosevelt-Lincoln trio suggests, political experiences vary widely among the 43 presidents. As table 1 indicates, the most common previous experience among presidents is congressional service, which 27 presidents have had. A federal, nonelected administrative position is the next most common experience, with 24 presidents having served in some civil service capacity, mostly as a member of the cabinet or as vice president. Twenty-two presidents were elected to a state legislative post, although the bulk of these presidents served during the eighteenth and nineteenth centuries—eras, it should be noted, when the low level of professionalization in state houses equaled that in Washington. The least widely shared political experience is that of mayor. Only Andrew Johnson, Grover Cleveland, and Calvin Coolidge were elected mayor of mid-sized cities. All of the variables have long right tails. None are strongly correlated with each other.
Descriptive Statistics of Political Experience

The correlation between the surveys, however, is strong, ranging from 0.88 to 0.99. This comports with qualitative assessments that find stability in the rankings with a few notable exceptions like Truman, Eisenhower, and perhaps Reagan, who have steadily moved up from initial mid-levels (Pfiffner Reference Pfiffner2003). The limited variation in scholarly assessment of most presidents may help settle debates about good and bad presidents, but it undercuts the principal advantage of a multilevel model, which is to take advantage of contextual differences that influence the dependent variable. Still, I set up a two-level model with individual presidents serving as the first level, the 12 political and private experiences serving as independent variables, and the surveys themselves serving the second level. I estimate a three-chain varying-intercept, varying-slope model, using a Wishart distribution to model the correlation between variables and slopes. Independent variables are assigned non-informative priors. Calculations are made by JAGS called from the software R, with a 12,000 iteration burn-in and a 45,000 iteration simulation. Visual evidence indicates convergence of relevant parameter estimates. For comparative purposes, I also estimate pooled and unpooled regression models.
DISCUSSION
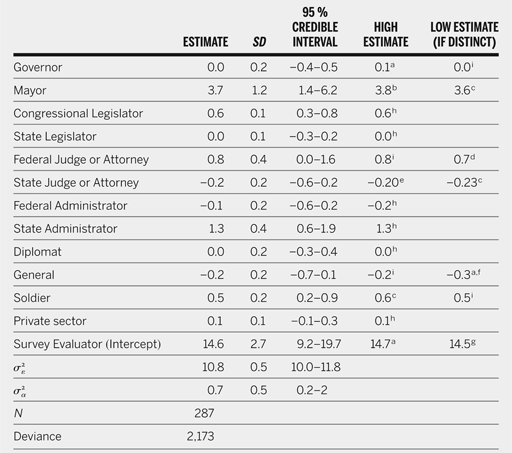
The parameter estimates for all independent variables are similar across the pooled, unpooled, and multilevel models. For purposes of space, I show the multilevel model estimates, which include mean parameter estimates, and, when appropriate, the high and low survey for each variable in table 2. The intercept difference between surveys is about 0.2, and the range of slopes for each variable is typically within 1% or 2% of the mean estimate value for a given variable. Because of the strong positive correlation between the surveys, using the pooled regression estimates is an adequate substitute for time-pressed researchers.
Effect of Political Experience on Presidential Ranking: Multilevel Estimates

Note.
a C-SPAN 2009.
b 1994 Siena survey, Lonnstrom and Thomas 2003.
c 2002 Siena survey, Lonnstrom and Thomas Reference Lonnstrom and Thomas2003.
d Wall Street Journal/Federalist Society survey, WSJ 2000.
e Ridings and McIver Reference Ridings and McIver1997.
f Wall Street Journal/Federalist Society survey, WSJ 2005.
g C-SPAN 1999.
h All evaluators.
i Other surveys.
Overall, the results suggest that political experience is more of a liability than an advantage. It either hinders or has no effect on presidential greatness. Consider the mean value of the multilevel intercept, 14.6, which, interpreted literally, means that a president without any experience would be in the top third of the rankings. Although all presidents have had some public or private sector experience, the assumption of no experience is not implausible—consider the child of a wealthy billionaire who has never held a full-time job and is elected president at a young age.
Political experience appears to be more harmful than private sector experience to a president's ranking. A person who has spent a lifetime in the private sector is more likely to be a better president than one who has spent a lifetime in politics, although private sector experience has a substantively small and statistically insignificant effect. Time spent as a mayor, a member of Congress, a state administrator, a federal judge or attorney, or a soldier leads to a lower ranking.Footnote 13 These negative effects are robust to 95% credible intervals. The largest of these effects is for mayoral service, with each year in office lowering one's ranking by more than three spots. Since only three mayors ever became president, these findings should be interpreted cautiously. If these results are correct, however, Republican voters did the country a huge service last year by not selecting “America's Mayor” Rudy Guiliani as their presidential nominee. Looking ahead to 2012, former mayor Sarah Palin may prove an exception to this weak rule.
In addition, the negative effect of congressional experience is evidence that the charge “creature of Washington,” so often leveled against senators and representatives, has some bite. Each two-year term in Congress lowers a president's ranking by more than one place. This effect warns against choosing presidents with long service records in Congress and validates U.S. voters who have, for the last half-century, tended to choose governors over senators for president.
On average, experience as a diplomat, soldier, and a member of the private sector also decreases a president's ranking, although the effect is not robust to 95% credible intervals. Experience as a governor, state legislator, state administrator, and general improves ranking, on average, but these effects are also not robust to 95% credible intervals. The largest of these effects is for general, which might be driven by the top-10 rankings of three presidents with long careers as military leaders: George Washington, Andrew Jackson, and Dwight Eisenhower. It should be remembered that the president with the most experience as a general, Zachary Taylor, was also one of the country's worst presidents.
Posterior Predictive Checks
To assess the overall fit and quality of the model, I extracted point estimates for each of the variables, as well as for the individual level variance. Because of the similarities across the various evaluators, I used the mean estimates. I then simulated 1,500 separate rankings for each of the 43 presidents from their respective years of experience in each of the 12 categories. I took the mean and standard deviation for each set of simulated rankings, resulting in seven 287 × 2 matrices of data. I then plotted the simulated rankings and their 95% credible intervals against the actual average rankings from the surveys.Footnote 14
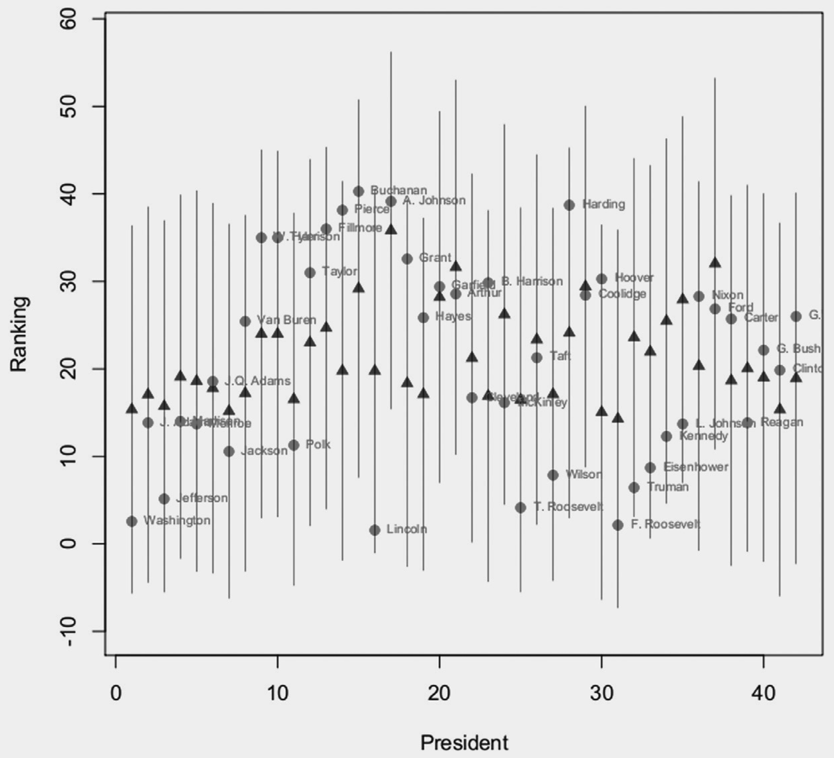
Overall, the multilevel model does a poor job of predicting presidential rankings. The pooled and unpooled models perform equally as poorly, which is not surprising given that the point estimates are similar. The simulated and actual rankings are shown in figure 3. Most of the predictions, shown as triangles, are bunched in the 15 to 25 rank range. The actual rankings are shown as dots. While the 95% confidence intervals from the simulated rankings do include the actual rankings, they do so because they extend over the entire possibility of ranking spots. In essence, the models say that any future president with political experiences similar to those of any of the 43 past presidents has the capacity to be one of the country's best or worst presidents—hardly useful information!
Predicted versus Average Actual Presidential Survey Ranking based on Simulations using Multilevel Estimates
Note. Actual ranking is shown with a dot. Simulated ranking is shown with a triangle. The black vertical bars represent 95% confidence intervals for each of the simulated rankings.

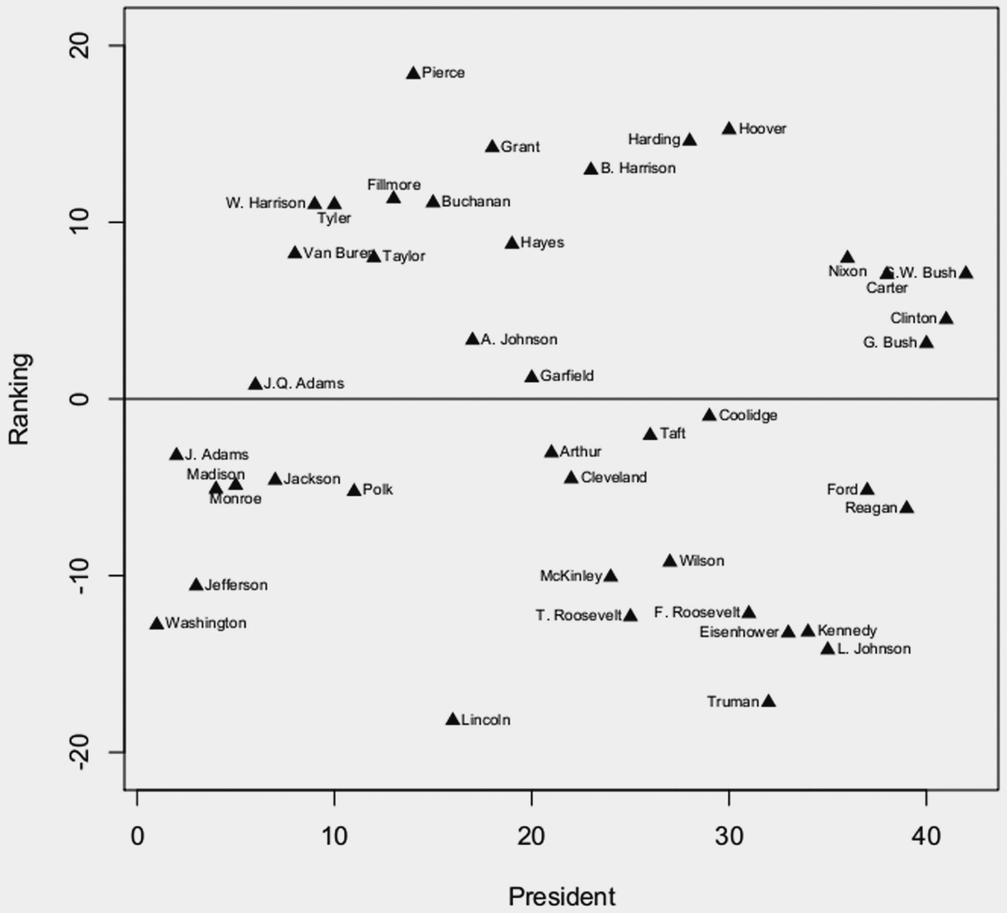
Another way to assess the performance of the model and the effect of experience is by calculating the difference between the actual and the simulated rankings. Figure 4 shows these differences, with 0 representing an accurate prediction. Negative numbers mean that the model predicts average or poor performance for a president who turned out to be good. Positive numbers mean that the model predicts average or slightly above-average performance for a president who turned out to be bad. Although the model has the ability to occasionally predict a lousy president, it is consistently unable to predict good ones. All of the top 10 to 12 presidents in U.S. history have large negative numbers, indicating that the model predicts they would be rather average.
Difference between Average Actual Ranking and Predicted Ranking from Simulations
Note. Value of zero indicates model accurately predicted president's ranking. A positive value indicates that a president was worse than model predicted. A negative value indicates that a president was better than model predicted.

The model leaves out some key explanatory variables (such as the occurrence of a war or an economic depression) that capture the full variance in presidential performance, particularly on the high end. The model is consistently unable to identify great and even good presidents. No president is ever predicted to be among the top 10, and the model identifies some presidents like John Quincy Adams as mediocre only because it predicts that most presidents will be mediocre. Occasionally, it can do a reasonable job predicting a terrible president like Andrew Johnson, whose lifetime in politics—including three years as mayor of Greenville, Tennessee, and 17 years in Congress—is a kind of perfect storm for lousy presidential performance. There are close predictions for other bottom-tier presidents such as Chester Arthur, who had previously served as a state-level civil servant, and Calvin Coolidge, who was mayor of Northampton, Massachusetts. Some of the model's worst misses are the string of poor pre–Civil War presidents like William Henry Harrison, John Tyler, and Franklin Pierce, who all had considerable experience in Congress or a state legislature. Their presidential failures run deeper than a legislator's parochial perspective and lack of management skills.
CONCLUSION
Presidential candidates frequently tout their political experience to voters, claiming that it has prepared them to deal with complex problems and make weighty decisions. This study used a multilevel model to analyze the impact of national and state political experience on overall presidential greatness, as judged by seven surveys of academic experts. Overall, there is no evidence that political experience improves the chances of extraordinary presidential performance, and there is some weak evidence that certain political positions, most importantly mayor and Congressional member, lead to poorer performance. In the end, great presidents are not great simply because they have spent their lives in politics and learned important lessons in that sphere. Other factors, like personal qualities or time, are more important in producing greatness (Skowronek Reference Skowronek1997; Skowronek Reference Skowronek2008; Crockett Reference Crockett2000).
Great presidents seem to be forged from great periods of economic, social, or political crises and by a president's ability to navigate the difficult decisions required by such times. Franklin D. Roosevelt observed that “all our great presidents were leaders of thought at times when certain ideas in the life of the nation had to be clarified.” In this vein, “Washington embodied the idea of federal union, Jefferson and Jackson the idea of democracy, Lincoln union and freedom, Cleveland rugged honesty. Theodore Roosevelt and Wilson, said FDR, were both ‘moral leaders, each in his own way and his own time, who used the presidency as a pulpit’” (Schlesinger, Jr. Reference Schlesinger1997, 186). Political experience may be useful, as it was for George Washington and Franklin Roosevelt, or it may be largely irrelevant, as it was for Abraham Lincoln. Either way, presidential candidates will continue to run on the virtues of political experience, especially against newcomers. For most candidates, for better or worse, it is the best selling point they have.