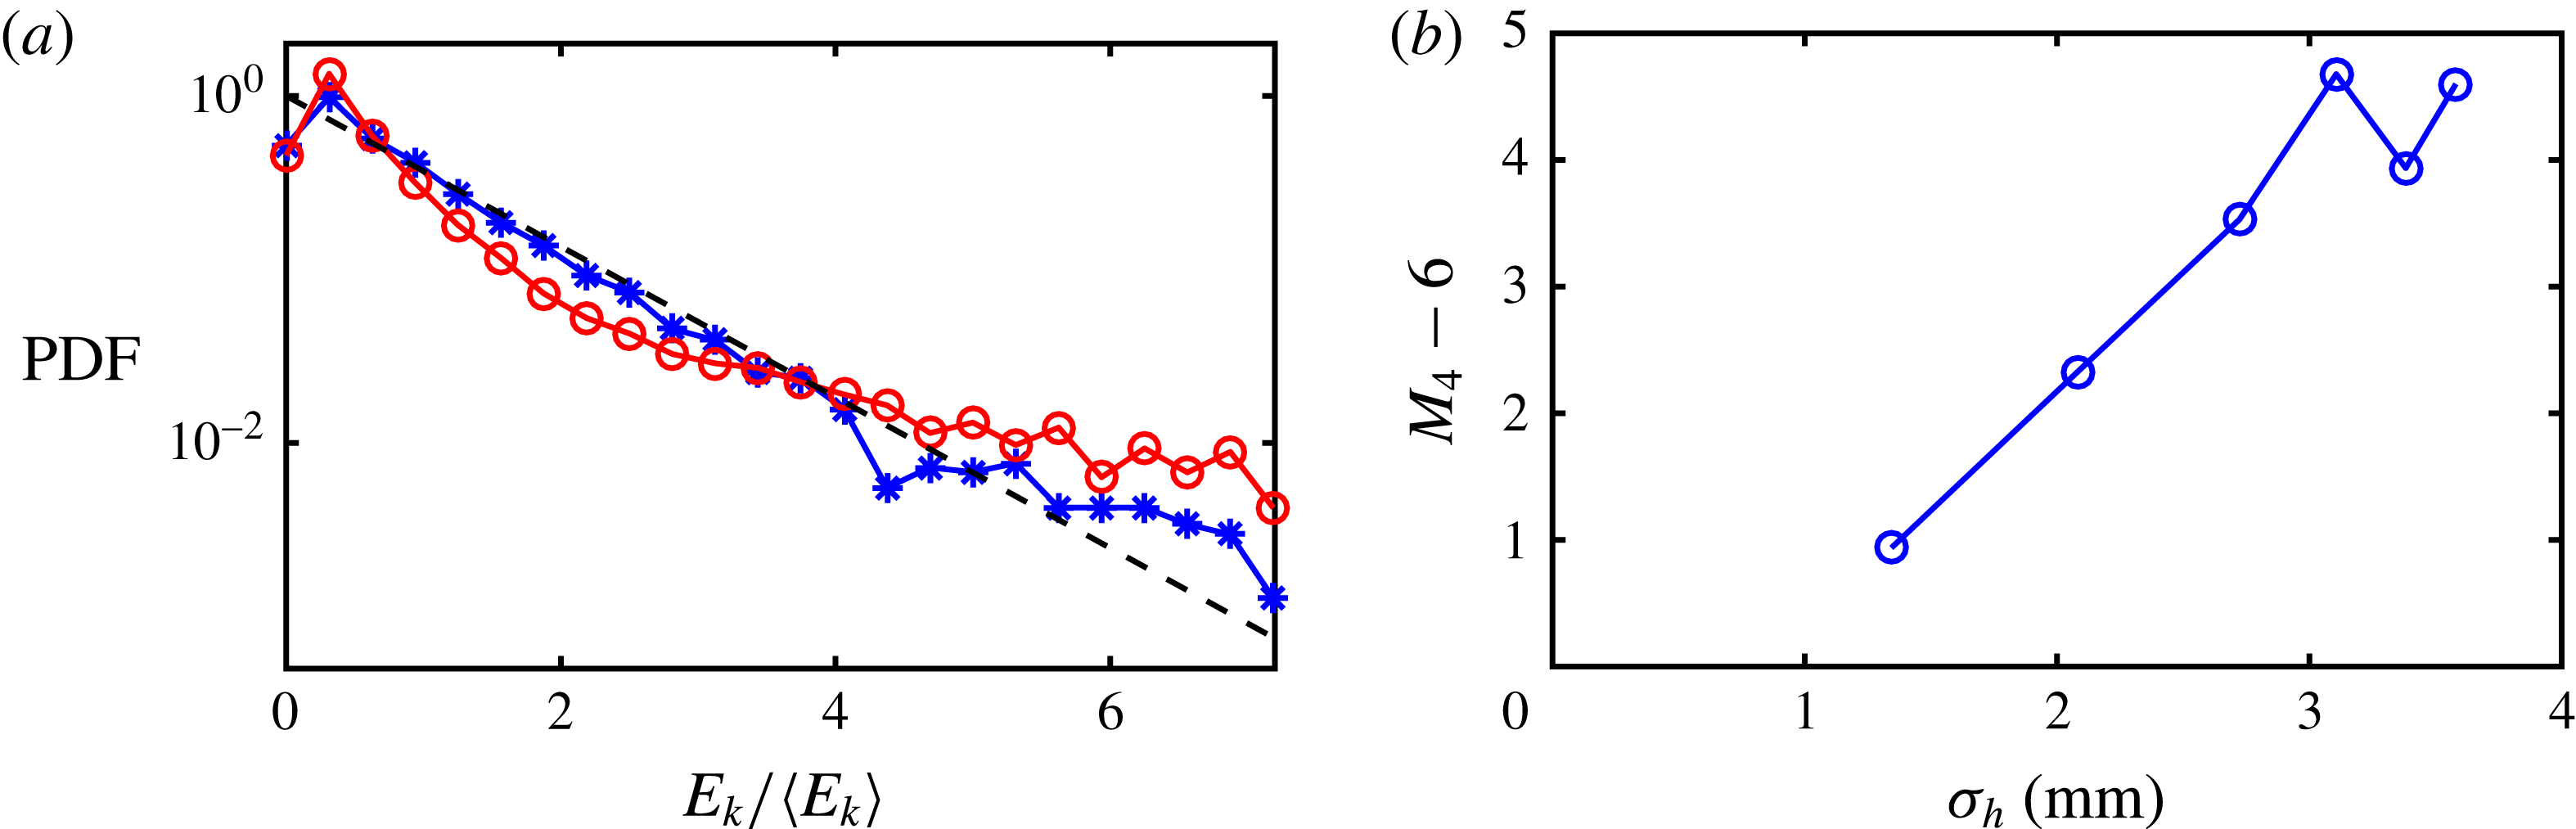
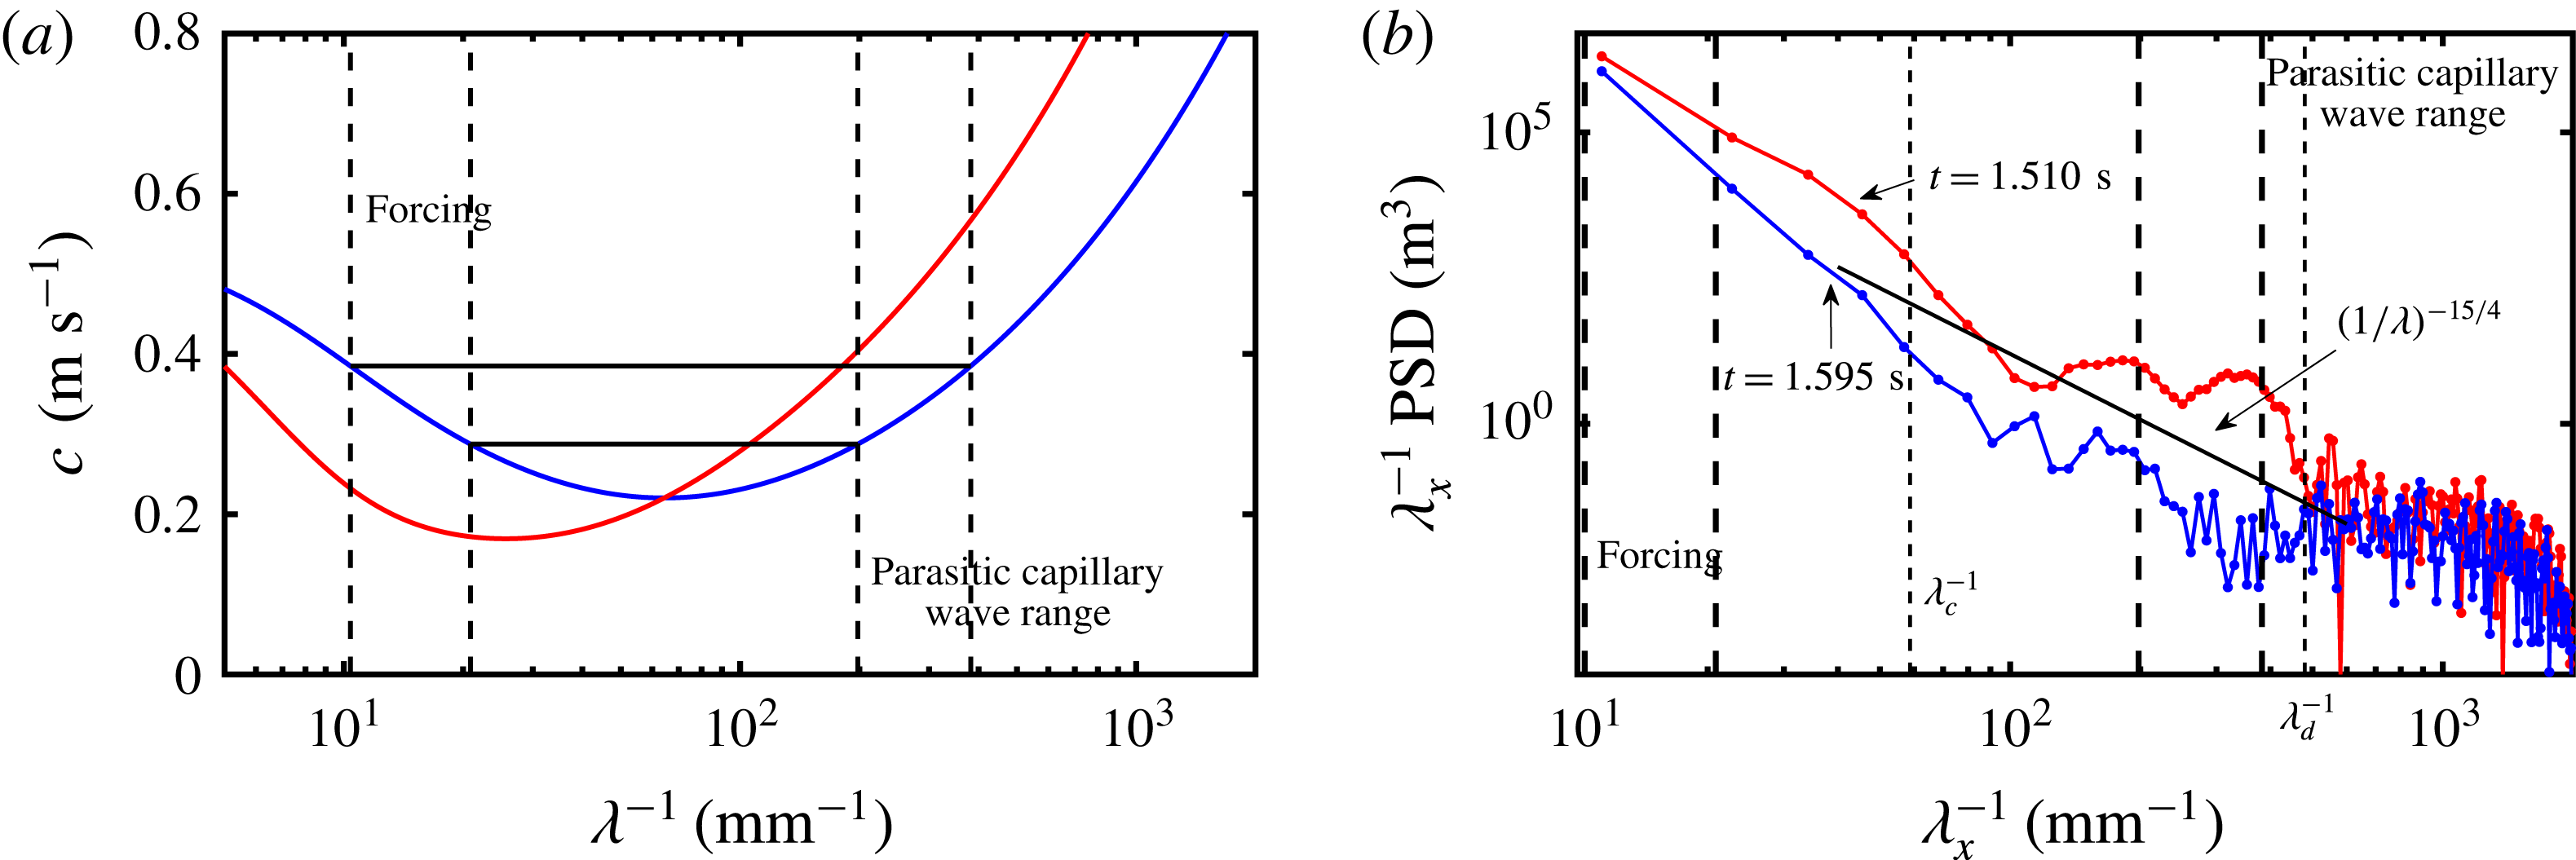
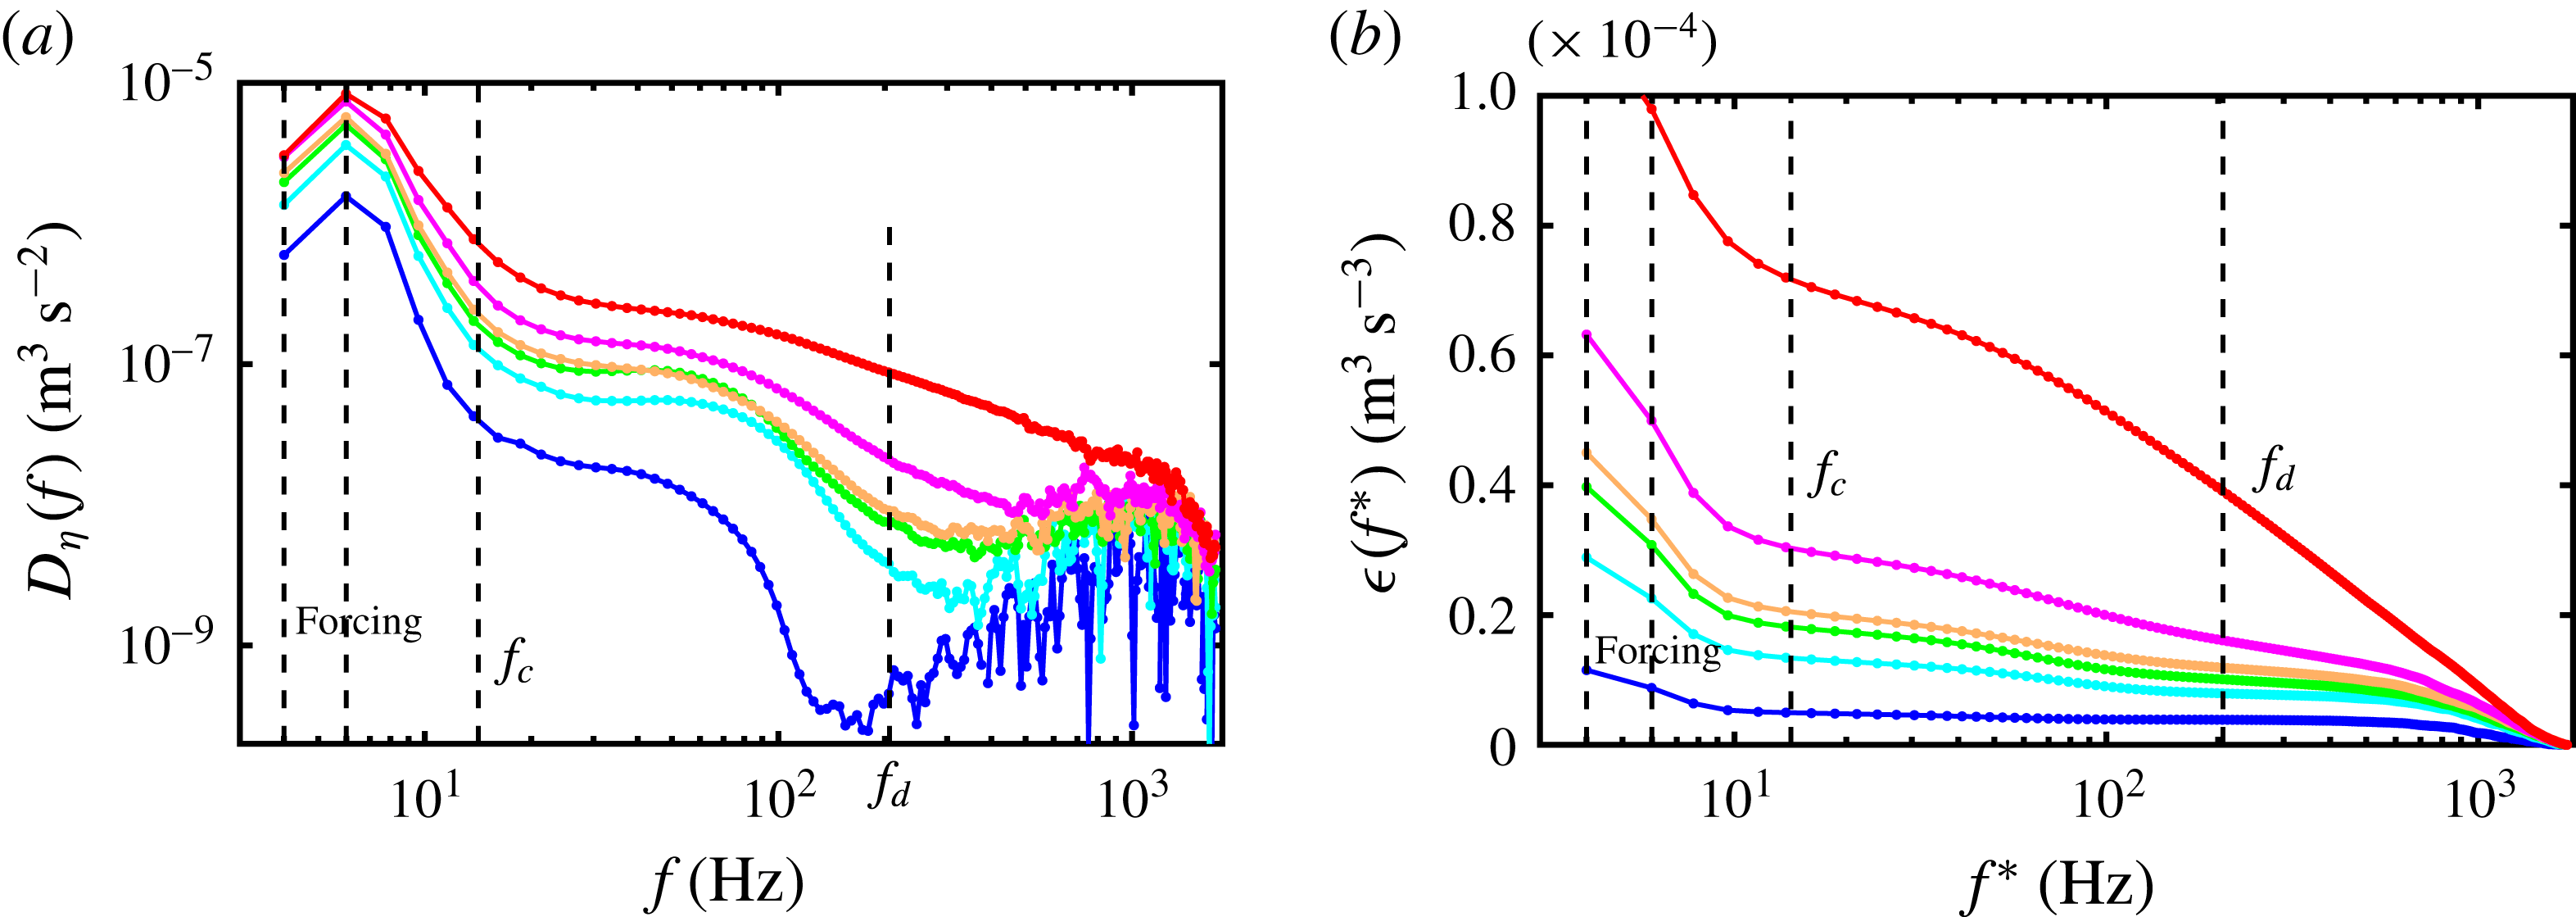
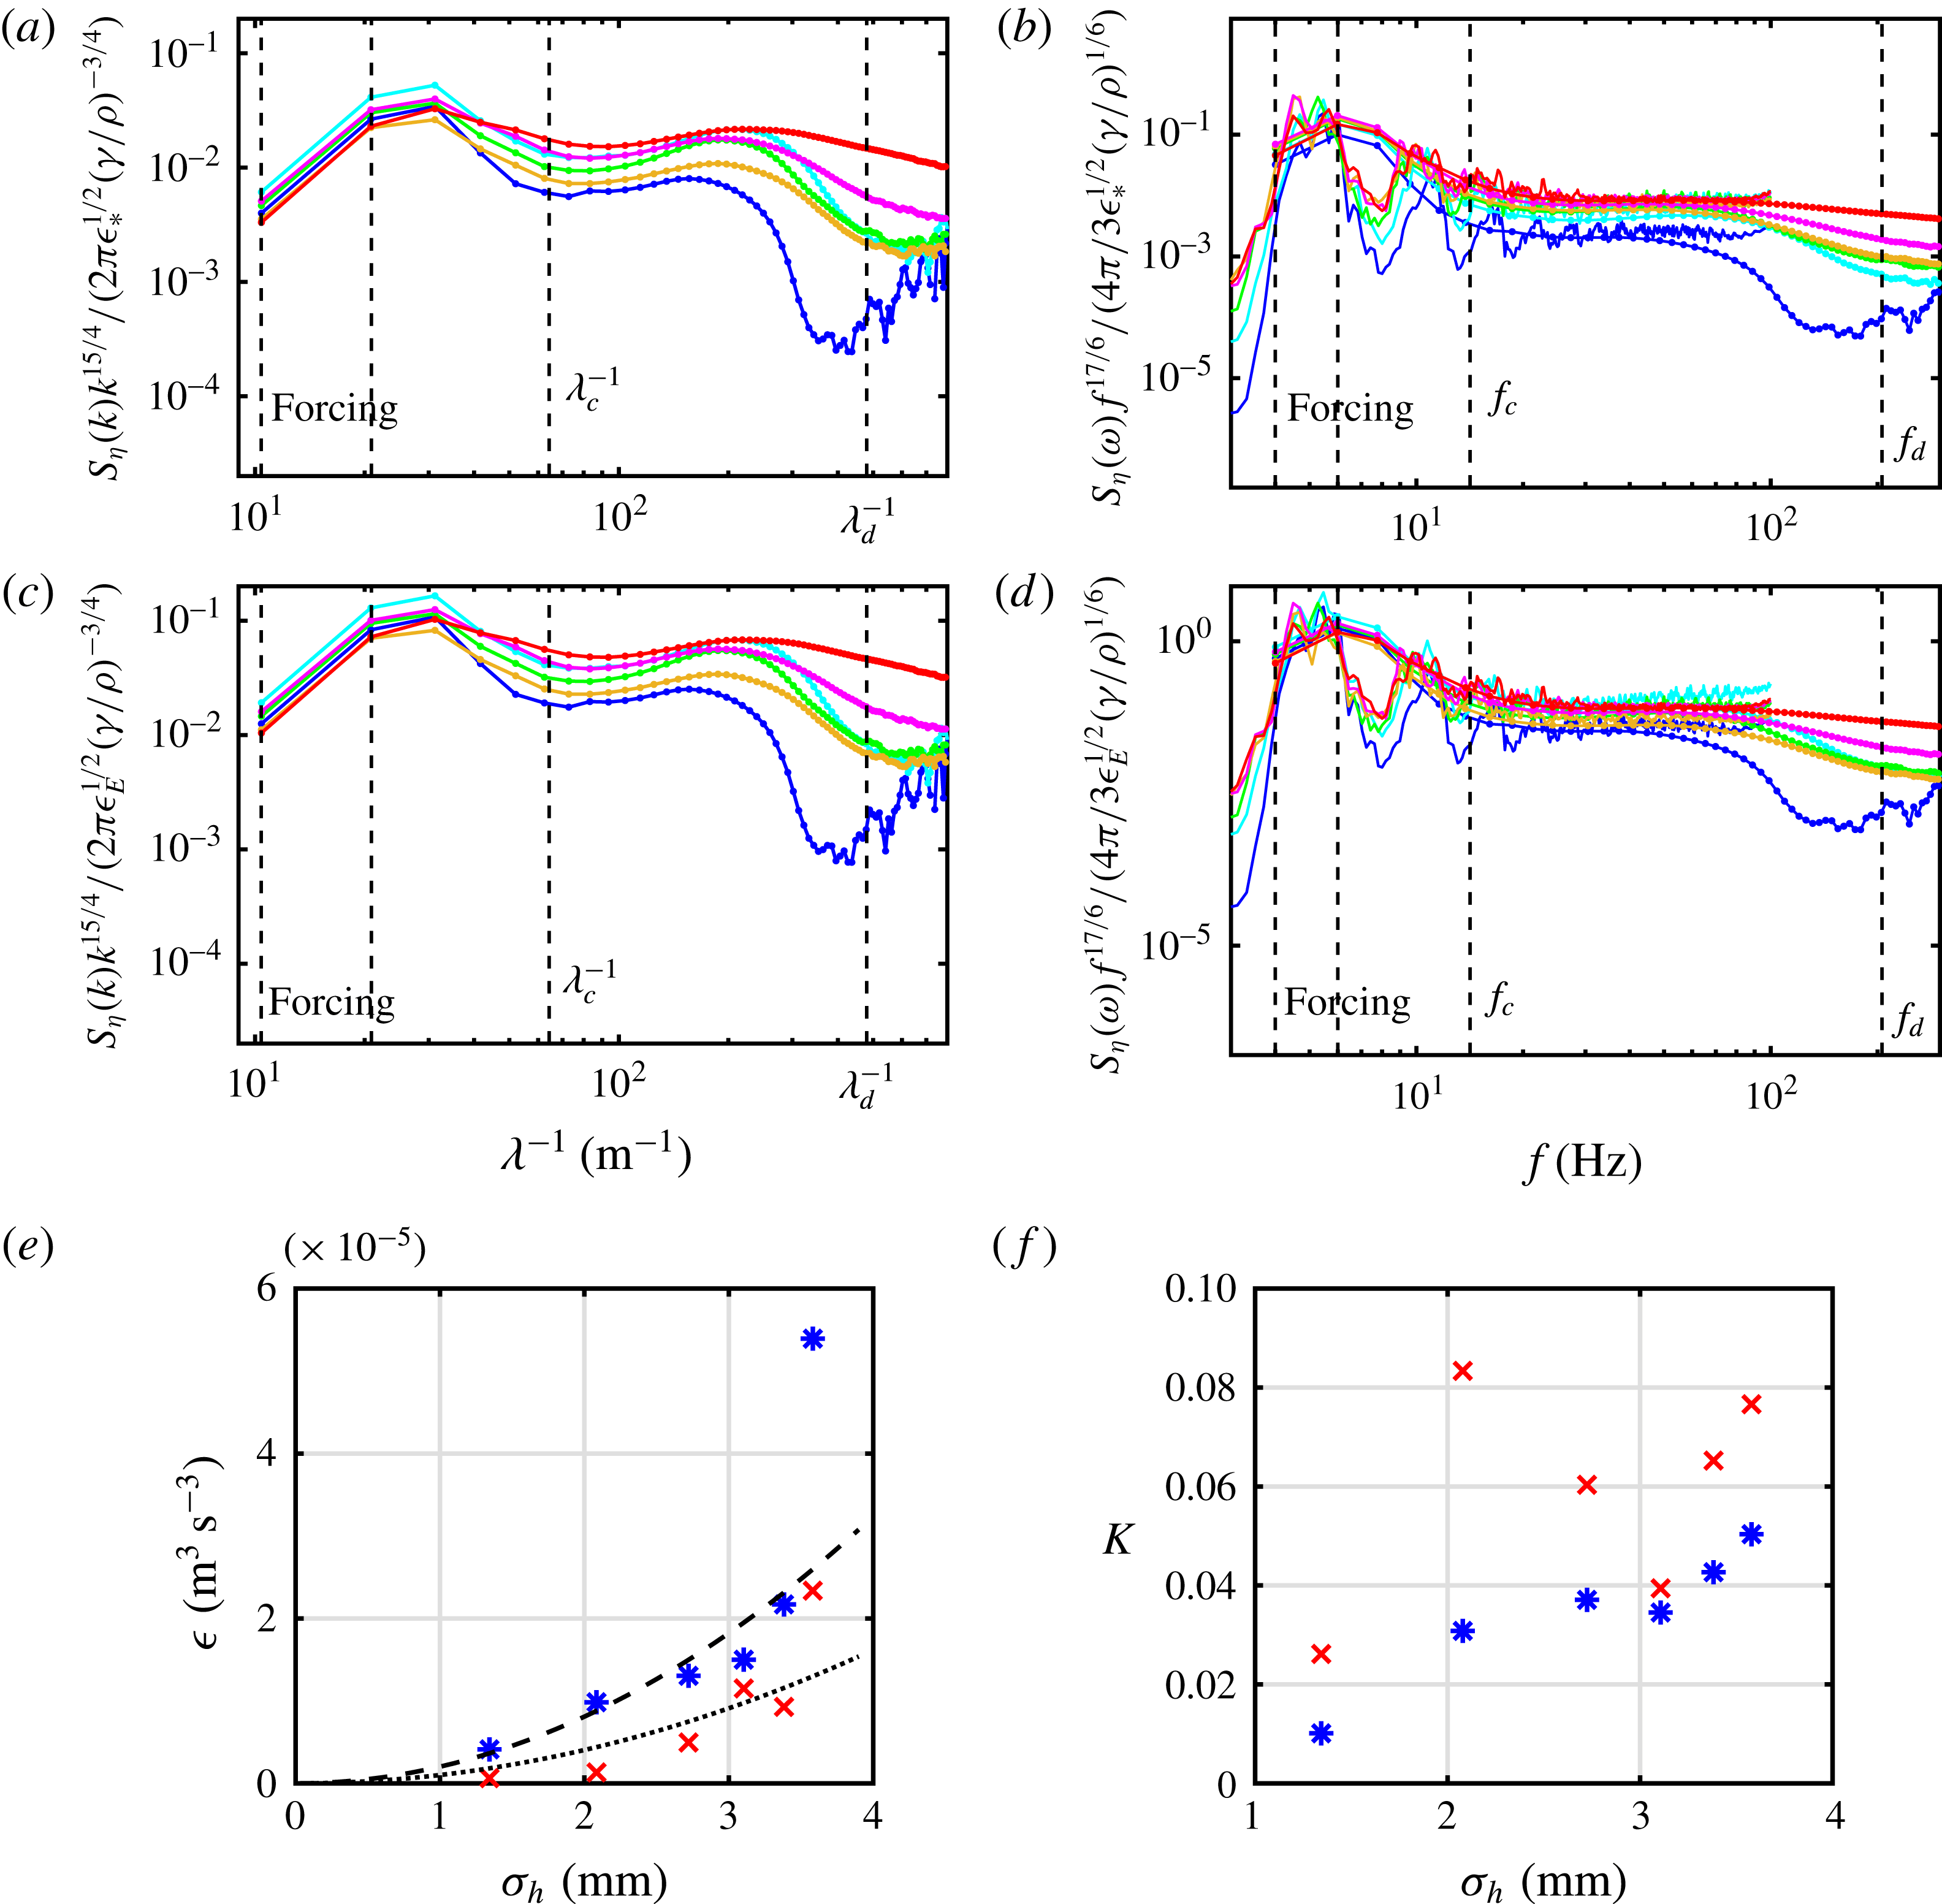
1 Introduction
Disordered patterns of waves are easily seen on a choppy sea, a consequence of both the wave dynamics and the wind forcing. Due to the large number of degrees of freedom and to the exchanges between these scales permitted by nonlinear effects, the dynamics becomes complex and unpredictable. The relevant approach is therefore a statistical analysis of the free surface, considering random propagation of dispersive surface waves interacting nonlinearly in the presence of wind forcing and dissipation. At large scales the main restoring force is gravity, whereas at scales below 1 cm, surface tension is dominant, and the waves are said to be capillaries or capillary waves. Although the energy carried by capillary waves is significantly lower than by gravity waves, the study of capillary wave dynamics is important to describe exchanges between the sea and the atmosphere. They also increase tremendously the water surface roughness, necessary for the radar scattering monitoring of sea waves (Hwang et al. Reference Hwang, Burrage, Wang and Wesson2013), and contribute to the overall dissipation of gravity waves (Zhang Reference Zhang2002; Tsai & Hung Reference Tsai and Hung2010; Caulliez Reference Caulliez2013; Melville & Fedorov Reference Melville and Fedorov2015; Deike, Popinet & Melville Reference Deike, Popinet and Melville2015b ). Therefore a statistical description of random waves at the capillary scales is important in environmental fluid dynamics and oceanography.
For small wave amplitudes at the air–water interface, in the absence of currents and vorticity, wave propagation obeys the linear dispersion relation:
 $$\begin{eqnarray}\unicode[STIX]{x1D714}^{2}=[gk+(\unicode[STIX]{x1D6FE}/\unicode[STIX]{x1D70C})k^{3}]\tanh (kh_{0}),\end{eqnarray}$$
where
 $\unicode[STIX]{x1D714}=2\unicode[STIX]{x03C0}f$
is the angular frequency,
 $k=2\unicode[STIX]{x03C0}/\unicode[STIX]{x1D706}$
the wavenumber modulus,
 $g=9.81~\text{m}~\text{s}^{-2}$
the gravity acceleration,
 $\unicode[STIX]{x1D6FE}$
the surface tension at the air–water interface,
 $\unicode[STIX]{x1D70C}$
the water density and
 $h_{0}$
the depth of the fluid layer. In the following we consider the deep-water limit, where
 $kh_{0}\gg 1$
. At higher wave amplitude, nonlinear effects must be taken into account, leading to modifications of the dispersion relation (Crapper Reference Crapper1957; Whitham Reference Whitham1999) and to wave interactions between different scales. A dimensionless nonlinear parameter is introduced to quantify the relevance of nonlinear effects: the wave steepness
 $ak$
, where
 $a$
is the wave amplitude and
 $k$
the typical wavenumber. It represents the typical slope of the deformed free surface.
Three-wave interactions for frequencies close to the gravity–capillary crossover are prone to produce capillaries from gravity waves (Hammack & Henderson Reference Hammack and Henderson1993; Aubourg & Mordant Reference Aubourg and Mordant2015) in the weakly nonlinear regime. For a wave field having frequency wave components
 $f_{1}$
and
 $f_{2}$
, the quadratic nonlinearity of the equations describing surface wave propagation induces a product of these components. An excitation is obtained at the sum frequency
 $f_{1}+f_{2}$
. For large systems, or for long observation times, only interactions which are resonant have a net contribution to energy transfer. The resonance condition for waves following the dispersion relation
 $\unicode[STIX]{x1D714}(k)$
, with
 $k=\Vert \boldsymbol{k}\Vert$
, consists in the following relations:
 $$\begin{eqnarray}\displaystyle & \boldsymbol{k}_{\mathbf{1}}\pm \boldsymbol{k}_{\mathbf{2}}\pm \boldsymbol{k}_{\mathbf{3}}=0 & \displaystyle\end{eqnarray}$$
 $$\begin{eqnarray}\displaystyle & \unicode[STIX]{x1D714}(k_{1})\pm \unicode[STIX]{x1D714}(k_{2})\pm \unicode[STIX]{x1D714}(k_{3})=0. & \displaystyle\end{eqnarray}$$
Non-resonant interactions (i.e. not validating the above conditions) produce oscillating contributions with a period (spatial or temporal) decreasing with the mismatch with respect to the resonant condition. After averaging over this period, energy transfer by non-resonant interactions vanishes. These interactions are thus most of the time neglected. However, experimentally, especially in finite domains, the resonances cannot be exact. Therefore, we define quasi-resonant interactions in the wave-field dynamics as interactions with small differences with respect to the resonant conditions (Aubourg & Mordant Reference Aubourg and Mordant2015; Pan & Yue Reference Pan and Yue2017). The tolerance is usually justified by a nonlinear broadening of the dispersion relation. For quasi-resonant interactions, the mismatch with respect to the resonance is sufficiently small such that the average on a finite size domain leads to a net energy transfer.
At a higher level of nonlinearity, i.e. higher wave steepness, other mechanisms of generation of capillary waves must be considered. Parasitic capillary wave generation is the most studied mechanism. It describes the appearance of capillaries on the crest of a steep gravity propagating wave (Longuet-Higgins Reference Longuet-Higgins1963, Reference Longuet-Higgins1995; Fedorov & Melville Reference Fedorov and Melville1998; Fedorov, Melville & Rozenberg Reference Fedorov, Melville and Rozenberg1998) by a fast mechanism transferring energy directly from the large scale to the small scale (Melville & Fedorov Reference Melville and Fedorov2015). Such a nonlinear interaction between a long wave and a short wave is said to be non-local in wavenumber space. Parasitic capillary waves are typically observed for gravity waves with a wavelength
 $\unicode[STIX]{x1D706}$
between 5 and 40 cm and a steepness larger or equal to 0.05 (Fedorov & Melville Reference Fedorov and Melville1998; Fedorov et al.
Reference Fedorov, Melville and Rozenberg1998; Zhang Reference Zhang2002). Similar capillary wave patterns occur also on the front of gravity waves at higher steepness, before spilling breaking events (Duncan et al.
Reference Duncan, Qiao, Philomin and Wenz1999; Duncan Reference Duncan2001; Deike et al.
Reference Deike, Popinet and Melville2015b
; Melville & Fedorov Reference Melville and Fedorov2015), and also on the crest of steep standing gravity waves (Schultz et al.
Reference Schultz, Den-Broeck, Jiang and Perlin1998). Nevertheless, the parasitic capillary wave generation mechanism is described to date theoretically only for unidirectional, propagative and monochromatic long gravity waves.
The wave turbulence theory (Zakharov, L’vov & Falkovich Reference Zakharov, L’vov and Falkovich1992; Nazarenko Reference Nazarenko2011; Newell & Rumpf Reference Newell and Rumpf2011; Nazarenko & Lukaschuk Reference Nazarenko and Lukaschuk2016) provides an analytical description in the Fourier space of dynamics of random dispersive waves interacting by resonant wave interactions in a weakly nonlinear regime. It predicts the capillary wave elevation spectra as a power law,
 $S_{\unicode[STIX]{x1D702}}(f)\propto f^{-17/6}$
in time and
 $S_{\unicode[STIX]{x1D702}}(k)\propto k^{-15/4}$
in space (after integration on all the orientations) (Zakharov & Filonenko Reference Zakharov and Filonenko1967b
; Pushkarev & Zakharov Reference Pushkarev and Zakharov2000). The hypotheses used in the theoretical derivation are drastic, in particular scale separation between forcing and dissipation, i.e. negligible dissipation in the inertial range, an infinite homogeneous system and randomness of the wave field. Moreover, analytic results are provided only for pure gravity waves or pure capillary waves. Therefore, the applicability of wave turbulent concepts in experimental and natural systems remains questionable. Beyond this theory, in order to describe statistically spectra of gravity–capillary wave fields, a few authors have considered the dynamics of the wave action spectrum modelled with a kinetic equation including three-wave interactions numerically (Dulov & Kosnik Reference Dulov and Kosnik2009; Kosnik, Dulov & Kudryavtsev Reference Kosnik, Dulov and Kudryavtsev2010) and analytically (Stiassnie Reference Stiassnie1996). Finally to study statistically gravity–capillary waves at higher nonlinearity an interesting approach in Fourier space consists in enabling a given mismatch with respect to resonant conditions in wave interactions (Watson & McBride Reference Watson and McBride1993; Watson & Buchsbaum Reference Watson and Buchsbaum1996; Watson Reference Watson1999). Parasitic waves can be numerically reproduced by considering non-resonant unidirectional three-wave interactions (Watson & Buchsbaum Reference Watson and Buchsbaum1996; Watson Reference Watson1999). Therefore, at sufficiently high steepness, energy transfer to the small scales could occur through non-resonant three-wave interactions under the form of parasitic capillary wave generation.
In this article, we study experimentally random fields of capillary waves forced by random steep gravity waves mechanically generated in a finite-sized tank. Small-scale properties of a choppy sea surface is in this way mimicked, by replacing the chaotic forcing by gravity waves with a stochastic one. Using a resolved spatial temporal measurement of the free surface, we characterize statistical and dynamical properties of capillary waves in real and Fourier space.
This study follows a previous work, using the same experimental device (Berhanu & Falcon Reference Berhanu and Falcon2013). At a high enough level of excitation by a spatio-temporal analysis, we characterized the capillary wave turbulence, forced by gravity waves. We reported an agreement of the exponents of temporal and spatial power-law spectra with the predictions of wave turbulence theory. Nevertheless, in these conditions, we observed that several hypotheses of the theory are not met. The nonlinearity is not weak, the dissipation in not negligible for capillary waves, and the wave field is not isotropic even at small scales (Berhanu & Falcon Reference Berhanu and Falcon2013).
Here we perform a deeper and more complete analysis for wave steepness varying from 0.15 to 0.34. In the real space, the wave field displays capillary wave trains on the crests of large gravity waves. First, we demonstrate by a spatial Fourier analysis that the capillary wave phases are uniformly distributed, justifying the stochasticity of the wave field at small scales. Then we compute space–time Fourier spectra of the wave elevation. We obtain experimentally continuous dispersion relations displaying a significant nonlinear broadening. To describe energy transfer from gravity waves to small-scale capillary waves, the decays of spectral energy as a function of the frequency and of the wavenumber are analysed. We observe power-law spectra that we interpret as a signature of turbulence of capillary waves. The spectral exponents are close to the predictions of wave turbulence theory. Then, by studying higher-order correlations in Fourier space, we detect the substantial presence of three-wave interactions. We note the broad width of the dispersion relation may permit interactions far from the resonant conditions. However, by studying the temporal fluctuations of the spatial spectrum, we show that the energy transfers occur through strong nonlinear events generating capillary wave trains, similarly to the parasitic capillary wave mechanism. A departure from the Gaussian distribution of wave amplitude is reported, corresponding to the presence of intermittent large-scale coherent structures, having a broad spectral contribution. This strong capillary wave turbulence thus differs from the weak capillary wave turbulence described by the wave turbulence theory, although the exponents of the power law of the temporal and spatial spectra are the same in both cases. A quantitative comparison of our results with predictions of the wave turbulence theory is then performed. Using the computation of the dissipated power, the energy flux is estimated and is found non-conserved through the scales due to the broad band dissipation. The scaling of the wave spectrum with the mean energy flux is tested and is found approximate and dependent on the wave amplitude. Thus, for turbulent capillary waves, broad-scale dissipation and strong nonlinearity should be taken into account in theoretical analyses. Moreover, due to the significant viscous dissipation, we show that finite-size effects are negligible for capillary waves.
This paper is organized as follows. First, in § 2, we present the methods of this work: the experimental device, the forcing protocol and a brief characterization of the velocity field. Then, in § 3, we analyse the turbulent wave field in the stationary regime in Fourier space. In § 4, the capillary wave turbulent regimes are studied as a function of time to characterize the fluctuations. In § 5, we compare our results with the predictions of wave turbulence theory. Then we discuss the applicability of the wave turbulence theory to capillary waves in experiments. Finally, in § 6, before giving the conclusion, we discuss the role of viscous dissipation and gravity–capillary crossover on turbulent regimes of capillary waves. Moreover, the appendix demonstrates that, due to viscous dissipation, finite-size effects are negligible for capillary waves.
2 Methods
2.1 Experimental set-up
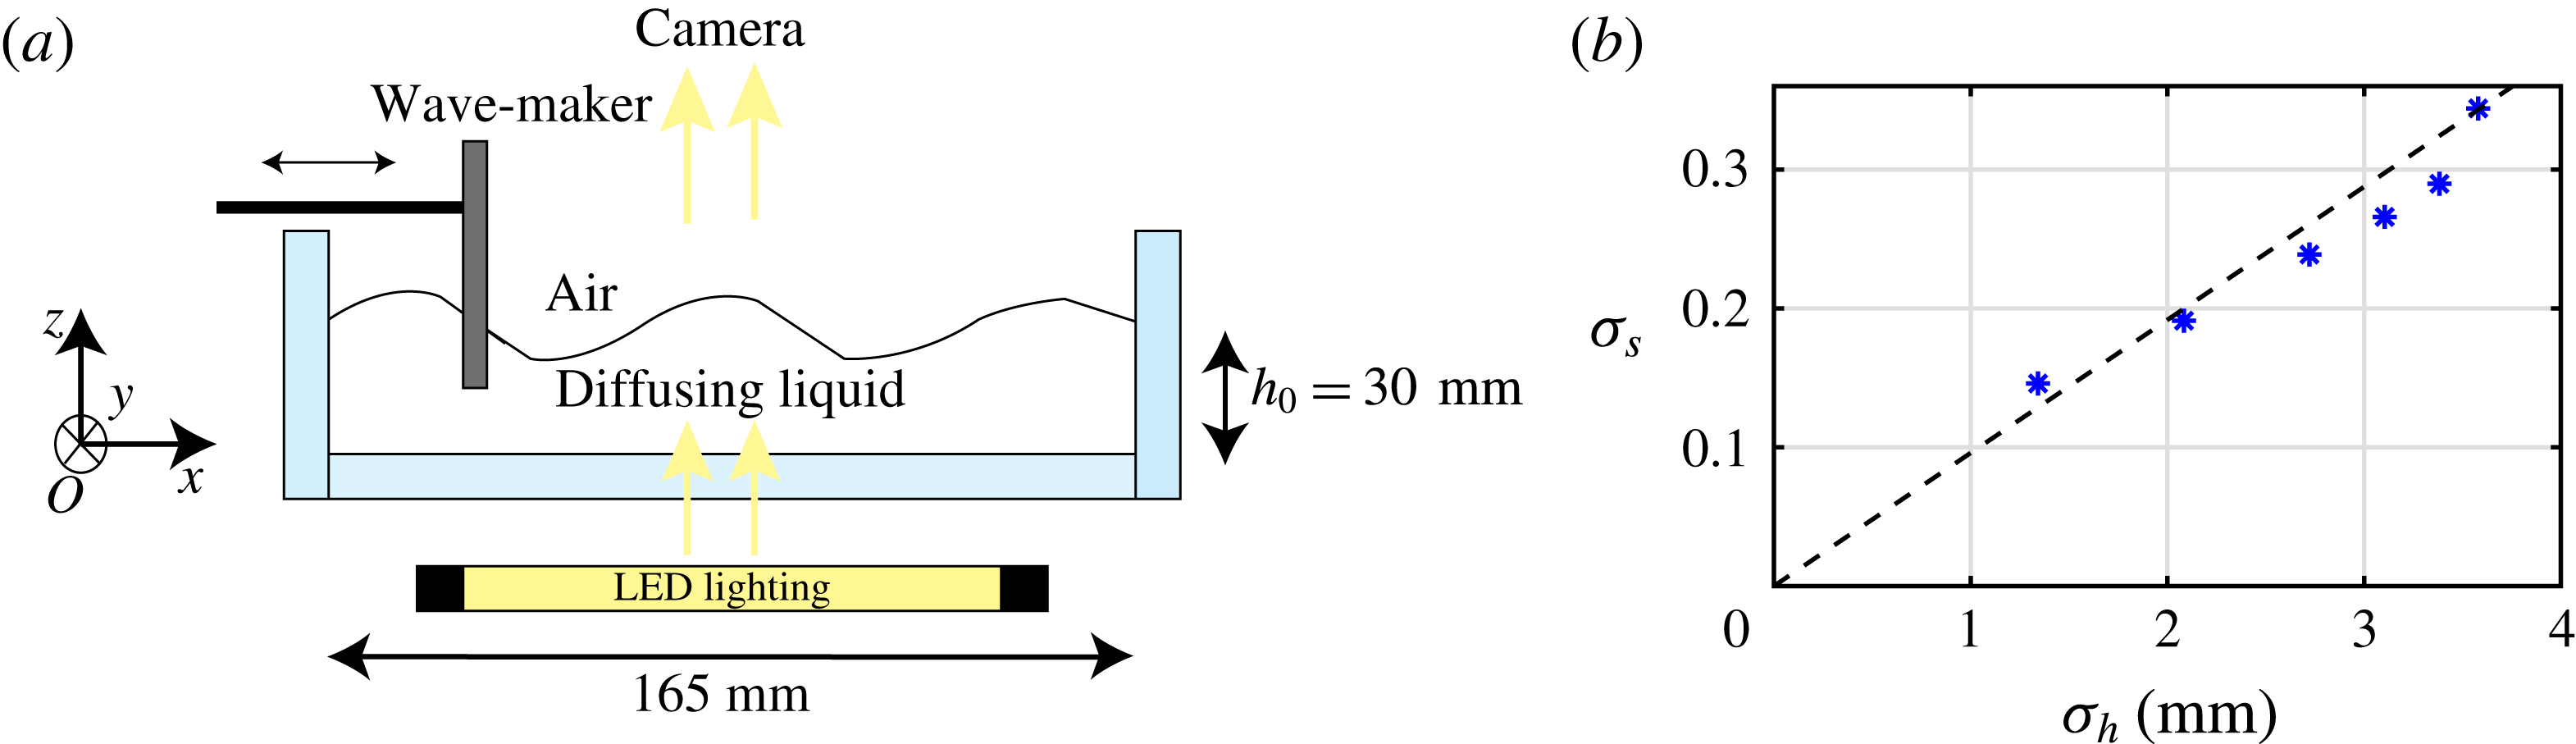
(a) Experimental set-up. Surface waves are produced by the horizontal motion of a rectangular paddle and the free surface is measured in space and time using diffusing light photography (DLP). (b) Typical wave steepness
 $\unicode[STIX]{x1D70E}_{s}$
versus the typical wave amplitude
 $\unicode[STIX]{x1D70E}_{h}$
. The dashed line depicts the usual estimation of steepness by
 $\unicode[STIX]{x1D70E}_{h}k$
, with
 $k$
the wavenumber obtained with the linear dispersion relation for
 $f=5~\text{Hz}$
(central forcing frequency).

The experimental set-up and measurement techniques are similar to those described in Berhanu & Falcon (Reference Berhanu and Falcon2013) and the experimental device displayed in figure 1 is thus identical. We recall here only the essential points. The free-surface elevation is directly measured in space and time using the diffusing light photography (DLP) (Wright, Budakian & Putterman Reference Wright, Budakian and Putterman1996; Wright et al.
Reference Wright, Budakian, Pine and Putterman1997; Xia et al.
Reference Xia, Maimbourg, Punzmann and Shats2012) technique. A Plexiglass tank (
 $165\times 165~\text{mm}^{2}$
) is filled with a diffusing liquid (1 l of distilled water with 6 ml of Intralipid 20 %) up to a height
 $h_{0}=30~\text{mm}$
. Intralipid 20 % (Fresenius Kabi™) is a commercial lipidic emulsion of microspheres, whose aqueous solutions are used as model diffusing media with characterized optical properties (van Staveren et al.
Reference van Staveren, Moes, van Marie, Prahl and van Gemert1991). Due to the low dilution, the fluid viscosity and density are close to the pure water values (
 $\unicode[STIX]{x1D708}=10^{-6}~\text{m}~\text{s}^{-2}$
and
 $\unicode[STIX]{x1D70C}=1000~\text{kg}~\text{m}^{-3}$
, respectively). The surface tension has been measured statically with a Du Noüy ring tensiometer, providing a value of
 $53.6~\text{mN}~\text{m}^{-1}$
. However, a dynamic value of surface tension
 $\unicode[STIX]{x1D6FE}=60~\text{mN}~\text{m}^{-1}$
is obtained from the spatio-temporal measurements (Berhanu & Falcon Reference Berhanu and Falcon2013). The dynamic values appear nevertheless more relevant to analyse wave propagation (Hammack & Henderson Reference Hammack and Henderson1993). Surface waves are produced by the horizontal motion of a rectangular paddle (130 mm in width and 13 mm in immersed depth) driven by an electromagnetic shaker (LDS V406). A LED device Phlox (
 $100\times 100~\text{mm}^{2}$
) ensures a homogeneous lighting below the transparent tank. A 16-bit camera (PCO EDGE), one metre above, with
 $1024~\text{pixel}\times 1120~\text{pixel}$
is focused on the liquid free surface and records at a 200 Hz frame rate an observation area
 ${\mathcal{S}}$
of
 $89\times 96~\text{mm}^{2}$
.
2.2 Random forcing of gravity waves
The waves are forced at the large scale through the random motion of the paddle. The electrical signal sent to the shaker is obtained by band pass filtering an initial white noise between 4 and 6 Hz. The resulting excitation is random in amplitude and phase and has an autocorrelation time of order 1 s. It generates waves belonging to the gravity wave range, the corresponding wavenumbers given by the linear dispersion relation being respectively
 $k=65.3~\text{m}^{-1}$
(
 $\unicode[STIX]{x1D706}=96.2~\text{mm}$
) and
 $k=131~\text{m}^{-1}$
(
 $\unicode[STIX]{x1D706}=47.9~\text{mm}$
). By enhancing the initial mixing of waves, this type of random forcing is known to produce power-law spectra interpreted as gravity–capillary wave turbulence in laboratory experiments (Falcon, Laroche & Fauve Reference Falcon, Laroche and Fauve2007; Herbert, Mordant & Falcon Reference Herbert, Mordant and Falcon2010; Cobelli et al.
Reference Cobelli, Przadka, Petitjeans, Lagubeau, Pagneux and Maurel2011; Deike, Berhanu & Falcon Reference Deike, Berhanu and Falcon2012, Reference Deike, Berhanu and Falcon2014a
). At the small scale, surface tension dominates gravity as the restoring force for
 $k$
larger than the inverse of capillary length
 $l_{c}=\sqrt{\unicode[STIX]{x1D6FE}/(\unicode[STIX]{x1D70C}\,g)}\approx 2.5~\text{mm}$
. Capillary waves are thus observed for
 $k>k_{c}=404~\text{m}^{-1}$
(
 $\unicode[STIX]{x1D706}_{c}=15.5~\text{mm}$
).
The paddle is parallel to the
 $y$
axis, close to one boundary, and the resulting wave field on the centre of the tank is thus mainly directed along the
 $x$
axis and results from the waves emitted by the paddle and also by the waves reflecting on the opposite boundary. Due to the reflections on the walls, the wavelengths which are a divisor of the container length (165 mm) are the eigenmodes of the square tank, corresponding to possible standing waves. Using the linear dispersion relation (1.1), the eight first eigenmode frequencies are: 2.79, 4.38, 5.53, 6.57, 7.60, 8.65, 9.75 and 10.90 Hz. For each measurement, 8192 images are recorded, corresponding to a duration of 41 s. Using the DLP method, the deformation of the free surface is reconstructed for each image, providing the spatio-temporal wave-field
 $h(x,y,t)$
. The intensity of transmitted light measured on the camera indeed decreases as a function of the local depth
 $h$
(Wright et al.
Reference Wright, Budakian and Putterman1996). After calibration, the free-surface deformation is obtained with a horizontal spatial resolution of 0.5 mm, a vertical sensitivity of less than hundred microns, even for high steepness of the surface, and a temporal resolution given by the acquisition frequency of the camera (200 Hz). To characterize and compare the measurements, we define the following parameters, the typical wave amplitude
 $$\begin{eqnarray}\unicode[STIX]{x1D70E}_{h}\equiv \left\langle \sqrt{\frac{1}{{\mathcal{S}}}\int _{{\mathcal{S}}}h^{2}(x,y,t)\,\text{d}x\,\text{d}y-\left(\frac{1}{{\mathcal{S}}}\int _{{\mathcal{S}}}h(x,y,t)\,\text{d}x\,\text{d}y\right)^{2}}\right\rangle\end{eqnarray}$$
and the typical wave steepness
 $$\begin{eqnarray}\unicode[STIX]{x1D70E}_{s}\equiv \left\langle \sqrt{\frac{1}{{\mathcal{S}}}\int _{{\mathcal{S}}}\Vert \unicode[STIX]{x1D735}h(x,y,t)\Vert ^{2}\,\text{d}x\,\text{d}y-\left(\frac{1}{{\mathcal{S}}}\int _{{\mathcal{S}}}\Vert \unicode[STIX]{x1D735}h\Vert \,\text{d}x\,\text{d}y\right)^{2}}\right\rangle ,\end{eqnarray}$$
where
 $\langle \cdot \rangle$
denotes a temporal averaging and
 $\int _{{\mathcal{S}}}$
a spatial integration on the surface
 ${\mathcal{S}}$
. This computation of steepness, for a random field of waves, extends the classical definition
 $\unicode[STIX]{x1D70E}_{h}k$
for a monochromatic wave and evaluates the amplitude of nonlinear effects in wave propagation. The set of experiments described here corresponds to
 $\unicode[STIX]{x1D70E}_{h}=1.3$
, 2.1, 2.7, 3.1, 3.4 and 3.6 mm, and
 $\unicode[STIX]{x1D70E}_{s}=0.15$
, 0.19, 0.24, 0.27, 0.29 and 0.34. The global steepness of the wave field is above 0.1 and the nonlinearity level is thus not small. The maximal forcing is set to avoid breaking events in the observation area, for which the free surface becomes multivalued. Whereas waves with a such steepness are intrinsically unstable, due to the limited size of the container, they are experimentally observed in the field of view of the camera. In figure 1(b),
 $\unicode[STIX]{x1D70E}_{s}$
is plotted as a function of
 $\unicode[STIX]{x1D70E}_{h}$
. The typical steepness is described well by the relation
 $\unicode[STIX]{x1D70E}_{h}k$
, with
 $k$
the wavenumber obtained with the linear dispersion relation for
 $f=5~\text{Hz}$
, which is the central frequency of the forcing range.
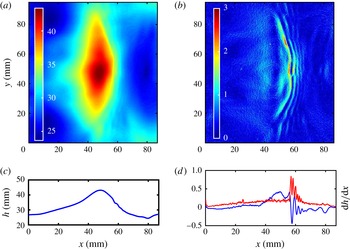
(a) Snapshot of the wave field
 $h(x,y)$
at
 $t=1.51~\text{s}$
.
 $\unicode[STIX]{x1D70E}_{h}=3.6~\text{mm}$
and
 $\unicode[STIX]{x1D70E}_{s}=0.34$
. The colour scale is in mm. The wavemaker is parallel to the
 $y$
-axis and located at
 $x=-12~\text{mm}$
. (b) Snapshot of the spatial gradient of the wave elevation
 $\Vert \unicode[STIX]{x1D735}h(x,y)\Vert$
at the same instant. The colour scale is dimensionless. A train of capillary waves is visible on the forward front of the large carrier wave. (c) Wave profile
 $h(x,y=48~\text{mm})$
. (d) Blue: wave profile
 $h(x,y=48~\text{mm})$
after a high-pass spatial filtering keeping the capillaries (cutoff
 $k=113~\text{m}^{-1}$
). Red (light grey): slope profile of
 $\Vert \unicode[STIX]{x1D735}h(x,y=48~\text{mm})\Vert$
.

An example of the free-surface reconstruction is depicted in figure 2(a) for the highest forcing amplitude
 $\unicode[STIX]{x1D70E}_{h}=3.6~\text{mm}$
at
 $t=1.51~\text{s}$
. In this example, a large gravity wave appears in the centre of the observation area, propagating from left to right along the
 $x$
axis. A three-dimensional plot movie corresponding to the same measurement is available in supplementary movie 1 at https://doi.org/10.1017/jfm.2018.467. By plotting the map of the modulus of the free-surface gradient
 $\Vert \unicode[STIX]{x1D735}h(x,y,t)\Vert$
in figure 2(b), to enhance the small-scale variations, a train of capillary waves on the forward face become visible. The corresponding wave profiles along the
 $x$
-axis taken for
 $y=48~\text{mm}$
confirms this observation, for the wave height in figure 2(c), for the high-pass filtered wave height in figure 2(d) (blue) and the gradient profile
 $\Vert \unicode[STIX]{x1D735}h\Vert$
in figure 2(d) (red). This description corresponds to the standard picture of generation of parasitic capillary waves by gravity waves (Zhang & Cox Reference Zhang and Cox1994; Fedorov et al.
Reference Fedorov, Melville and Rozenberg1998; Perlin & Schultz Reference Perlin and Schultz2000). The capillary wave train of higher group velocity remains visible for a duration of order 0.1 s, before exiting the observation area or disappearing when the trough of the gravity wave is reached. Due to the important reflections along the
 $x$
axis, strong generation of parasitic capillary waves is also observed when two gravity waves are crossing in the area of observation or when transiently a standing wave is excited in the middle of the square tank. In these cases, parasitic wave generation is not theoretically described in the literature, which considers only propagative waves, but a similar experimental observation was reported for standing waves of high amplitude (Schultz et al.
Reference Schultz, Den-Broeck, Jiang and Perlin1998). During a 41 s measurement, typically two hundred events of parasitic capillary wave generation occur in our experiment. Due to the randomness of the forcing and to the multiple reflections, it becomes hazardous to make a direct comparison between theoretical models of parasitic wave generation (Longuet-Higgins Reference Longuet-Higgins1963, Reference Longuet-Higgins1995; Fedorov & Melville Reference Fedorov and Melville1998) and the statistical analysis of the turbulent random wave field obtained with this forcing protocol.
2.3 Velocity field characterization
In similar conditions, but not simultaneously, the two-dimensional (2-D) velocity field has been measured by particle image velocimetry (PIV) in the vertical plane
 $O_{xz}$
.
 $50~\unicode[STIX]{x03BC}\text{m}$
particles were used to seed the water. A vertical laser sheet produced by a 2 W continuous laser illuminates the plane corresponding to the middle of the tank. PIV fields are computed through the open access software PIVlab (Thielicke & Stamhuis Reference Thielicke and Stamhuis2014). Due to the moving free surface, PIV would require the use of a dynamical mask to avoid computing the correlation outside the water, which implies a simultaneous measurement of the free surface in the vertical plane, as was performed in experiments with a smaller free-surface displacement (Jamin et al.
Reference Jamin, Gordillo, Ruiz-Chavarría, Berhanu and Falcon2015). Due to the absence of a dynamic mask implementation, PIV is performed on a window located 5 mm below the mean-free surface. 3195 images are recorded with a fast camera during 12.78 s with a frame rate of 250 Hz. The 2-D velocity field from PIV obtained for a forcing level corresponding to
 $\unicode[STIX]{x1D70E}_{h}=2.4~\text{mm}$
are depicted in figure 3 and provides a qualitative complement to the 2-D free-surface deformation measurement with DLP.
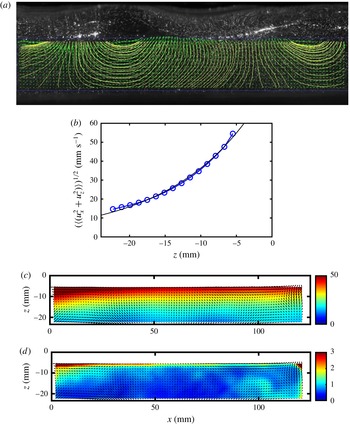
(a) Superimposition of an image used for PIV measurement, with the velocity field found in water (green arrows) and the corresponding streamlines (yellow) for
 $\unicode[STIX]{x1D70E}_{h}=2.4~\text{mm}$
. The width of the image is 121 mm. (b) Averaged vertical profile of the r.m.s. velocity (blue circles). The black line displays an exponential fit
 $\text{e}^{-k|z|}$
with
 $k=82.4~\text{m}^{-1}$
.
 $z=0$
corresponds to the free-surface position at rest. (c) Temporally averaged velocity field (arrows) and r.m.s. velocity in a colour scale (
 $\text{mm}~\text{s}^{-1}$
). The paddle producing the wave is located on the left side. (d) Temporally averaged velocity field (arrows) and temporally averaged r.m.s. vorticity field in a colour scale (
 $\text{s}^{-1}$
). A significant vorticity is present in the top layer.

The velocity field
 $\boldsymbol{u}(x,z)$
appears to follow the structure given by the large gravity waves. An instantaneous snapshot is displayed in figure 3(a). After temporal averaging, the presence of the mean velocity field of one centimetre per second becomes apparent, depicted by black arrows in figure 3(c,d). This observation may be associated either with the transient excitation of a standing wave mode during the measurement or nonlinear streaming induced by the wavemaker. In the top layer the average horizontal velocity is found to be
 $\langle u_{x}\rangle =0.26~\text{mm}~\text{s}^{-1}$
. In contrast, the average root-mean-square (r.m.s.) velocity
 $\langle \sqrt{u_{x}^{2}+u_{z}^{2}}\rangle$
is larger and is depicted in a colour scale in figure 3(c). The r.m.s. velocity decreases with the distance to the free surface. The r.m.s. velocity follows an exponential law whose wavenumber
 $k=82.4~\text{m}^{-1}$
belongs to the forcing range, showing that the velocity field is mainly induced by gravity wave propagation.
Then the r.m.s. vorticity along the
 $y$
axis,
 $\unicode[STIX]{x1D734}=\unicode[STIX]{x1D735}\times \boldsymbol{u}$
appears of significant amplitude (about
 $2~\text{s}^{-1}$
) in the top layer, close to the free surface. This observation is unexpected because surface wave propagation is theoretically described only for potential flows. Nevertheless, the large-scale picture shows that the random gravity wave excitation is not associated with bulk hydrodynamic turbulence, as expected. The top layer with high vorticity, despite not being directly in contact with the free surface, could be related to the vortex generation by parasitic capillary waves, as was reported (Fedorov & Melville Reference Fedorov and Melville1998; Lin & Perlin Reference Lin and Perlin2001). The order of magnitude is coherent with the estimation
 $\unicode[STIX]{x1D6FA}\approx 2(\unicode[STIX]{x1D70E}_{h}k)^{2}\unicode[STIX]{x1D714}$
(Longuet-Higgins Reference Longuet-Higgins1992; Deike et al.
Reference Deike, Popinet and Melville2015b
), by taking
 $k\approx 100~\text{m}^{-1}$
as the typical forcing wavenumber and
 $\unicode[STIX]{x1D714}\approx 2\unicode[STIX]{x03C0}5~\text{s}^{-1}$
the typical forcing pulsation. The horizontal motion of the paddle generating the waves could also inject vorticity in the bulk. Finally, the average 2-D kinetic energy per volume and mass unit
 $E_{ch}=1/2\langle \boldsymbol{u}^{2}\rangle$
of the flow is found to be
 $E_{ch}\approx 18\times 10^{-4}~\text{m}^{2}~\text{s}^{-2}$
, whereas the viscous dissipated power per volume and mass unit
 $D_{\unicode[STIX]{x1D6FA}}=\unicode[STIX]{x1D708}\langle \unicode[STIX]{x1D6FA}^{2}\rangle \approx 3.3\times 10^{-4}~\text{m}^{2}~\text{s}^{-3}$
. The energy dissipated during a wave period is thus smaller than the kinetic energy
 $E_{ch}$
. By fitting the decay of the vorticity with
 $z$
by a decreasing exponential, a typical scale
 $l_{\unicode[STIX]{x1D6FA}}=1.59~\text{mm}$
is found. The potential flow assumption should be thus valid for waves whose wavelengths are larger than
 $l_{\unicode[STIX]{x1D6FA}}$
or
 $1/\unicode[STIX]{x1D706}<630~\text{m}^{-1}$
. We assume in the following that the hydrodynamic flow is mostly the potential flow induced by wave propagation.
3 Analysis of stationary regimes in Fourier space
3.1 Random statistics of the wave field
First, we aim to verify that there are no phase correlations in the wave field and that waves propagate independently. To measure the phase of the waves, we perform a spatial Fourier analysis of the field of free-surface deformation
 $\unicode[STIX]{x1D702}=h(x,y,t)-\langle h\rangle$
, as was done for bending waves in a plate in the study of elastic wave turbulence (Mordant Reference Mordant2010):
 $$\begin{eqnarray}\tilde{\unicode[STIX]{x1D702}}(\boldsymbol{k},t)={\displaystyle \frac{1}{2\unicode[STIX]{x03C0}}}\int _{0}^{L_{y}}\int _{0}^{L_{x}}\unicode[STIX]{x1D702}(x,y,t)\text{e}^{-\text{i}(k_{x}x+k_{y}y)}\,\text{d}x\,\text{d}y.\end{eqnarray}$$
The decomposition in a 2-D Fourier space define wave modes
 $\tilde{\unicode[STIX]{x1D702}}(\boldsymbol{k},t)$
as a complex function evolving in time for a given
 $\boldsymbol{k}$
, whose phase evolutions
 $\unicode[STIX]{x1D719}_{\boldsymbol{k}}(t)$
are obtained by taking the argument of
 $\tilde{\unicode[STIX]{x1D702}}(\boldsymbol{k},t)$
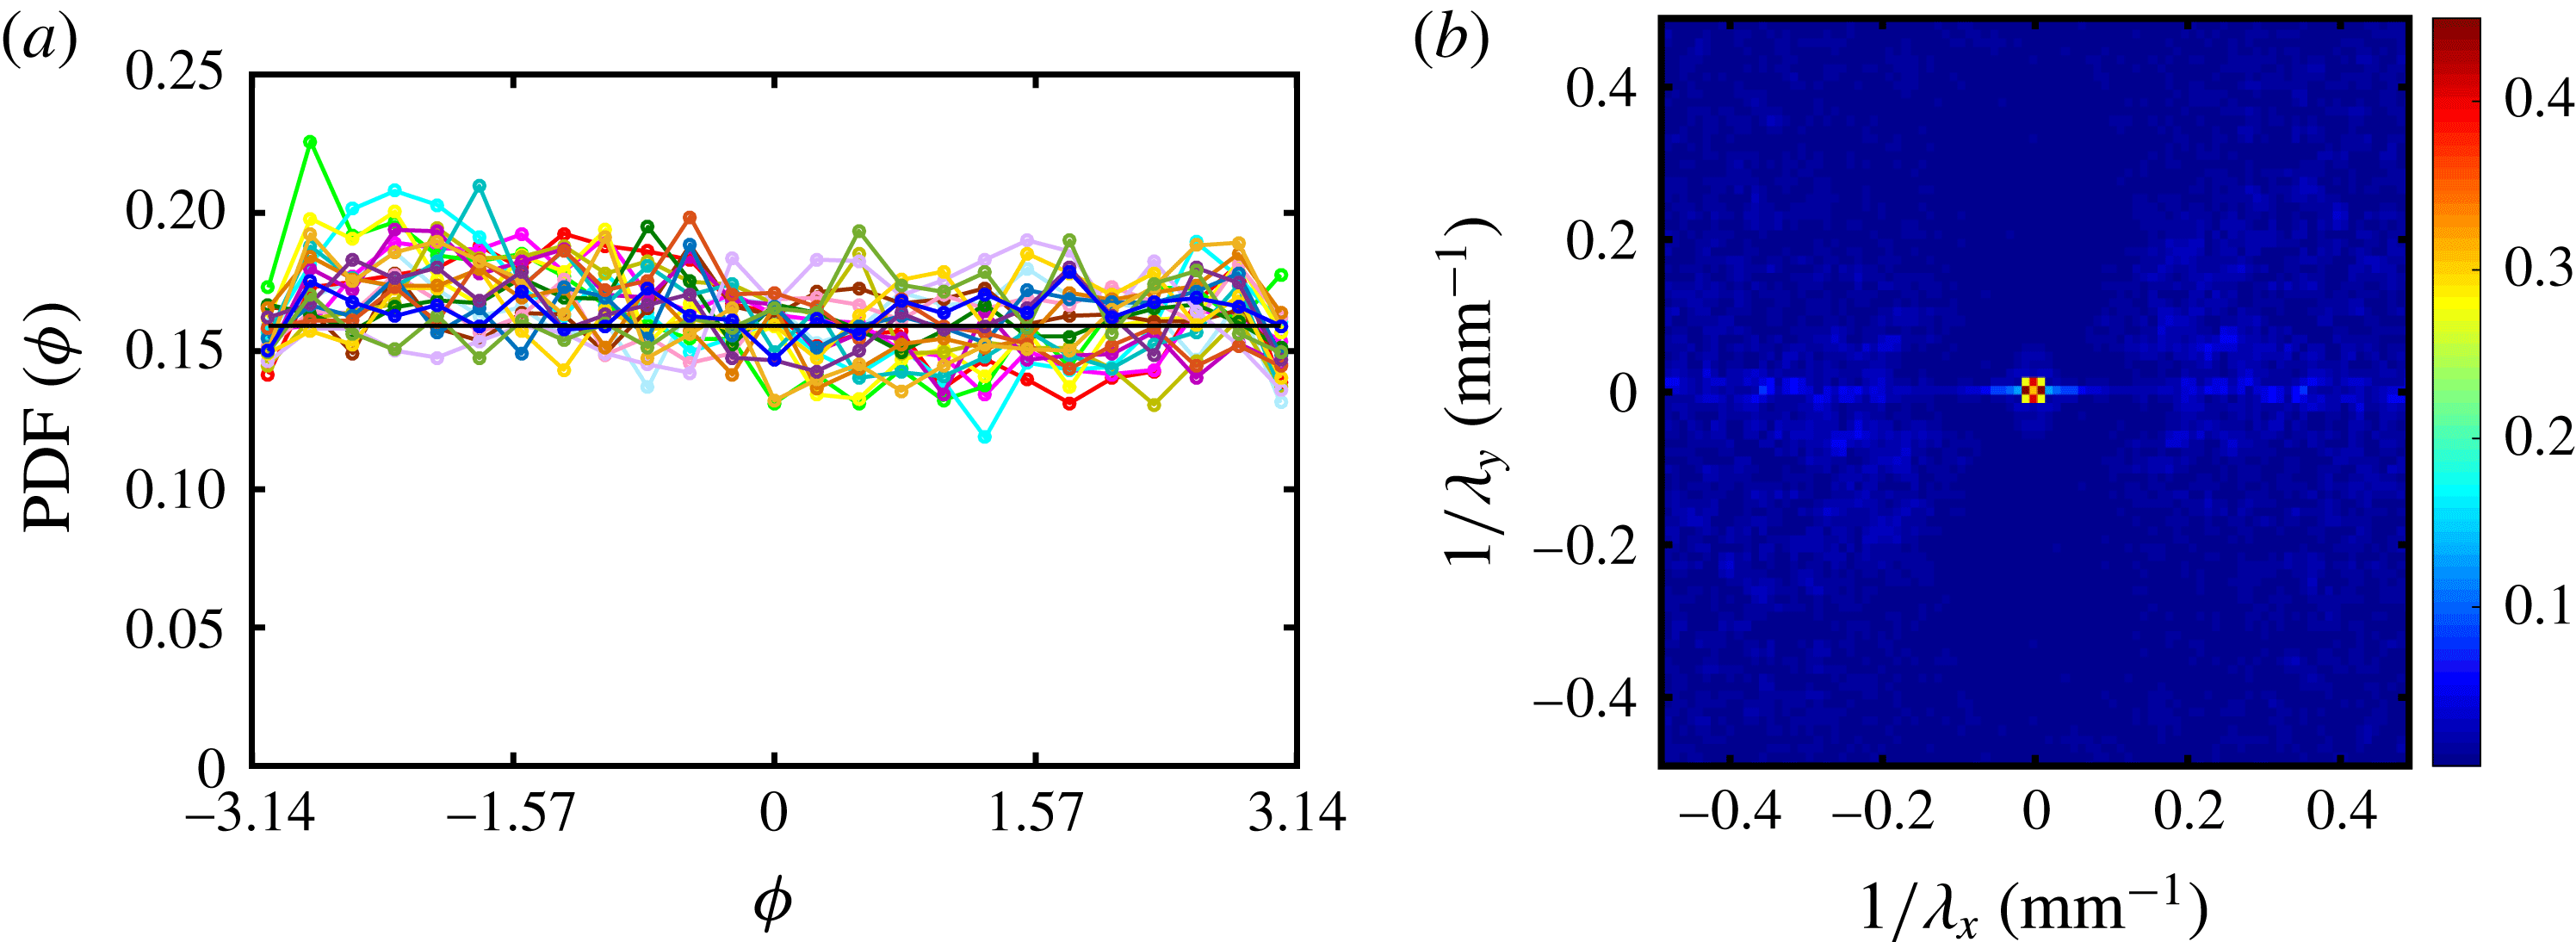
. For the highest-amplitude measurement, the probability density functions (PDFs) of
 $\unicode[STIX]{x1D719}$
are given in figure 4(a) for a large number (21) of equally spaced values of
 $\boldsymbol{k}=2\unicode[STIX]{x03C0}(\unicode[STIX]{x1D706}_{x}^{-1},\unicode[STIX]{x1D706}_{y}^{-1})$
varying from
 $(41.6,45.5)$
to
 $(874,956)~\text{m}^{-1}$
. The phase distributions fluctuate around the value
 $1/(2\unicode[STIX]{x03C0})$
, which corresponds to the uniform distribution. For the duration of the experiments (41 s), phases appear randomly distributed. To generalize this observation to all wave modes, the temporal average of the absolute distance to the uniform distribution is plotted in a colour scale in figure 4(b). Except in the centre at large scale, the random distribution of phases holds. Still at large scale, we note a relatively higher level along the axes, which could be caused by boundary effects.
(a) PDF (probability density function) of the temporal fluctuations of the phase
 $\unicode[STIX]{x1D719}$
of
 $\tilde{\unicode[STIX]{x1D702}}(\boldsymbol{k},t)$
, for 21 equally spaced values of
 $\boldsymbol{k}=2\unicode[STIX]{x03C0}(\unicode[STIX]{x1D706}_{x}^{-1},\unicode[STIX]{x1D706}_{y}^{-1})$
varying from
 $(41.6,45.5)$
to
 $(874,956)~\text{m}^{-1}$
. The black line is the uniform distribution
 $1/(2\unicode[STIX]{x03C0})$
. The case displayed corresponds to
 $\unicode[STIX]{x1D70E}_{h}=3.6~\text{mm}$
. (b) Colour map of the absolute distance to the uniform distribution
 $\langle |\text{PDF}(\unicode[STIX]{x1D719})-1/(2\unicode[STIX]{x03C0})|\rangle$
as a function of
 $\unicode[STIX]{x1D706}_{x}^{-1}$
and
 $\unicode[STIX]{x1D706}_{y}^{-1}$
. Except at large scale, for
 $\boldsymbol{k}$
close to
 $(0,0)$
, the phases of free-surface deformation are uniformly distributed, as the distance to the uniform distribution is close to zero.

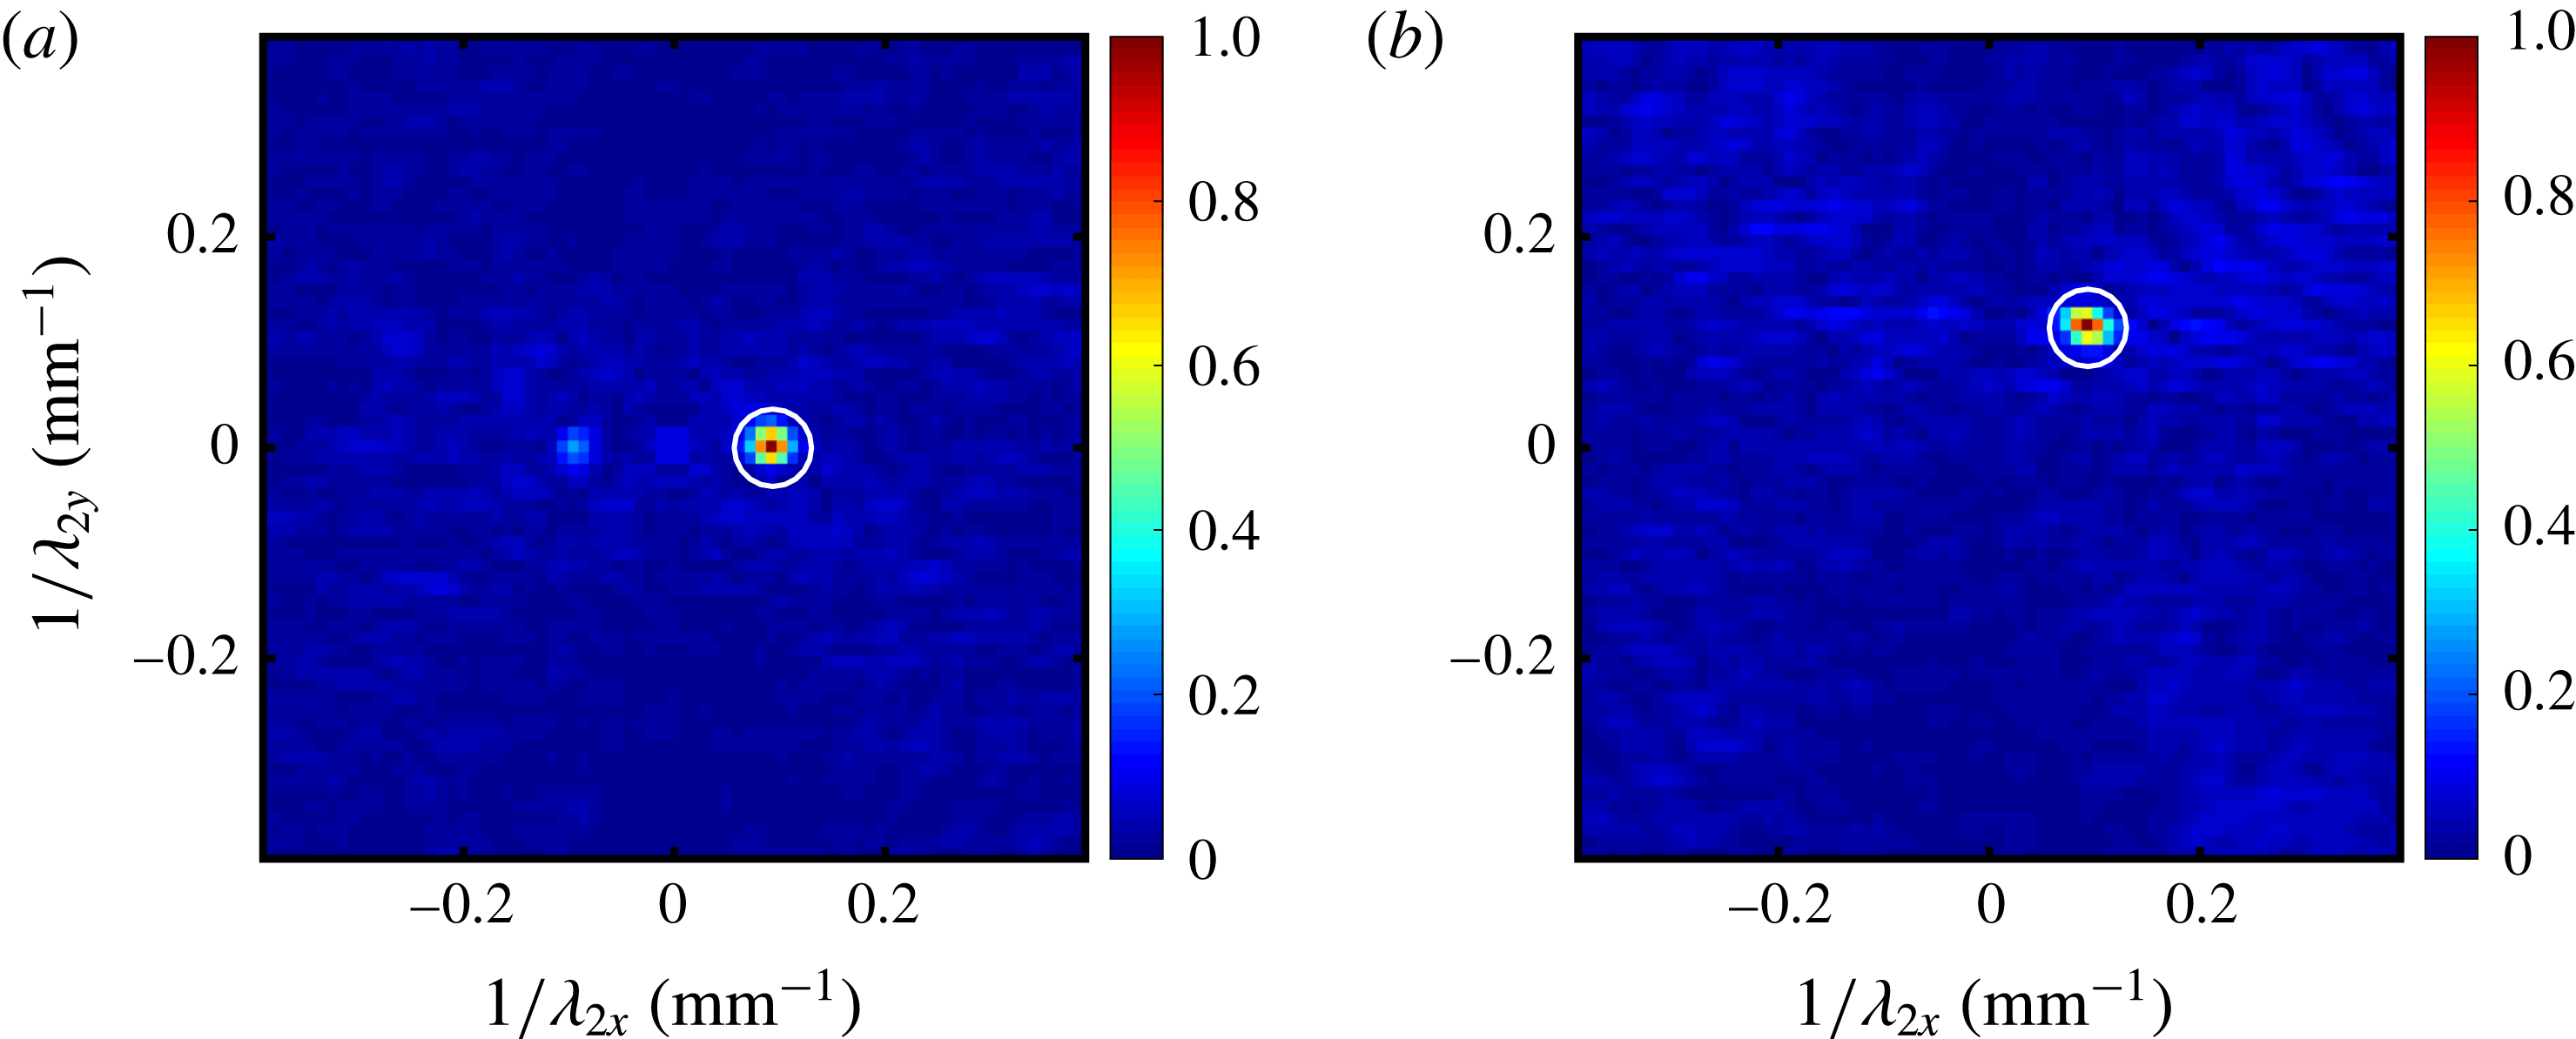
(a) Magnitude of normalized correlation (see (3.3)) between spatial Fourier modes
 $\tilde{\unicode[STIX]{x1D702}}(\boldsymbol{k}_{\mathbf{1}},t)$
and
 $\tilde{\unicode[STIX]{x1D702}}(\boldsymbol{k}_{\mathbf{2}},t)$
, for
 $\boldsymbol{k}_{\mathbf{1}}/(2\unicode[STIX]{x03C0})=(0.094,0)~\text{mm}^{-1}$
and variable
 $\unicode[STIX]{x1D706}_{2}^{-1}=k_{2}/(2\unicode[STIX]{x03C0})$
.
 $\unicode[STIX]{x1D70E}_{h}=3.6~\text{mm}$
. The white circle depicts the position of
 $\boldsymbol{k}_{\mathbf{1}}$
. (b) Same for
 $\boldsymbol{k}_{\mathbf{1}}/(2\unicode[STIX]{x03C0})=(0.094,0.1024)~\text{mm}^{-1}$
. For
 $\boldsymbol{k}_{\mathbf{1}}\neq \boldsymbol{k}_{\mathbf{2}}$
, the correlation is essentially zero at the level of convergence. The finite size of the correlation peak could be due to the resolution of the spatial Fourier transform due to the size of the images.

The independence of wave modes at leading order is a substantial consequence of a random distribution of wave phases. The statistics of the wave field in Fourier space can therefore be described using only the power spectrum. This condition is verified if the correlations of wave modes is written as:
 $$\begin{eqnarray}\langle \tilde{\unicode[STIX]{x1D702}}(\boldsymbol{k}_{\mathbf{1}},t)\tilde{\unicode[STIX]{x1D702}}(\boldsymbol{k}_{\mathbf{2}},t)\rangle \propto \unicode[STIX]{x1D6FF}(\boldsymbol{k}_{\mathbf{1}}-\boldsymbol{k}_{\mathbf{2}}),\end{eqnarray}$$
where
 $\unicode[STIX]{x1D6FF}$
is the Dirac delta function. This property is tested for two examples for the measurement at highest amplitude (shown in figure 5), by computing the normalized correlation between Fourier modes:
 $$\begin{eqnarray}{\displaystyle \frac{|\langle \tilde{\unicode[STIX]{x1D702}}(\boldsymbol{k}_{\mathbf{1}},t)\tilde{\unicode[STIX]{x1D702}}(\boldsymbol{k}_{\mathbf{2}},t)^{\star }\rangle |}{\sqrt{\langle |\tilde{\unicode[STIX]{x1D702}}(\boldsymbol{k}_{\mathbf{1}},t)|\rangle \langle |\tilde{\unicode[STIX]{x1D702}}(\boldsymbol{k}_{\mathbf{2}},t)|\rangle }}}.\end{eqnarray}$$
For
 $\boldsymbol{k}_{\mathbf{1}}\neq \boldsymbol{k}_{\mathbf{2}}$
, the correlation is essentially zero at the level of convergence. The finite size of the correlation peak could be due to the resolution of spatial Fourier transform due to the size of the images.
At the leading order, phases of wave modes appear uncorrelated, especially for the scales of capillary wave propagation, i.e.
 $\unicode[STIX]{x1D706}^{-1}>0.064~\text{mm}^{-1}$
(
 $k\geqslant 100~\text{m}^{-1}$
), which justifies a description using mainly power spectra. At the third order, nonlinear wave interactions are investigated using phase correlations in § 3.4. Note that the absence of phase correlation related to the finite-size tank can appear as a surprising result. Despite the random excitation, multiple reflections on the wall of the tank could build phase correlations in the spatial Fourier space. But, due to viscous dissipation, we show in appendix A that waves with
 $k\geqslant 275~\text{m}^{-1}$
(
 $f\geqslant 10~\text{Hz}$
) are damped before experiencing reflections on the walls. The significant dissipation may thus explain the absence of wave correlations and of quantization of wavenumbers in a finite-size tank.
3.2 Experimental dispersion relation
The analysis at small scale of a random wave field is performed in a stationary regime in the Fourier space
 $(\unicode[STIX]{x1D714},\boldsymbol{k})$
. The space and time power spectrum of wave elevation
 $S_{\unicode[STIX]{x1D702}}(\unicode[STIX]{x1D714},\boldsymbol{k})$
is computed from the set of free-surface images
 $h(x,y,t)$
(
 $\unicode[STIX]{x1D702}=h-\langle h\rangle$
), by performing successively a 2-D Fourier transform in space, and a Fourier transform in time, and then by taking the square modulus,
 $$\begin{eqnarray}S_{\unicode[STIX]{x1D702}}(\unicode[STIX]{x1D714},\boldsymbol{k})={\displaystyle \frac{1}{L_{x}L_{y}T}}|\tilde{\unicode[STIX]{x1D702}}(k_{x},k_{y},\unicode[STIX]{x1D714})|^{2},\end{eqnarray}$$
with
 $$\begin{eqnarray}\tilde{\unicode[STIX]{x1D702}}(k_{x},k_{y},\unicode[STIX]{x1D714})=\int _{0}^{T}\int _{0}^{L_{y}}\int _{0}^{L_{x}}\unicode[STIX]{x1D702}(x,y,t)\text{e}^{-\text{i}(k_{x}x+k_{y}y+\unicode[STIX]{x1D714}t)}\,\text{d}x\,\text{d}y\,\text{d}t.\end{eqnarray}$$
The result is then converted into radial coordinates
 $(k=\Vert \boldsymbol{k}\Vert ,\unicode[STIX]{x1D703})$
and integrated over the different directions of
 $\boldsymbol{k}$
to obtain the one-dimensional (1-D) spectrum.
 $$\begin{eqnarray}S_{\unicode[STIX]{x1D702}}(\unicode[STIX]{x1D714},k)=\int _{0}^{2\unicode[STIX]{x03C0}}S_{\unicode[STIX]{x1D702}}(\unicode[STIX]{x1D714},k,\unicode[STIX]{x1D703})k\,\text{d}\unicode[STIX]{x1D703}.\end{eqnarray}$$
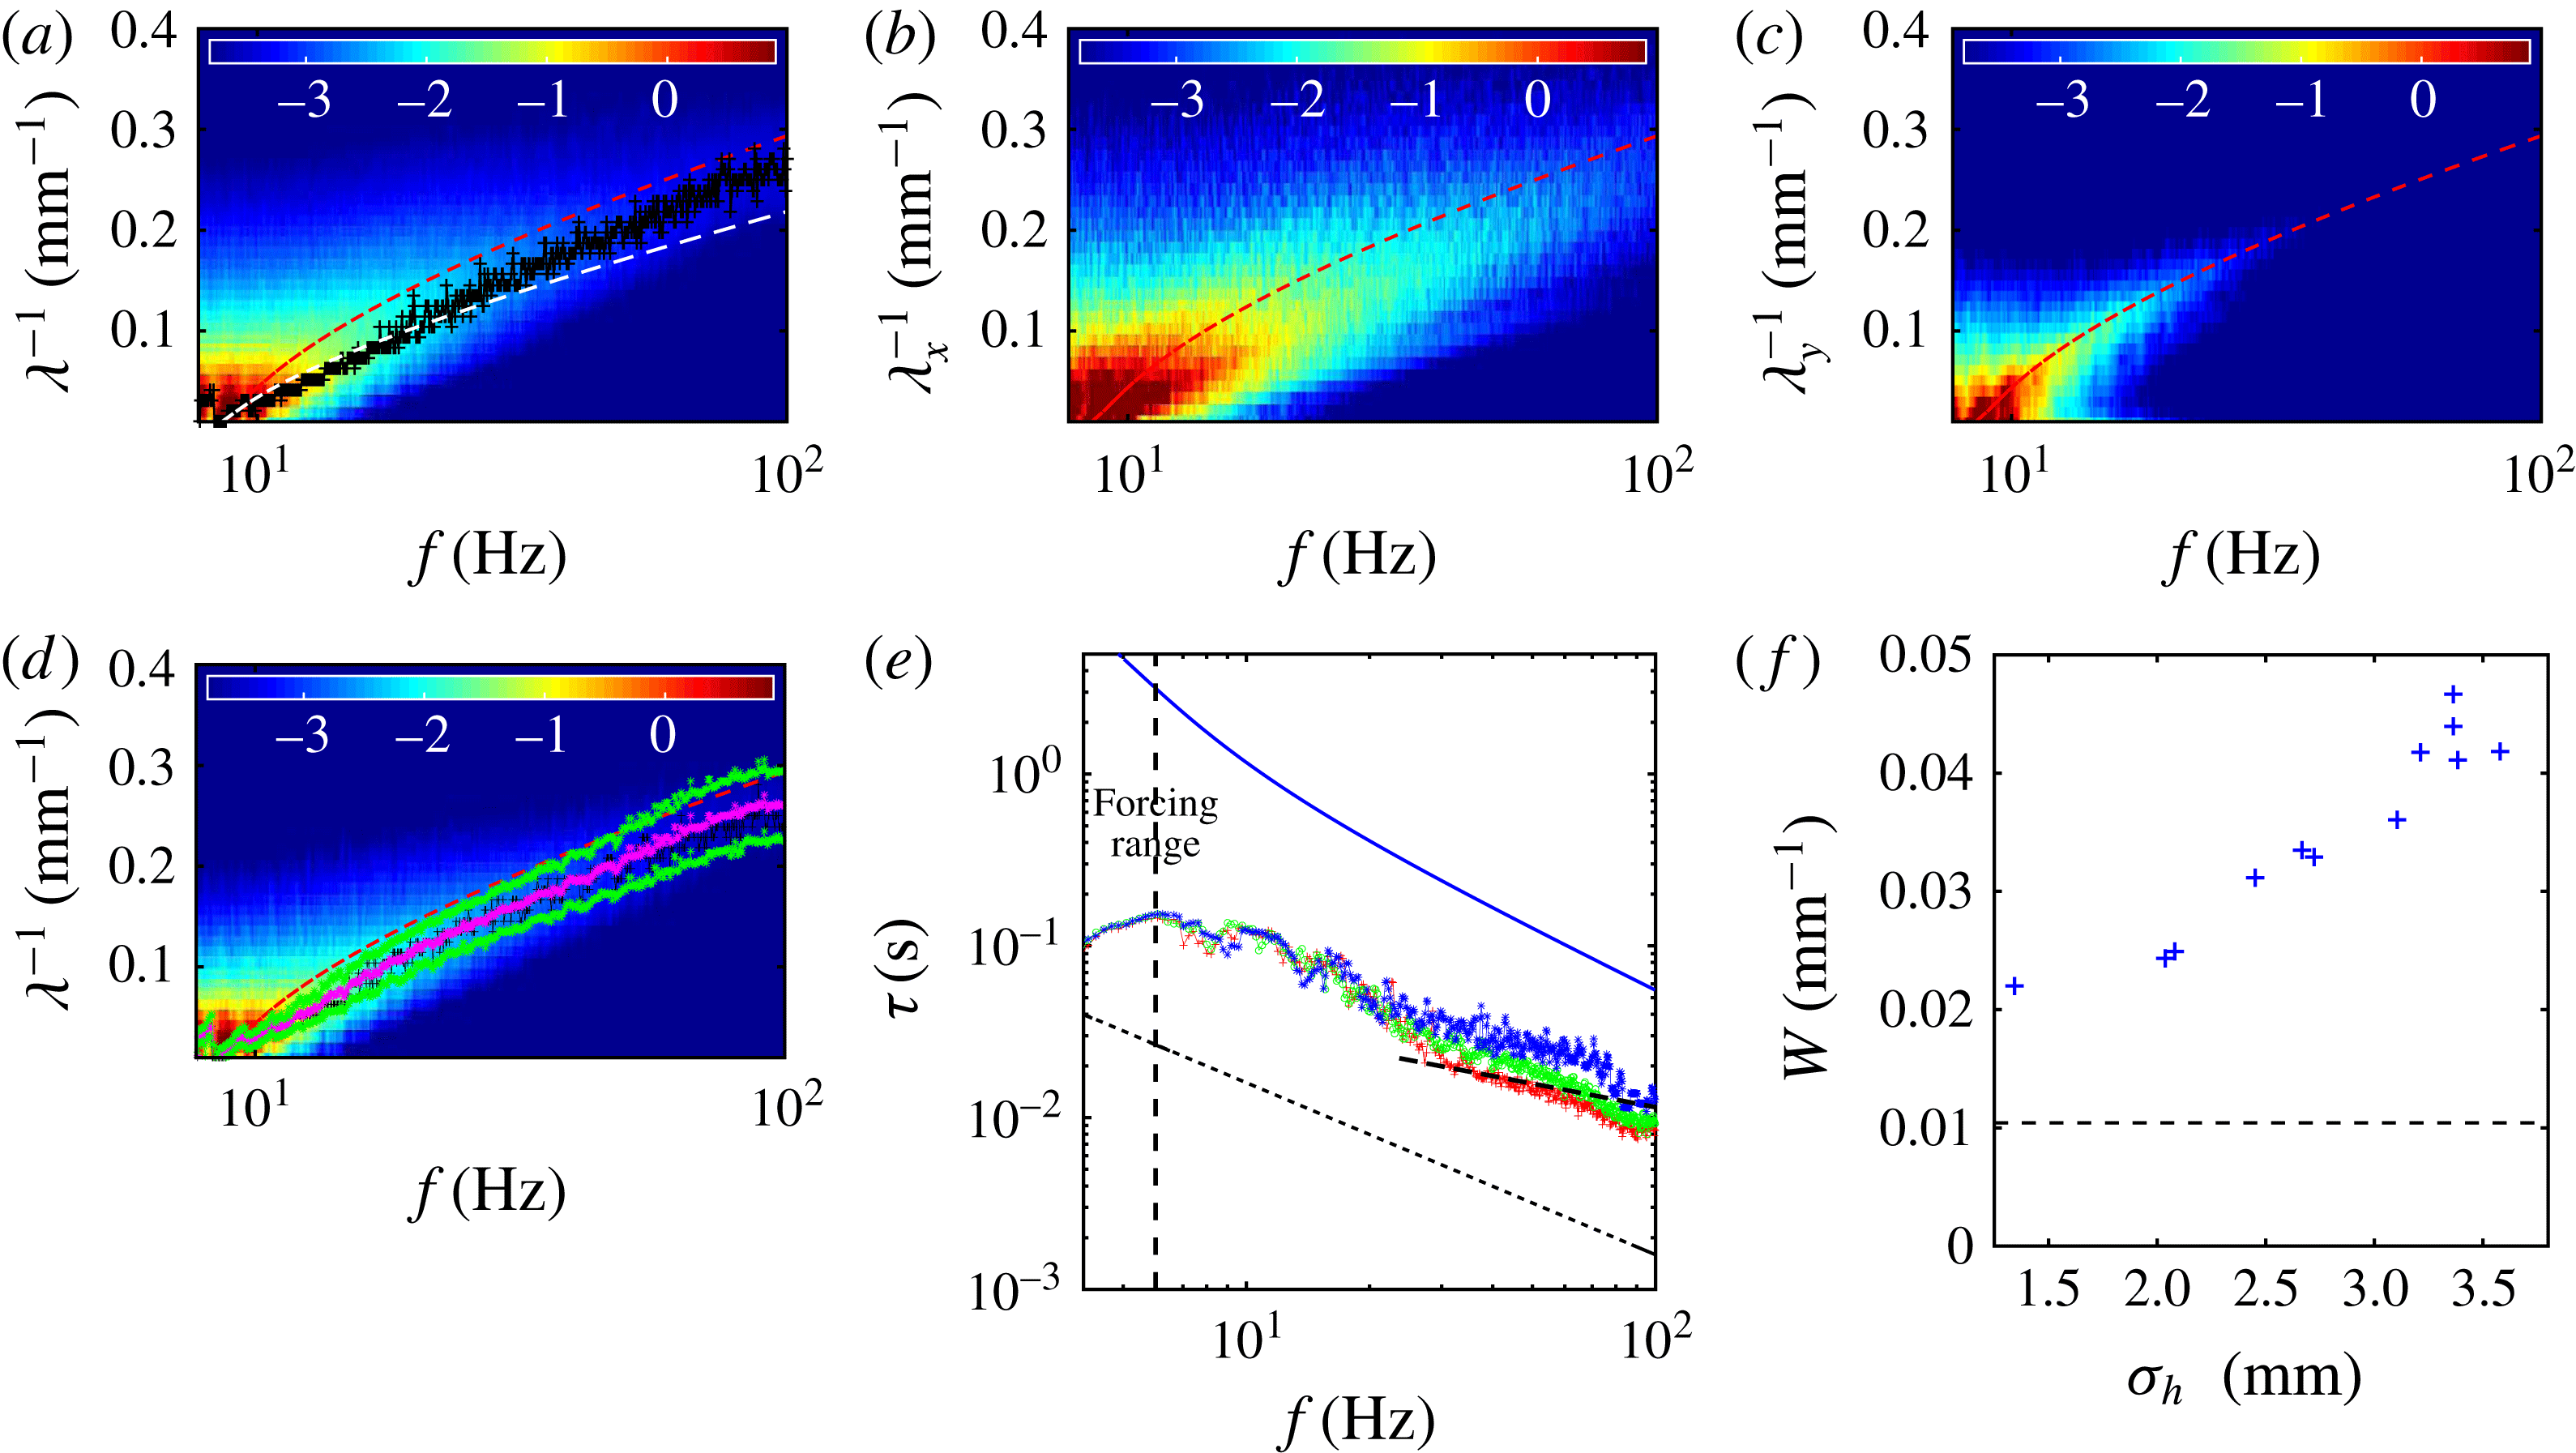
(a) Spatio-temporal spectrum of wave elevation
 $S_{\unicode[STIX]{x1D702}}(\unicode[STIX]{x1D714},k)$
for
 $\unicode[STIX]{x1D70E}_{h}=3.6~\text{mm}$
. (
 $+$
) Experimental dispersion relation extracted from the maxima of
 $S_{\unicode[STIX]{x1D702}}(\unicode[STIX]{x1D714},k)$
. Red (dark grey) dashed line: linear theoretical dispersion relation (6). White dashed line: nonlinear dispersion relation with
 $a=\unicode[STIX]{x1D70E}_{h}$
(3.8). Colour scale corresponds to
 $\log _{10}(S_{\unicode[STIX]{x1D702}}(\unicode[STIX]{x1D714},k))$
. (b) Spatio-temporal spectrum of wave elevation
 $S_{\unicode[STIX]{x1D702}}(\unicode[STIX]{x1D714},k_{x})$
in the forcing direction with the same parameters. (c) Spatio-temporal spectrum of wave elevation
 $S_{\unicode[STIX]{x1D702}}(\unicode[STIX]{x1D714},k_{y})$
in the direction perpendicular to the forcing with the same parameters. (d) Spatio-temporal spectrum of wave elevation
 $S_{\unicode[STIX]{x1D702}}(\unicode[STIX]{x1D714},k)$
for
 $\unicode[STIX]{x1D70E}_{h}=3.4~\text{mm}$
. The (*) represent the centre (magenta) and the approximate upper and lower limits (green) of the experimental dispersion relation. (e) Typical correlation times
 $\unicode[STIX]{x1D70F}_{c}$
extracted from the width of the dispersion relation, for
 $\unicode[STIX]{x1D70E}_{h}=3.6~\text{mm}$
(red
 $+$
),
 $\unicode[STIX]{x1D70E}_{h}=3.4~\text{mm}$
(green
 $\times$
) and
 $\unicode[STIX]{x1D70E}_{h}=2.1~\text{mm}$
(blue *). Dashed black line: linear time
 $1/\unicode[STIX]{x1D714}$
. Blue line: linear dissipative time. Black dashed thick line: power law
 $f^{-1/2}$
. (f) Dependence of dispersion relation width
 $W(f^{\ast })$
on the wave amplitude for
 $f^{\ast }=30~\text{Hz}$
. Dashed horizontal line:
 $\unicode[STIX]{x1D6FF}\unicode[STIX]{x1D706}^{-1}=1/L$
resolution due to the finite size of the image.

The spectrum
 $S_{\unicode[STIX]{x1D702}}(\unicode[STIX]{x1D714},k)$
displayed in figure 6(a) reveals the spreading of wave energy in time and space. For sufficiently large wave amplitude, the spectrum appears continuous, without privileged scales, which constitutes one criterion of turbulent regimes. By finding the maxima of
 $S_{\unicode[STIX]{x1D702}}(\unicode[STIX]{x1D714},k)$
for each
 $\unicode[STIX]{x1D714}$
value, the experimental dispersion relation is found. Wave propagation is indeed characterized by a concentration of signal energy on a curve in the
 $(\unicode[STIX]{x1D714},k)$
space. In this case (with
 $\unicode[STIX]{x1D70E}_{h}=3.6~\text{mm}$
), we observe a small but significant departure from the linear dispersion relation (1.1), with an increase of frequency at a given wavelength. The other measurements at lower amplitude show that this shift increases with
 $\unicode[STIX]{x1D70E}_{h}$
(not displayed here), arguing for a nonlinear mechanism. A similar nonlinear shift was also reported independently in similar conditions (Aubourg & Mordant Reference Aubourg and Mordant2016). Moreover, this dispersion relation shift is anisotropic.
 $S_{\unicode[STIX]{x1D702}}(\unicode[STIX]{x1D714},k_{x})$
is plotted in figure 6(b) and
 $S_{\unicode[STIX]{x1D702}}(\unicode[STIX]{x1D714},k_{y})$
in figure 6(c). The deviation is only visible in the forcing direction
 $x$
, for which the spectrum is more intense. Typically for
 $1/\unicode[STIX]{x1D706}=0.1~\text{mm}^{-1}$
, the frequency is increased by 10 Hz or the inverse of the wavelength is reduced by
 $0.03~\text{mm}^{-1}$
.
A complete explanation is still missing, but this observation might be explained by the following mechanisms. First, a Doppler shift due to the presence of a mean horizontal current
 $\boldsymbol{u}$
, which modifies the linear dispersion relation
 $$\begin{eqnarray}(\unicode[STIX]{x1D714}-\boldsymbol{u}\boldsymbol{\cdot }\boldsymbol{k})^{2}=\left(gk+\frac{\unicode[STIX]{x1D6FE}}{\unicode[STIX]{x1D70C}}k^{3}\right)\tanh (kh_{0}).\end{eqnarray}$$
The mean horizontal velocity measured using PIV for
 $\unicode[STIX]{x1D70E}_{h}=2.45~\text{mm}$
in § 2.3 was found to be
 $\langle u_{x}\rangle =0.26~\text{mm}~\text{s}^{-1}$
. The corresponding frequency shift for
 $1/\unicode[STIX]{x1D706}=0.1~\text{mm}^{-1}$
, which would be of the order of 0.03 Hz and would not be detectable. Second, the shift could be explained by the nonlinear corrections explicitly computed for monochromatic waves, in the gravity range as Stokes waves (Whitham Reference Whitham1999) and in the capillary range as the Crapper correction (Crapper Reference Crapper1957). Considering these two corrections, the dispersion relation reads
 $$\begin{eqnarray}\unicode[STIX]{x1D714}^{2}=\left(gk[1+(ak)^{2}]+\frac{\unicode[STIX]{x1D6FE}}{\unicode[STIX]{x1D70C}}k^{3}\left[1+\left(\frac{ak}{4}\right)^{2}\right]^{-1/4}\right)\tanh (kh_{0}).\end{eqnarray}$$
By taking the amplitude
 $a$
equal to
 $\unicode[STIX]{x1D70E}_{h}$
, the magnitude of the shift is reproduced. But this estimation does not take into account the strong decrease of wave amplitude as
 $k$
increases. The nonlinear correction appears too small to justify the shift at moderate
 $k$
, and does not explain the anisotropy. Another similar mechanism could be related to the current induced by the Stokes drift due to large gravity waves. A simplified estimation of the horizontal velocity due to the Stokes drift reads
 $u_{s}=\unicode[STIX]{x1D714}k{\unicode[STIX]{x1D70E}_{h}}^{2}\approx 39~\text{mm}~\text{s}^{-1}$
, with
 $f=5~\text{Hz}$
,
 $k=96~\text{m}^{-1}$
and
 $\unicode[STIX]{x1D70E}_{h}=3.6~\text{mm}$
. The corresponding frequency shift at
 $1/\unicode[STIX]{x1D706}=0.1~\text{mm}^{-1}$
would be
 $u_{s}/\unicode[STIX]{x1D706}\approx 3.9~\text{Hz}$
, which is the correct order of magnitude. Finally, a frequency up-shift was also noticed in a simplified numerical model studying capillary waves excited by gravity waves (Watson Reference Watson1999). The wave field was decomposed in the spatial Fourier space into modes interacting through three-wave interactions. The shift of magnitude consistent with our observation is interpreted as a modulation by longer gravity waves (a ‘drag’) of short capillary waves, which are not bound waves. The capillary waves simulated with this method are qualitatively close to parasitic capillary waves. The presence of capillary wave trains may indeed explain the observed shift in experiments. We note also that the model of Fedorov & Melville (Reference Fedorov and Melville1998) predicts an increase of the phase velocity of parasitic capillary waves of class 2 (a pressure maximum is associated with the crest), which can reach as much as 20 %, as a function of gravity wave steepness. A nonlinear increase of phase velocity is indeed equivalent to a frequency up-shift of the dispersion relation. Several elements thus indicate that the observed shift is likely caused by the modulation of parasitic capillary waves by the long and steep gravity wave.
Another important feature of
 $S_{\unicode[STIX]{x1D702}}(\unicode[STIX]{x1D714},k)$
is the width of the experimental dispersion relation. In comparison with elastic waves (Cobelli et al.
Reference Cobelli, Petitjeans, Maurel, Pagneux and Mordant2009; Mordant Reference Mordant2010; Deike, Bacri & Falcon Reference Deike, Bacri and Falcon2013) and gravity wave experiments (Herbert et al.
Reference Herbert, Mordant and Falcon2010; Cobelli et al.
Reference Cobelli, Przadka, Petitjeans, Lagubeau, Pagneux and Maurel2011; Aubourg & Mordant Reference Aubourg and Mordant2016), the width of the dispersion relation appears broad. In order to quantify this observation, we apply in
 $k$
space for each frequency value
 $f^{\ast }$
a Gaussian fit:
 $$\begin{eqnarray}S_{\unicode[STIX]{x1D702}}(f^{\ast },k)=A\exp \left[\left({\displaystyle \frac{-(k-k_{DR}(f^{\ast }))}{2\unicode[STIX]{x03C0}W(f^{\ast })}}\right)^{2}\right].\end{eqnarray}$$
We extract the width of the dispersion relation
 $W(f^{\ast })$
. In figure 6(d), above the spectrum
 $S_{\unicode[STIX]{x1D702}}(\unicode[STIX]{x1D714},k)$
for
 $\unicode[STIX]{x1D70E}_{h}=3.4~\text{mm}$
, the fit is displayed with magenta stars at each frequency for the central
 $k_{DR}(f^{\ast })/(2\unicode[STIX]{x03C0})$
corresponding to the dispersion relation and also with green stars for
 $k_{DR}(f^{\ast })/(2\unicode[STIX]{x03C0})\pm W(f^{\ast })/2$
. We observe in figure 6(f) that
 $W(f^{\ast })$
increases with the wave amplitude, showing that the nonlinear effects contribute to the wave broadening. The figure is displayed for
 $f^{\ast }=30~\text{Hz}$
, but a similar behaviour is observed for other frequencies in the capillary range. The horizontal dashed line shows the spatial resolution
 $\unicode[STIX]{x1D6FF}(1/\unicode[STIX]{x1D706})=1/(2\,L)$
with
 $L=96~\text{mm}$
the size of the window of observation.
The substantial width of the dispersion relation can be interpreted in several ways. In the presence of parasitic capillary wave generation, a significant broadening of the dispersion relation for such a steepness level could be caused by modulation by Doppler effect of the frequencies of capillary waves by the orbital velocity field (Fedorov et al.
Reference Fedorov, Melville and Rozenberg1998; Fedorov & Melville Reference Fedorov and Melville1998; Watson Reference Watson1999). However, by considering a r.m.s. velocity of
 $50~\text{mm}~\text{s}^{-1}$
, estimated from PIV measurements (see § 2.3), and injecting this typical value in the Doppler-shifted dispersion relation (3.7), a broadening of order
 $10^{-3}~\text{mm}^{-1}$
is found, whereas the measured width
 $W$
is of order
 $10^{-2}~\text{mm}^{-1}$
. The width of the dispersion relation is therefore better interpreted as a correlation length due to the finite size of the wavepacket at a given frequency, as discussed in Miquel & Mordant (Reference Miquel and Mordant2011). To facilitate the discussion, we convert this correlation length into a correlation time
 $\unicode[STIX]{x1D70F}_{c}(f^{\ast })=(v_{g}2\unicode[STIX]{x03C0}W(f^{\ast })/2)^{-1}$
, with
 $v_{g}=\unicode[STIX]{x2202}\unicode[STIX]{x1D714}/\unicode[STIX]{x2202}k$
the group velocity. This finite lifetime of the wavepacket is due to wave viscous dissipation and to nonlinear wave interactions that distribute the energy of the waves through the scales.
 $\unicode[STIX]{x1D70F}_{c}$
is plotted in figure 6(e) for three-wave amplitudes as a function of the frequency and is compared to the viscous dissipative time
 $\unicode[STIX]{x1D70F}_{diss}=(\sqrt{2}\sqrt{\unicode[STIX]{x1D708}\unicode[STIX]{x1D714}}k/4)^{-1}$
(see § 6.1) and the linear time
 $1/\unicode[STIX]{x1D714}$
.
 $\unicode[STIX]{x1D70F}_{c}$
is found between
 $1/\unicode[STIX]{x1D714}$
and
 $\unicode[STIX]{x1D70F}_{diss}$
. Despite
 $\unicode[STIX]{x1D70F}_{diss}$
being found around 40 times larger than
 $1/\unicode[STIX]{x1D714}$
in the capillary range,
 $\unicode[STIX]{x1D70F}_{c}$
values are about five times
 $1/\unicode[STIX]{x1D714}$
and
 $\unicode[STIX]{x1D70F}_{c}$
evolves nearly as
 $1/f$
. The correlation time is close to the smallest possible value. The wave would not be defined if
 $\unicode[STIX]{x1D70F}_{c}<1/\unicode[STIX]{x1D714}$
. Moreover,
 $\unicode[STIX]{x1D70F}_{c}$
is usually interpreted as a typical time of nonlinear interaction (Miquel & Mordant Reference Miquel and Mordant2011). From the dimensional analysis of the quadratic interaction term for pure capillary waves (Deike et al.
Reference Deike, Bacri and Falcon2013), this nonlinear time reads:
 $(\unicode[STIX]{x1D70F}_{NL})^{-1}\sim \unicode[STIX]{x1D716}^{1/2}(\unicode[STIX]{x1D6FE}/\unicode[STIX]{x1D70C})^{-1/4}f^{1/2}$
. Here, the evolution of
 $\unicode[STIX]{x1D70F}_{c}$
as a function of
 $f$
follows relatively well the
 $f^{-1/2}$
power law in the range
 $25<f<100~\text{Hz}$
for the two highest amplitudes, which is consistent with the interpretation of
 $\unicode[STIX]{x1D70F}_{c}\sim \unicode[STIX]{x1D70F}_{NL}$
.
Weakly nonlinear models of interacting waves suppose a time-scale separation
 $1/f\ll \unicode[STIX]{x1D70F}_{NL}\ll \unicode[STIX]{x1D70F}_{diss}$
. Nonlinear exchanges of energy must occur on a typical time much smaller than the viscous decay time and much larger than the wave period (otherwise the wave blows up, i.e. disappears in a strongly nonlinear manner). Here,
 $\unicode[STIX]{x1D70F}_{c}\sim \unicode[STIX]{x1D70F}_{NL}$
is approximately
 $8$
times smaller than
 $\unicode[STIX]{x1D70F}_{d}$
and five times larger than
 $1/\unicode[STIX]{x1D714}$
. Therefore, the broad width of the experimental dispersion relations shows that the wave regimes are strongly nonlinear in terms of energy exchanges. A correlation time equal to the period corresponds typically to a number of visible crests
 ${\sim}5$
, which is coherent with capillary parasitic wave generation with few visible ripples in the front of the long gravity wave.
Note, we do not observe supplementary branches related to the occurrence of bound waves, contrary to larger-size experiments studying the gravity wave turbulence regime (Herbert et al. Reference Herbert, Mordant and Falcon2010). This is consistent with the parasitic wave generation mechanism, for which in the range between 4 and 6 Hz, parasitic capillaries are found as free waves (Perlin, Jiang & Ting Reference Perlin, Jiang and Ting1993; Fedorov et al. Reference Fedorov, Melville and Rozenberg1998).
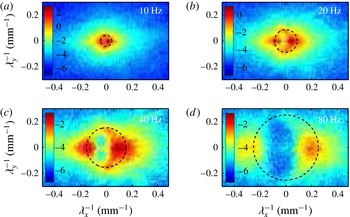
Spectrum
 $S_{\unicode[STIX]{x1D702}}(\unicode[STIX]{x1D714},{\unicode[STIX]{x1D706}_{x}}^{-1},{\unicode[STIX]{x1D706}_{y}}^{-1})$
for fixed
 $f=10$
, 20, 40 and 80 Hz, respectively (
 $\log _{10}$
colour scale) showing the anisotropy of the wave field at high forcing amplitude (
 $\unicode[STIX]{x1D70E}_{h}=3.6~\text{mm}$
and
 $\unicode[STIX]{x1D70E}_{s}=0.34$
). The anisotropy due to the forcing is still present at high frequency. Dashed black circle: linear dispersion relation of (1.1). Wave amplitudes are larger in the direction of forcing (
 $x$
-axis), revealing anisotropy in the entire frequency range.

The directional properties of the wave field are investigated in figure 7 by plotting
 $S_{\unicode[STIX]{x1D702}}(\unicode[STIX]{x1D714},\boldsymbol{k})$
as a function of
 ${\unicode[STIX]{x1D706}_{x}}^{-1}$
and
 ${\unicode[STIX]{x1D706}_{y}}^{-1}$
for fixed frequency
 $f$
. A strong anisotropy of the wave field is observed along the
 $x$
-axis, which is the forcing direction. This anisotropy is conserved regardless of the frequency scales inside the capillary waves range (see
 $f=20$
, 40 or 80 Hz). Capillary waves thus appear preferentially along the same direction as the long waves, as it would be for parasitic generation. One may suppose that superposition of several three-wave interactions for a random excitation would restore the isotropy. However, dominant 1-D interactions were also reported with waves close to the gravity–capillary crossover (Aubourg & Mordant Reference Aubourg and Mordant2015, Reference Aubourg and Mordant2016). This observation has been explained by quasi-resonant interactions, due to the significant width of the dispersion relation. Moreover, viscous dissipation and nonlinear interactions reduce the lifetimes of capillary waves. A short correlation time should favour interactions with forcing waves, and thus should increase the anisotropy of the wave field.
3.3 Spatial and temporal spectra
By computing the spatial and temporal spectra of wave elevation,
 $S_{\unicode[STIX]{x1D702}}(k)$
and
 $S_{\unicode[STIX]{x1D702}}(\unicode[STIX]{x1D714})$
, at a sufficiently high wave amplitude, we evidence power-law spectra in the capillary wave range, which would constitute the capillary wave turbulence cascade as reported previously (Berhanu & Falcon Reference Berhanu and Falcon2013). They are derived from
 $S_{\unicode[STIX]{x1D702}}(k,\unicode[STIX]{x1D714})$
by the relations:
 $$\begin{eqnarray}\displaystyle \left.\begin{array}{@{}c@{}}S_{\unicode[STIX]{x1D702}}(k)=\displaystyle \int _{0}^{\unicode[STIX]{x1D714}_{max}}S_{\unicode[STIX]{x1D702}}(k,\unicode[STIX]{x1D714})\,\text{d}\unicode[STIX]{x1D714}\\ S_{\unicode[STIX]{x1D702}}(\unicode[STIX]{x1D714})=\displaystyle \int _{0}^{k_{max}}S_{\unicode[STIX]{x1D702}}(k,\unicode[STIX]{x1D714})\,\text{d}k.\end{array}\right\} & & \displaystyle\end{eqnarray}$$
From the Parseval–Plancherel relation, the signal energy from the spectra is given by:
 $$\begin{eqnarray}\int _{0}^{k_{max}}S_{\unicode[STIX]{x1D702}}(k)\,\text{d}k=\int _{0}^{\unicode[STIX]{x1D714}_{max}}S_{\unicode[STIX]{x1D702}}(\unicode[STIX]{x1D714})\,\text{d}\unicode[STIX]{x1D714}\approx \unicode[STIX]{x1D70E}_{h}^{2}.\end{eqnarray}$$
Due to the lack of the resolution at large scale, the last expression is only approximate. When expressed as a function of
 $\unicode[STIX]{x1D706}^{-1}=k/(2\unicode[STIX]{x03C0})$
or
 $f=\unicode[STIX]{x1D714}/(2\unicode[STIX]{x03C0})$
, the correspondence between spectra is written as:
 $S_{\unicode[STIX]{x1D702}}(\unicode[STIX]{x1D706}^{-1})=(2\unicode[STIX]{x03C0})S_{\unicode[STIX]{x1D702}}(k)$
and
 $S_{\unicode[STIX]{x1D702}}(f)=(2\unicode[STIX]{x03C0})S_{\unicode[STIX]{x1D702}}(\unicode[STIX]{x1D714})$
. The power spectra
 $S_{\unicode[STIX]{x1D702}}$
are also referred by the acronym PSD (power spectrum density). The spatial spectrum
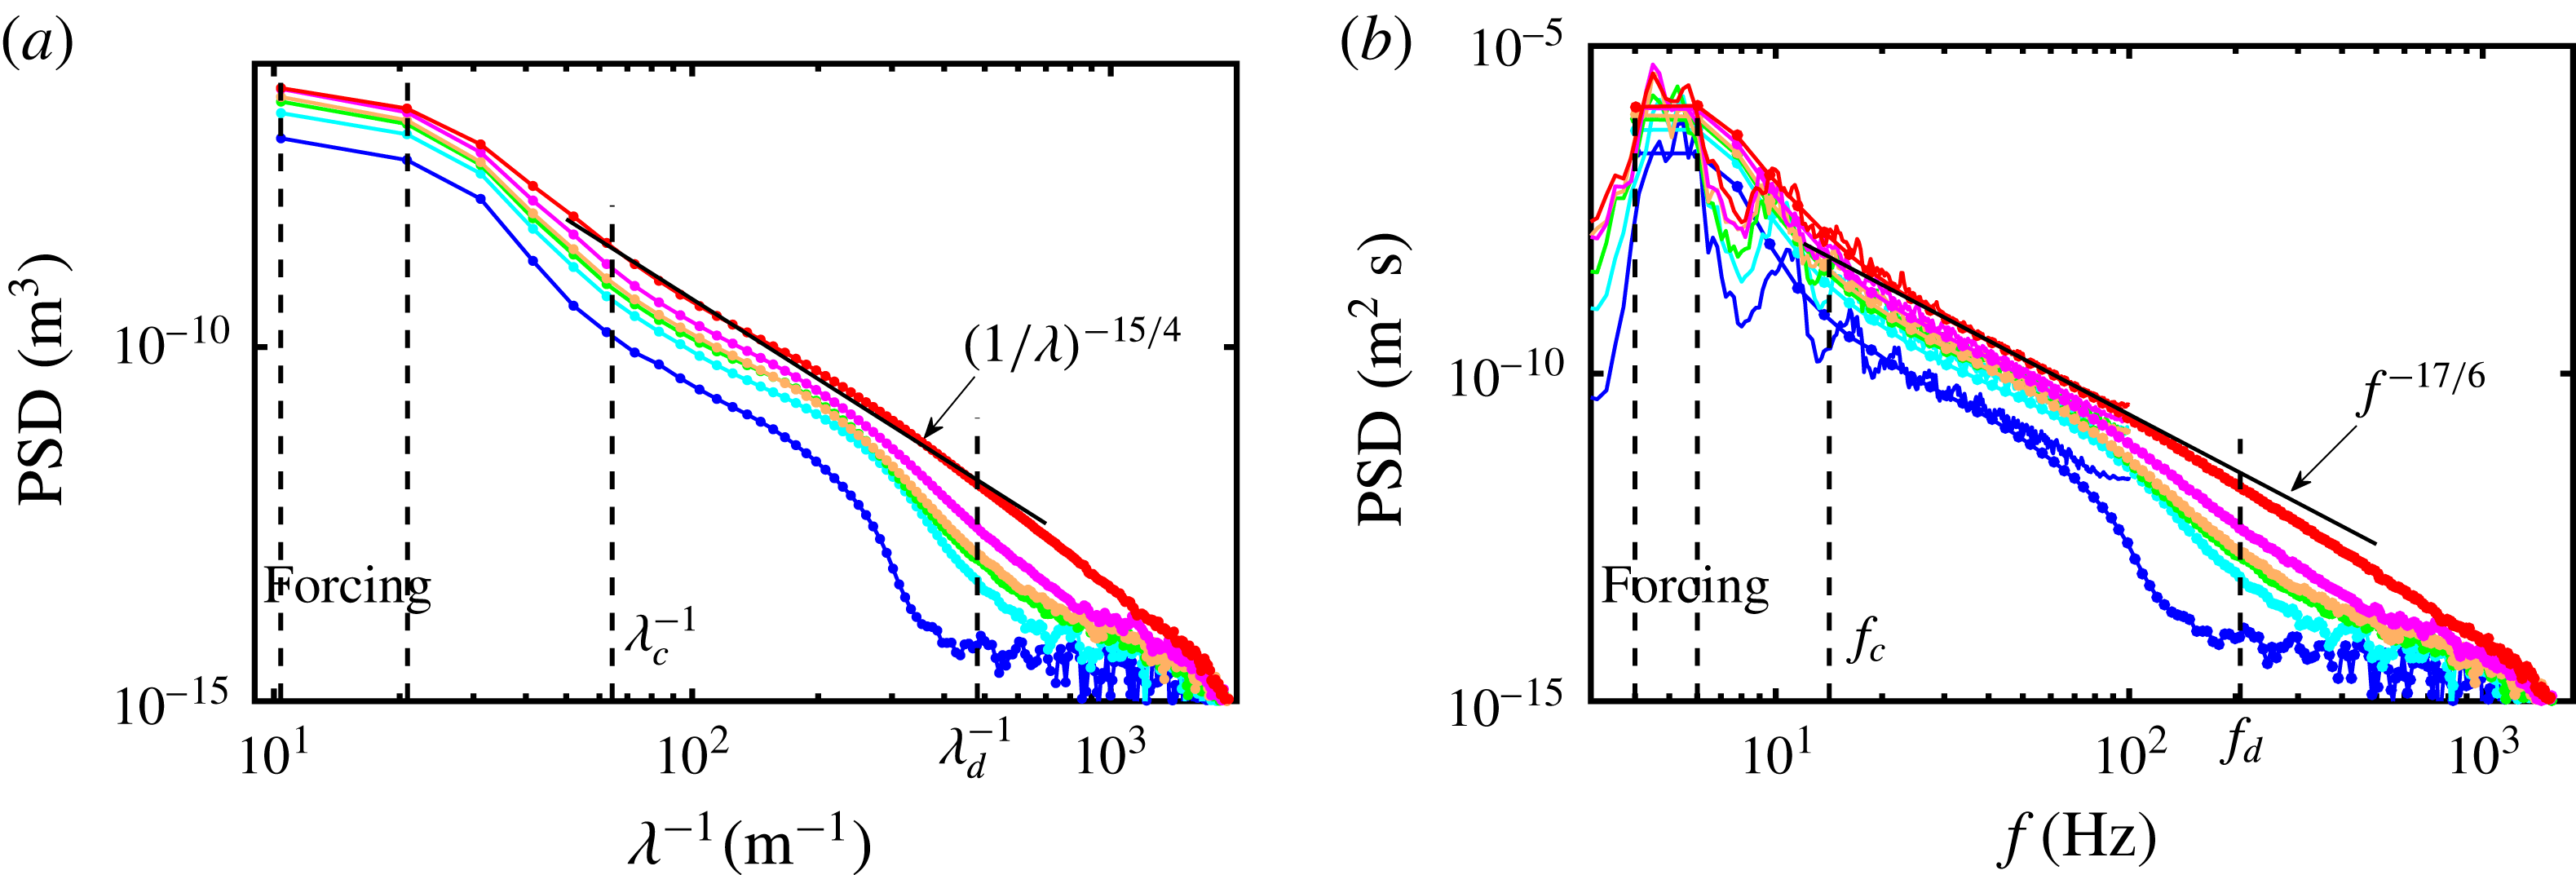
 $S_{\unicode[STIX]{x1D702}}(\unicode[STIX]{x1D706}^{-1})$
is depicted in figure 8(a) for different forcing amplitudes. For high enough wave amplitude, a power-law spectrum is indeed observed in the capillary range, i.e. for
 $k>k_{c}=1/l_{c}$
or
 $\unicode[STIX]{x1D706}<\unicode[STIX]{x1D706}_{c}=2\unicode[STIX]{x03C0}\sqrt{\unicode[STIX]{x1D6FE}/(\unicode[STIX]{x1D70C}g)}\approx 15.5~\text{mm}$
, whose exponent is close to
 $-15/4$
, the value predicted by the wave turbulence theory. Departure from the power law is observed at a scale
 $\unicode[STIX]{x1D706}_{d}^{-1}$
, equal to
 $0.48~\text{mm}^{-1}$
for the highest forcing and decreasing with wave amplitude. We note that
 $\unicode[STIX]{x1D706}_{d}$
is comparable to but larger than the typical scale of the vorticity layer
 $l_{\unicode[STIX]{x1D6FA}}$
(see § 2.3). For
 $\unicode[STIX]{x1D706}^{-1}\geqslant {\unicode[STIX]{x1D706}_{d}}^{-1}$
, viscous dissipation balances nonlinear interactions (Zakharov & Filonenko Reference Zakharov and Filonenko1967b
; Deike et al.
Reference Deike, Berhanu and Falcon2012) and self-similarity is broken. The spatial Fourier spectrum is also useful to estimate the steepness due to capillary waves only:
 $$\begin{eqnarray}\unicode[STIX]{x1D70E}_{sc}=\left(\int _{k_{c}}^{k_{d}}k^{2}S_{\unicode[STIX]{x1D702}}(k)\,\text{d}k\right)^{1/2}.\end{eqnarray}$$
For
 $\unicode[STIX]{x1D70E}_{h}=3.6~\text{mm}$
,
 $\unicode[STIX]{x1D70E}_{sc}\approx 0.15$
, when
 $\unicode[STIX]{x1D70E}_{s}=0.34$
. Therefore, the contribution to
 $\unicode[STIX]{x1D70E}_{s}$
of large gravity waves is larger than that of capillary waves, but the latter is not negligible, as found also in field observations (Bréon & Henriot Reference Bréon and Henriot2006; Melville & Fedorov Reference Melville and Fedorov2015). Moreover, this order of magnitude confirms that capillary waves are also in a nonlinear regime.
(a) Spatial power spectra
 $S_{\unicode[STIX]{x1D702}}(k)$
(power spectrum density PSD) for different forcing amplitudes. From bottom to top:
 $\unicode[STIX]{x1D70E}_{h}=1.3$
, 2.1, 2.7, 3.1, 3.4 and 3.6 mm, and
 $\unicode[STIX]{x1D70E}_{s}=0.15$
, 0.19, 0.24, 0.27, 0.29 and 0.34. Solid black line is the capillary prediction
 $k^{-15/4}$
.
 $\unicode[STIX]{x1D706}_{c}=2\unicode[STIX]{x03C0}\sqrt{\unicode[STIX]{x1D6FE}/(\unicode[STIX]{x1D70C}\,g)}\approx 15.5~\text{mm}$
is the crossover scale between gravity and capillary waves.
 $\unicode[STIX]{x1D706}_{d}\approx 2.1~\text{mm}$
is approximately for the highest amplitude, the dissipative scale, below which viscous dissipation dominates nonlinear interactions. (b) Temporal power spectra
 $S_{\unicode[STIX]{x1D702}}(\unicode[STIX]{x1D714})$
for the same measurements. Solid black line is the capillary prediction
 $f^{-17/6}$
.
 $f_{c}=14.2~\text{Hz}$
and
 $f_{d}\approx 204~\text{Hz}$
, are the equivalent of
 $\unicode[STIX]{x1D706}_{c}$
and
 $\unicode[STIX]{x1D706}_{d}$
in the frequency space. Two estimates of the frequency spectrum are shown, the first by integration over the wavenumbers of
 $S_{\unicode[STIX]{x1D702}}(\unicode[STIX]{x1D714},k)$
(continuous curves) and the second by converting the spatial spectrum in the frequency space (dotted curve) using the linear dispersion relation (1.1).

(a)
 $S_{\unicode[STIX]{x1D702}}(k)$
-exponents
 $\unicode[STIX]{x1D6FC}_{s}$
versus
 $\unicode[STIX]{x1D70E}_{h}$
(fits from
 $0.094\leqslant \unicode[STIX]{x1D706}^{-1}\leqslant 0.30~\text{mm}^{-1}$
). Dashed line shows the theoretical value
 $-15/4$
. (b)
 $S_{\unicode[STIX]{x1D702}}(f)$
-exponents
 $\unicode[STIX]{x1D6FC}_{t}$
versus
 $\unicode[STIX]{x1D70E}_{h}$
(fits from
 $20\leqslant f\leqslant 100~\text{Hz}$
). Dashed line shows the theoretical value
 $-17/6$
.

The temporal spectrum
 $S_{\unicode[STIX]{x1D702}}(\unicode[STIX]{x1D714})$
is shown in figure 8(b) for the same set of data. Two estimations are given, the first by integration over the wavenumbers of
 $S_{\unicode[STIX]{x1D702}}(\unicode[STIX]{x1D714},k)$
(continuous curves) and the second by converting the spatial spectrum in the frequency space (dotted curve) using the linear dispersion relation (1.1). Despite the shift of the experimental dispersion relation, both estimations are consistent, the first having a better resolution at low frequencies and the second reaching significantly larger frequencies. This matching of the spectra through the dispersion relation shows the consistency of our space–time measurements. As with the spatial spectrum, for high enough wave amplitude a power law is observed for the temporal spectrum between
 $f_{c}$
and
 $f_{d}$
, with an exponent close to the value
 $-17/6$
predicted by capillary wave turbulence theory. We observe that outside the forcing range the frequencies of the eigenmodes (see § 2.2) do not appear in the spectrum, due to wave viscous dissipation (see appendix A) and to the random forcing. A secondary peak in the spectrum is located at twice the typical forcing frequency. Notice that
 $f_{d}\approx 200~\text{Hz}$
for the highest forcing, and like
 $\unicode[STIX]{x1D706}_{d}$
is interpreted as the balance between viscous dissipation and nonlinear interactions.
For scales between
 $\unicode[STIX]{x1D706}_{c}$
and
 $\unicode[STIX]{x1D706}_{d}$
, power laws are fitted,
 $S_{\unicode[STIX]{x1D702}}(k)\sim k^{\unicode[STIX]{x1D6FC}_{s}}$
and
 $S_{\unicode[STIX]{x1D702}}(f)\sim f^{\unicode[STIX]{x1D6FC}_{t}}$
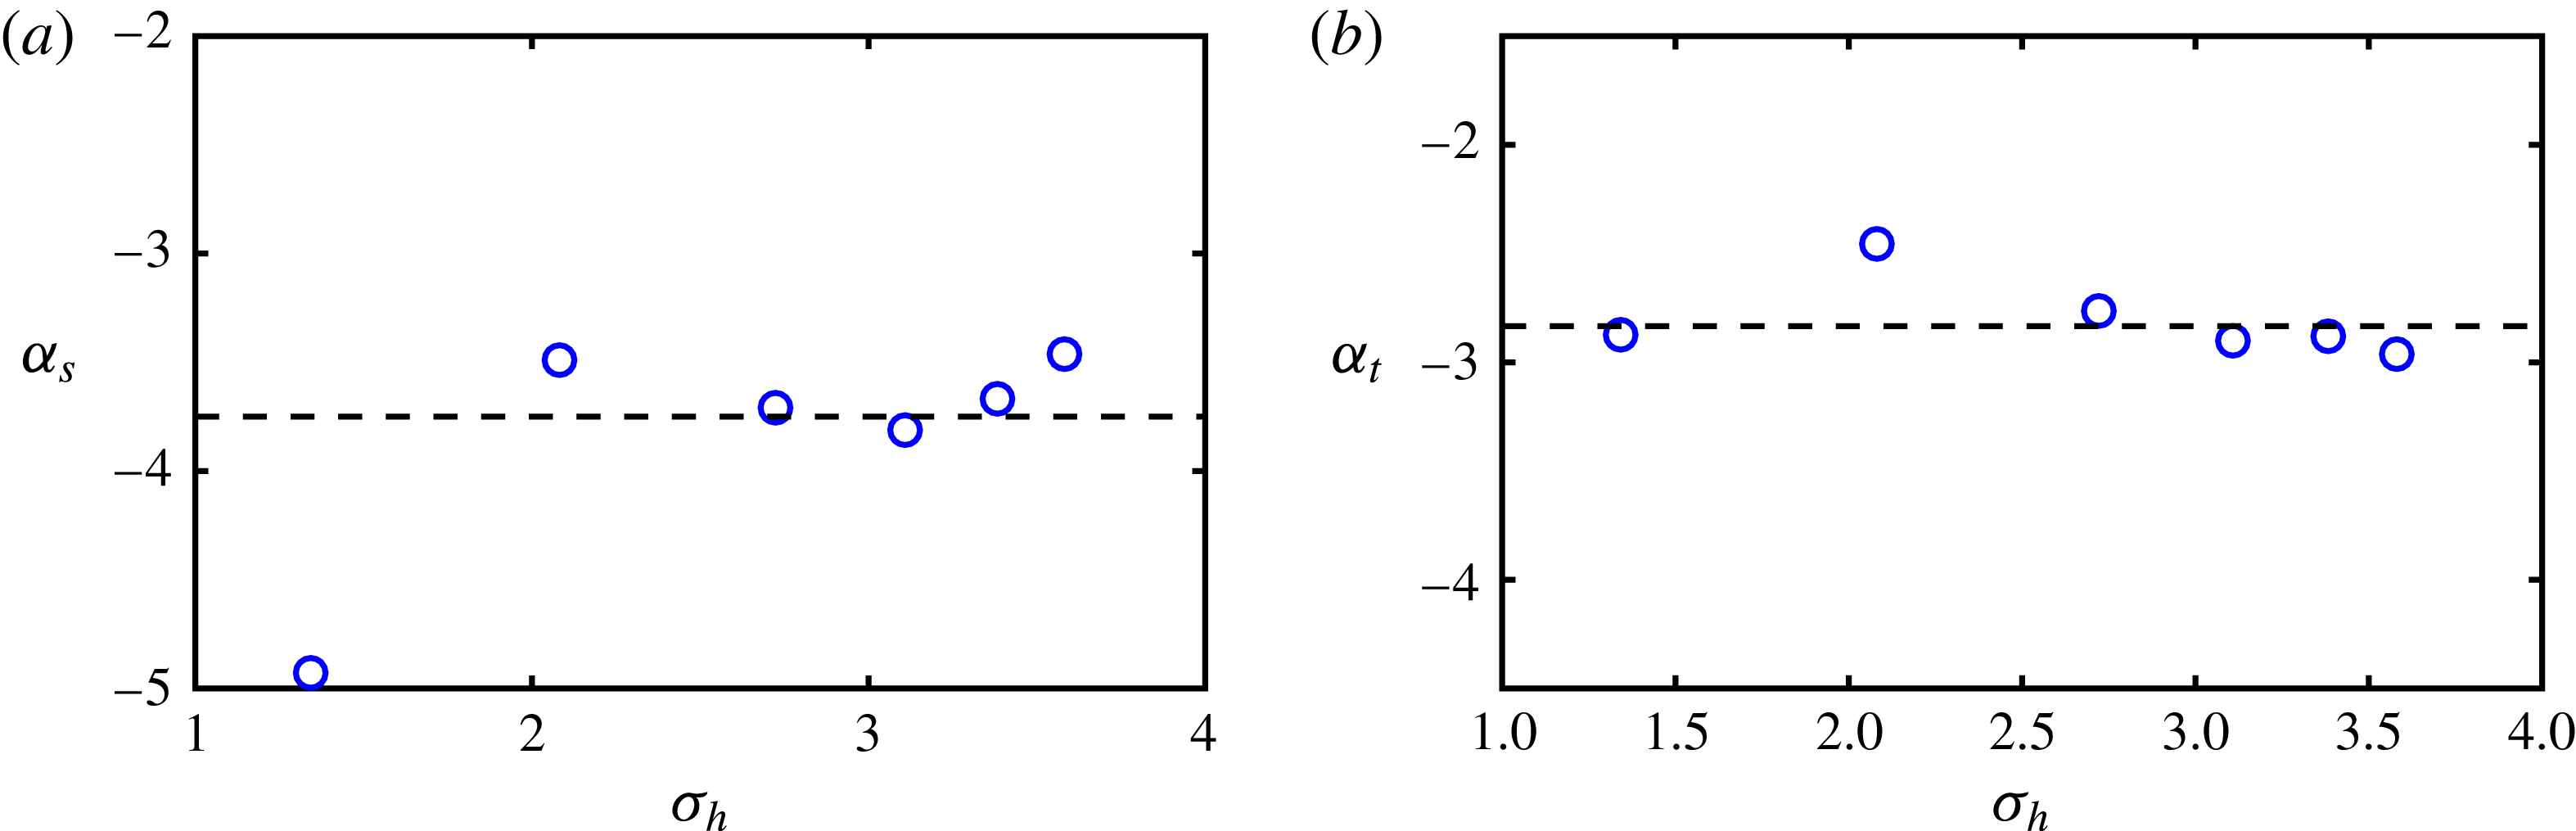
. The corresponding values of
 $\unicode[STIX]{x1D6FC}_{s}$
and
 $\unicode[STIX]{x1D6FC}_{t}$
are given in figure 9. Except at the lowest excitation amplitude,
 $\unicode[STIX]{x1D6FC}_{s}$
and
 $\unicode[STIX]{x1D6FC}_{t}$
do not depend on
 $\unicode[STIX]{x1D70E}_{h}$
and are close to the predictions of wave turbulence theory. Thus, as stated previously (Berhanu & Falcon Reference Berhanu and Falcon2013), the exponents of the spectra in the capillary wave range are in agreement with the predictions of capillary wave turbulence for
 $\unicode[STIX]{x1D70E}_{h}\geqslant 2~\text{mm}$
.
Power-law spectra of capillary waves in time and space indicate self-similar regimes of uncorrelated random waves, corresponding to an energy transfer from the large scale to the small scale, where energy is dissipated. The turbulence of the capillary waves denote these regimes resulting from nonlinear wave interactions, which are not related to hydrodynamic turbulence. However, the substantial viscous dissipation limits the inertial range (
 $[\unicode[STIX]{x1D706}_{c}^{-1},\unicode[STIX]{x1D706}_{d}^{-1}]$
or
 $[f_{c},f_{d}]$
) to only one decade in the spectrum, as observed in other experiments where capillary waves are forced by gravity waves (Falcon et al.
Reference Falcon, Laroche and Fauve2007; Deike et al.
Reference Deike, Berhanu and Falcon2012, Reference Deike, Berhanu and Falcon2014a
).
3.4 Wave correlations in time Fourier space
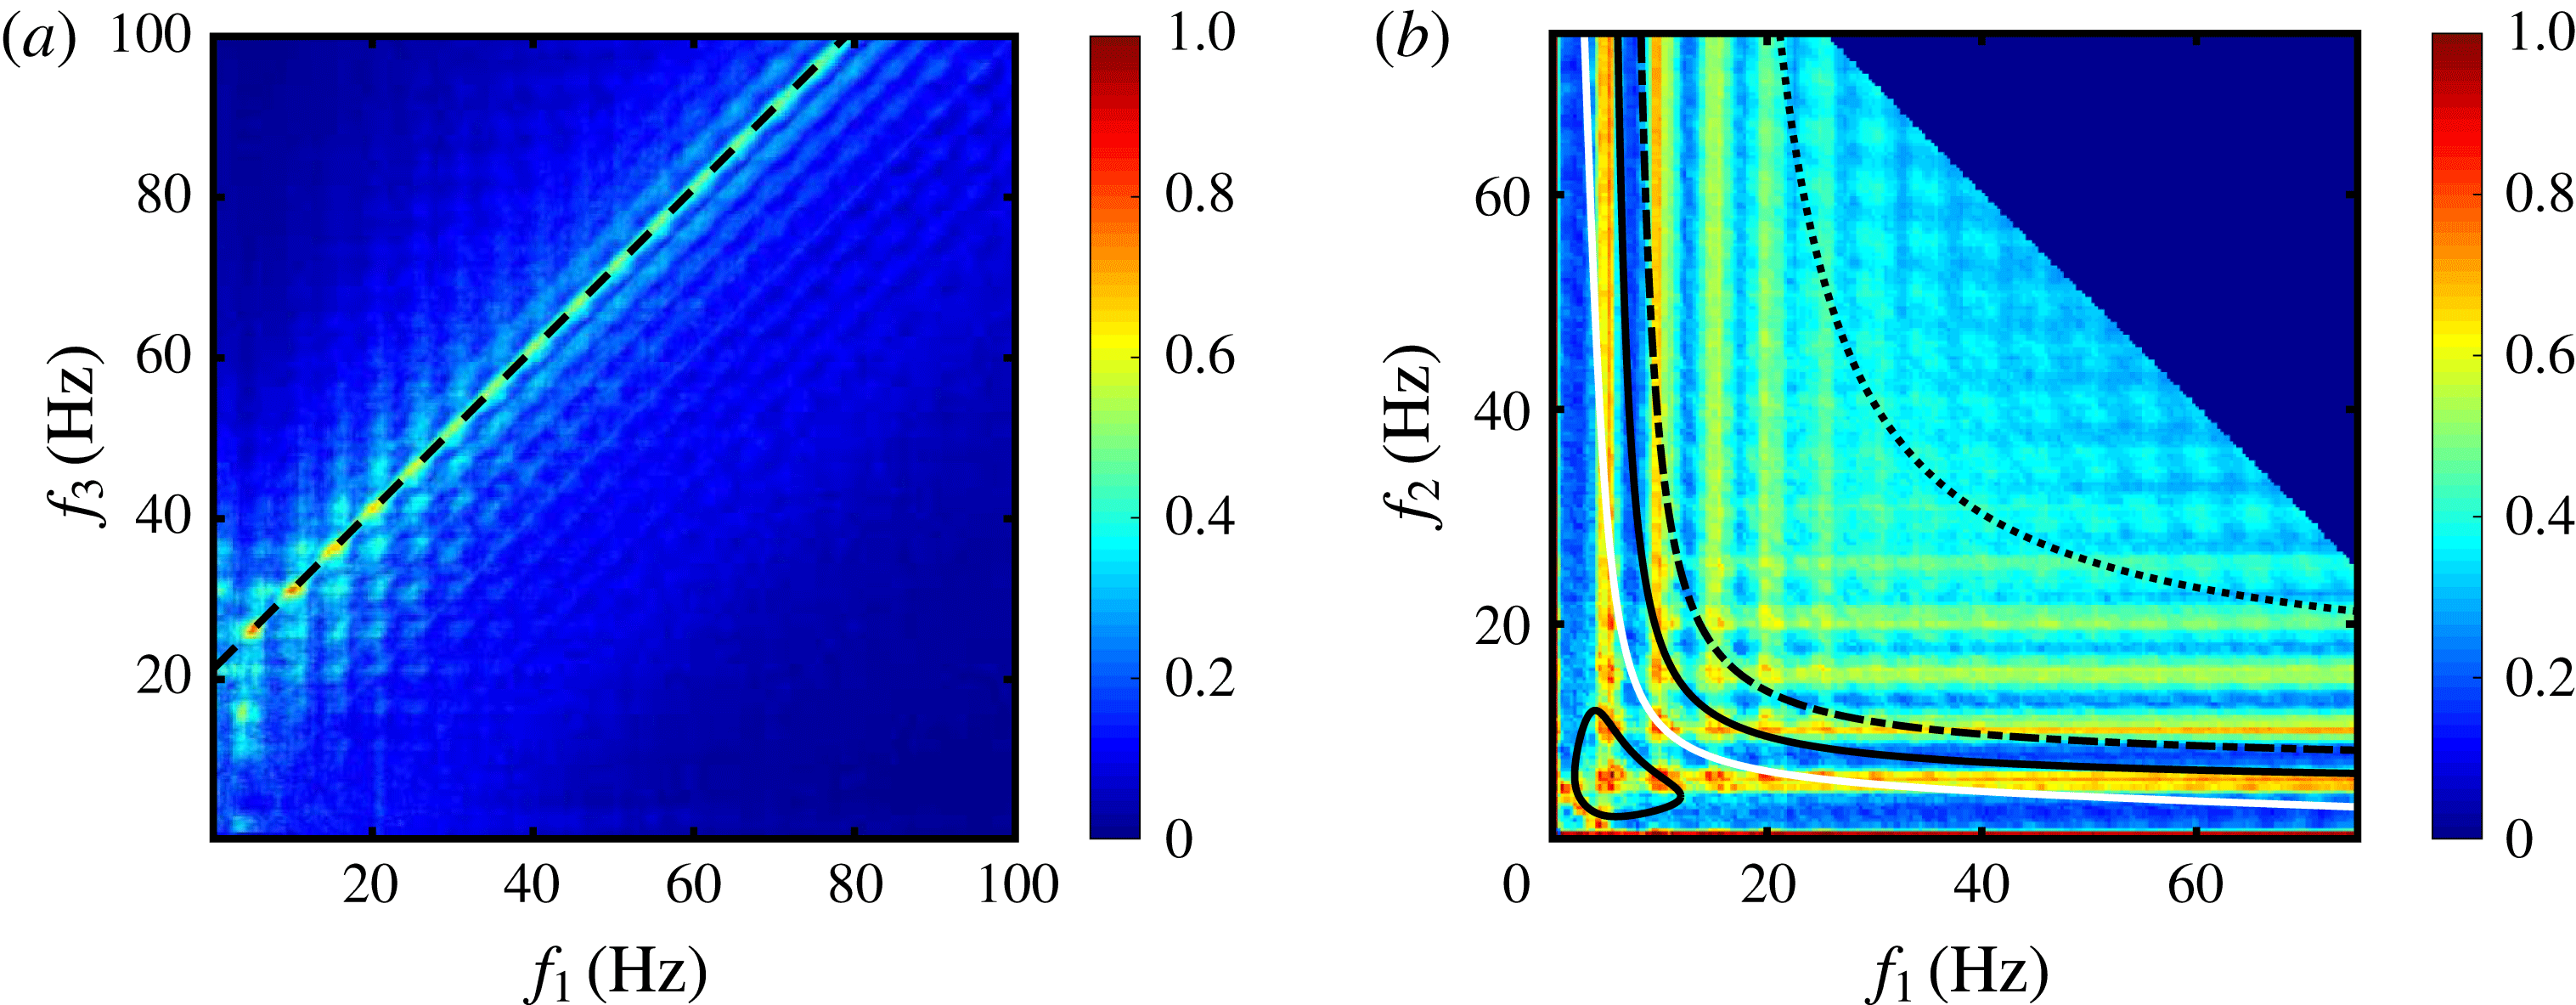
(a) Three-wave coherence or bispectrum
 $B(f_{1},f_{2},f_{3})$
in colour scale, plotted for
 $f_{2}=21~\text{Hz}$
, for the highest forcing amplitude
 $\unicode[STIX]{x1D70E}_{h}=3.6~\text{mm}$
and
 $\unicode[STIX]{x1D70E}_{s}=0.34$
. A significant correlation level is observed along the line
 $f_{3}=f_{1}+f_{2}$
(dashed line), revealing the presence of three-wave interactions. (b) Bicoherency level
 $B(f_{1},f_{2},f_{3}=f_{1}+f_{2})$
for the same measurement. A strong level of three-wave correlation implies the forcing waves and their harmonics. White curve displays the location of exactly resonant 1-D three-wave interactions. The black solid bounds non-resonant interactions with a mismatch
 $\unicode[STIX]{x0394}k=50~\text{m}^{-1}$
. Dashed line
 $\unicode[STIX]{x0394}k=100~\text{m}^{-1}$
. Dotted line
 $\unicode[STIX]{x0394}k=300~\text{m}^{-1}$
.

In a classic statistical description of a turbulent wave field, the spectra are built by coexistence of numerous and simultaneous three-wave resonant interactions, which on average transfer energy flux from the forcing scale to the dissipative scale. It is assumed that, after averaging on a long time, only the waves verifying the resonant conditions (1.2) and (1.3) can exchange substantial energy (Janssen Reference Janssen2004). To detect the occurrence of three-wave interactions in the temporal domain, we track phase correlations in the Fourier space between the waves forming a triad, through the computation of the bispectrum
 $B(f_{1},f_{2},f_{3})$
(Dudok de Wit Reference Dudok de Wit2003; Punzmann, Shats & Xia Reference Punzmann, Shats and Xia2009; Aubourg & Mordant Reference Aubourg and Mordant2015, Reference Aubourg and Mordant2016), which is defined by:
 $$\begin{eqnarray}B(f_{1},f_{2},f_{3})={\displaystyle \frac{|\langle \tilde{\unicode[STIX]{x1D702}}(\unicode[STIX]{x1D714}_{1})\tilde{\unicode[STIX]{x1D702}}(\unicode[STIX]{x1D714}_{2})\tilde{\unicode[STIX]{x1D702}}^{\ast }(\unicode[STIX]{x1D714}_{3})\rangle |}{\langle |\tilde{\unicode[STIX]{x1D702}}(\unicode[STIX]{x1D714}_{1})|\rangle \langle |\tilde{\unicode[STIX]{x1D702}}(\unicode[STIX]{x1D714}_{2})|\rangle \langle |\tilde{\unicode[STIX]{x1D702}}(\unicode[STIX]{x1D714}_{3})|\rangle }}.\end{eqnarray}$$
In figure 10(a), for a given value
 $f_{2}=21~\text{Hz}$
and the highest wave amplitude (i.e. the highest forcing), the occurrence of three-wave interactions appears as values of
 $B(f_{1},f_{2}=21~\text{Hz},f_{3})$
of order one, along the line
 $f_{3}=f_{1}+f_{2}$
, i.e. the frequency resonant condition. The same behaviour is also observed for other values of
 $f_{2}$
and lower forcing amplitudes. Then, to compare the respective weight of the different triads, the bicoherency
 $B(f_{1},f_{2},f_{3}=f_{1}+f_{2})$
(Aubourg & Mordant Reference Aubourg and Mordant2015, Reference Aubourg and Mordant2016) is depicted in figure 10(b) by assuming the frequency resonant condition for the same measurement. In the top-right corner, correlation is set to zero for points where
 $f_{1}+f_{2}>100~\text{Hz}$
, as the acquisition frequency is 200 Hz. Knowing that the forcing is performed in the frequency range between 4 and 6 Hz, the bicoherency graph displays a periodicity linked with this range and the harmonic values. Due to the relatively high amplitude of the waves produced in the forcing range by the wavemaker, the triads involving these waves are privileged. The pattern presents some resemblance to the one obtained at high steepness for waves near the gravity–capillary crossover, as in Aubourg & Mordant (Reference Aubourg and Mordant2016). The analysis of the directional properties of the wave field in figure 7 shows that the main part of wave energy is due to waves propagating along the
 $x$
-axis. Following the approach of Aubourg & Mordant (Reference Aubourg and Mordant2015, Reference Aubourg and Mordant2016), we investigate the role of three-wave interactions when
 $\boldsymbol{k}_{\mathbf{1}}$
,
 $\boldsymbol{k}_{\mathbf{2}}$
and
 $\boldsymbol{k}_{\mathbf{3}}$
are parallel to
 $O_{x}$
. First, 1-D exactly resonant interactions are considered. The corresponding curve is depicted in white in the bicoherency map in figure 10(b), and appears to correspond to some local maxima of correlation. Then, a mismatch
 $\unicode[STIX]{x1D6E5}_{k}$
to the spatial resonant condition (1.2) is enabled. The value of
 $\unicode[STIX]{x1D6E5}_{k}$
is estimated equal to the width of the dispersion relation due to nonlinear broadening. In § 3.2, the experimental width
 $W$
of the dispersion relation was found to reach typically
 $0.04~\text{mm}^{-1}$
at
 $f=30~\text{Hz}$
, which gives
 $\unicode[STIX]{x0394}k\approx 280~\text{m}^{-1}$
. The domains of allowed non-resonant interactions are delimited and plotted with black curves for
 $\unicode[STIX]{x0394}k=50$
, 100 and
 $300~\text{m}^{-1}$
. For the largest mismatch, nearly all the couples
 $(f_{1},f_{2})$
can be populated with 1-D three-wave interactions (i.e. couples located below the dotted curve). Therefore, the large width of the dispersion relation shows that, at high nonlinearity, three-wave interactions far from the resonance are possible. The distinction between quasi-resonant and non-resonant interaction here becomes arbitrary, as both are transferring energy. A non-resonant or quasi-resonant interaction with a mismatch
 $\unicode[STIX]{x1D6E5}_{k}$
produces an energy transfer oscillating in space on a length equal to
 $(2\unicode[STIX]{x03C0})/\unicode[STIX]{x1D6E5}_{k}$
. The wave packets have a typical length
 $1/W$
(autocorrelation length) fixed by the width of the dispersion relation. If
 $1/W<\unicode[STIX]{x1D6E5}_{k}$
, non-resonant interactions could lead thus to a net energy transfer. This hypothesis is similar to the results of Watson & Buchsbaum (Reference Watson and Buchsbaum1996) describing a wave field as interacting spatial modes. One-dimensional non-resonant three-wave interactions reproduce qualitatively parasitic capillary wave generation, with a typical mismatch of
 $400~\text{s}^{-1}$
from the temporal resonant conditions
 $|\unicode[STIX]{x1D714}_{1}\pm \unicode[STIX]{x1D714}_{2}-\unicode[STIX]{x1D714}_{3}|=0$
.
3.5 Wave correlations in spatial Fourier space
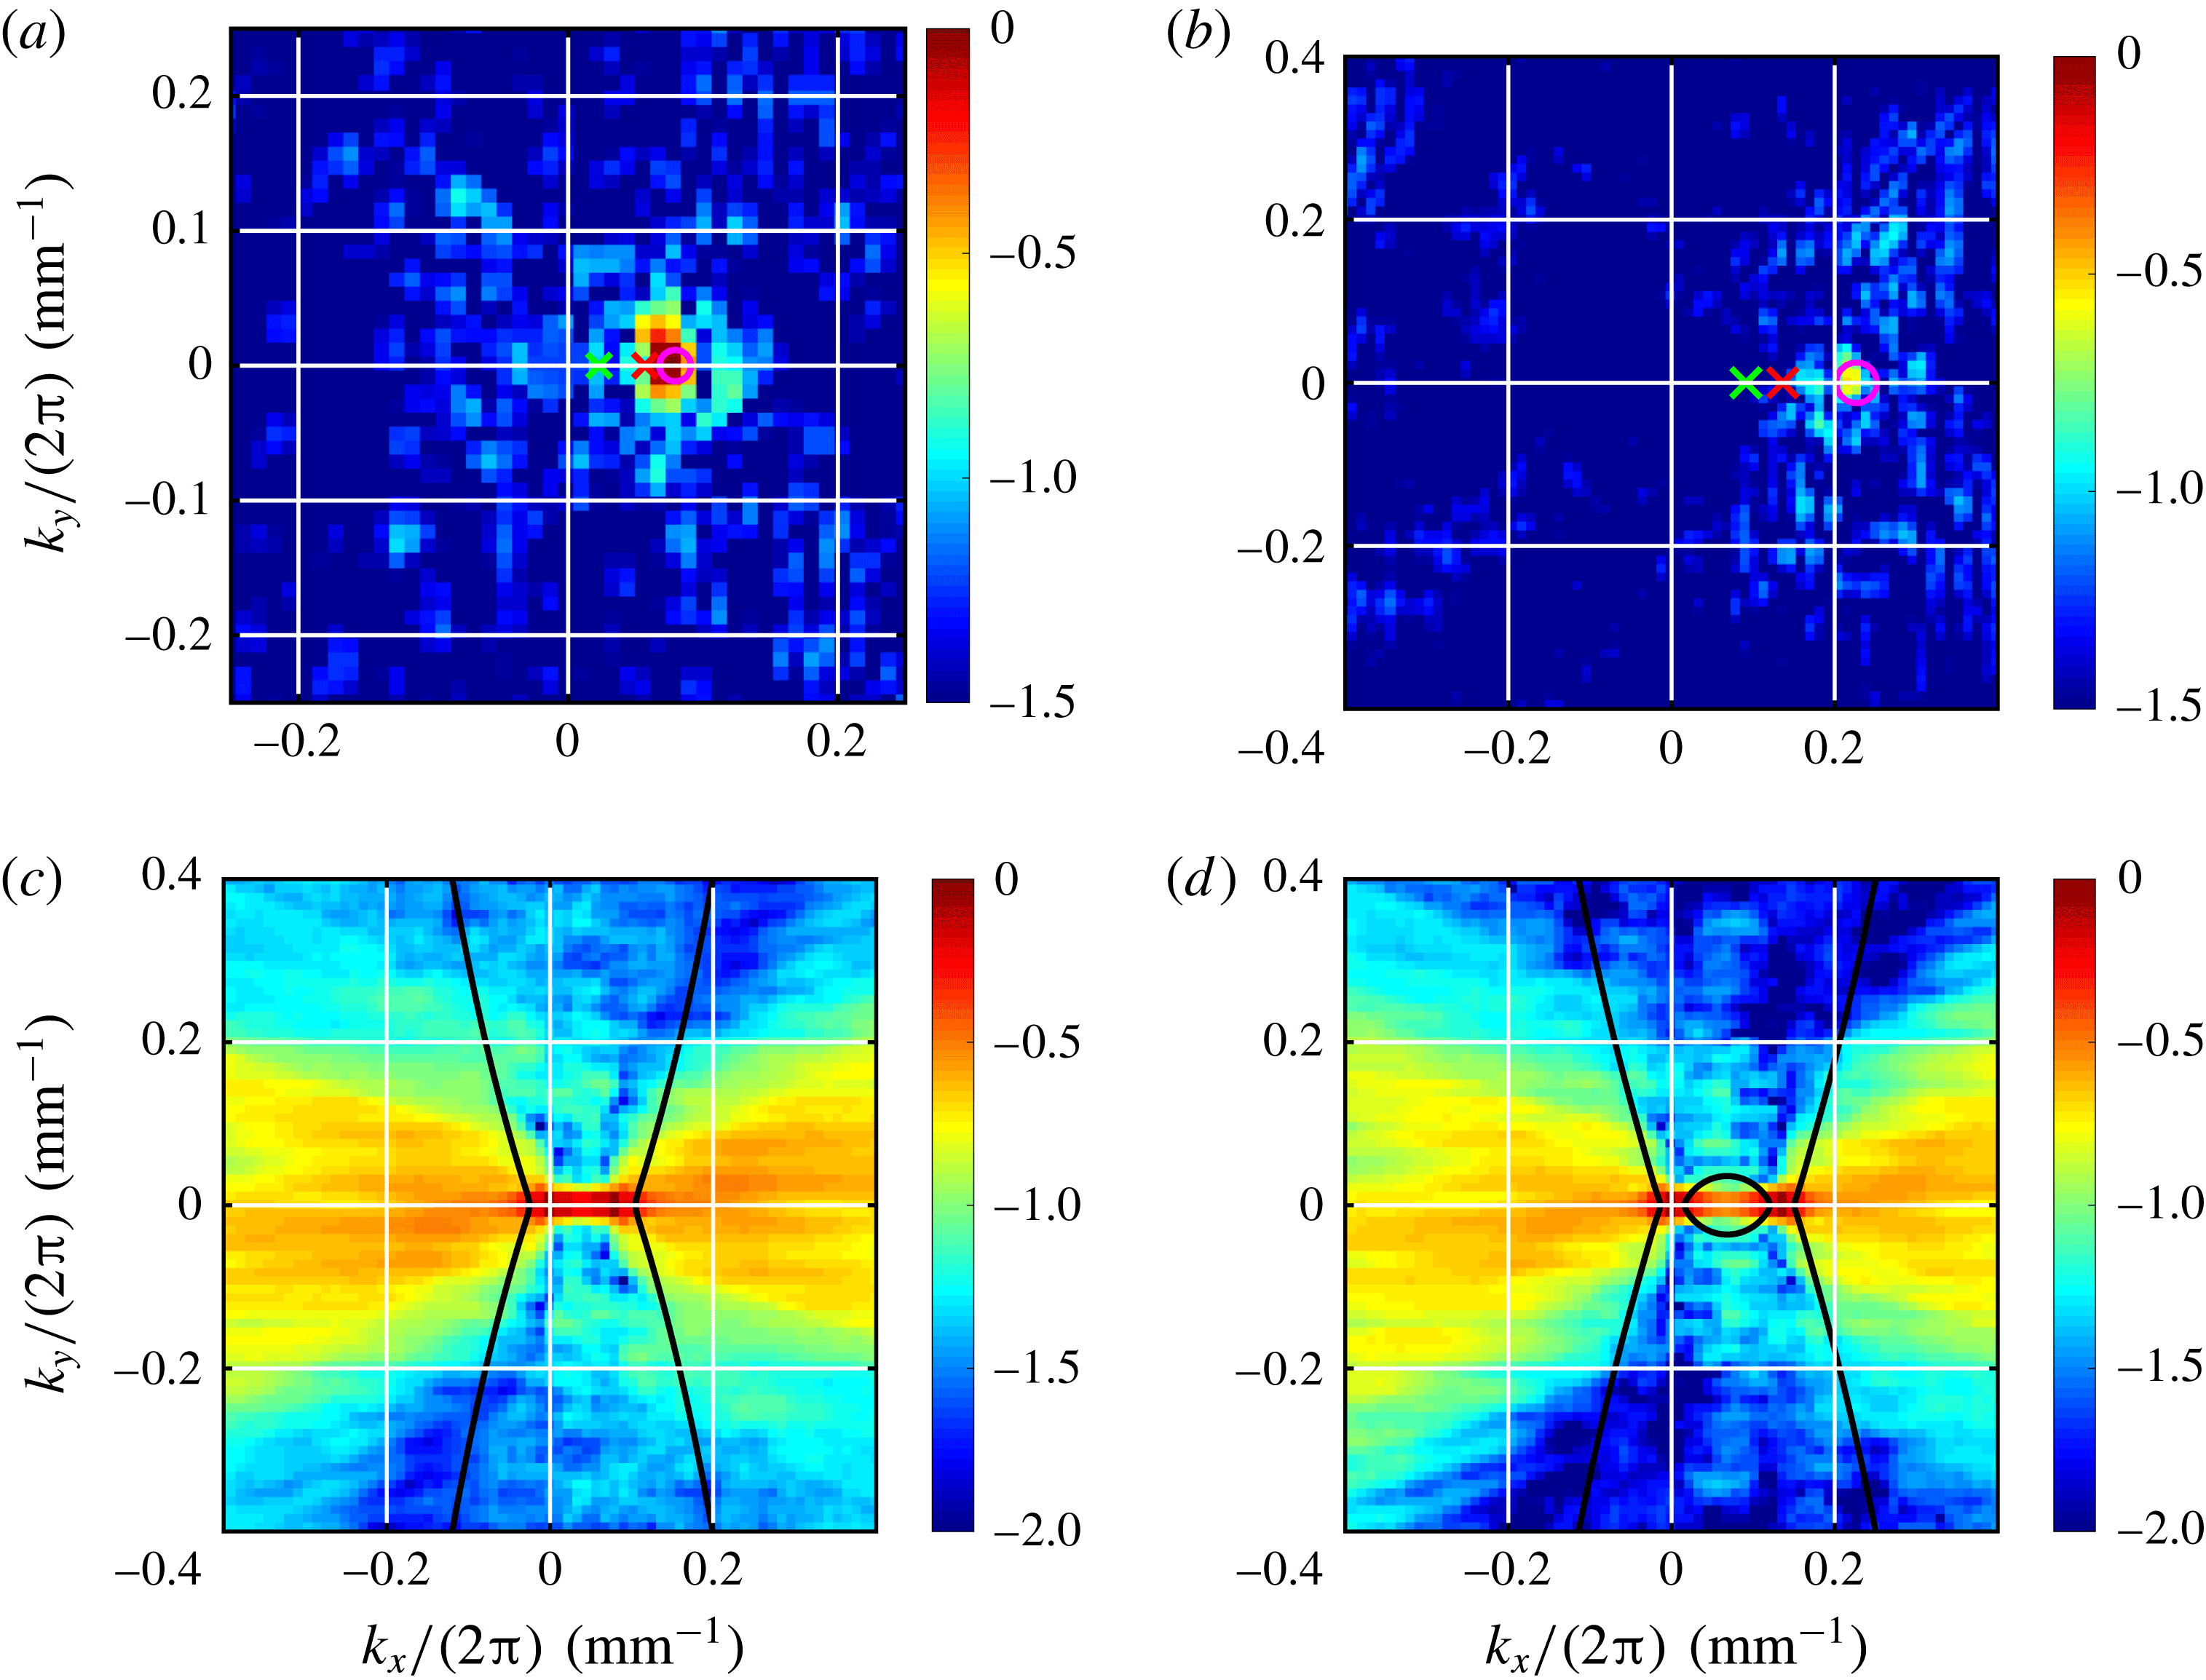
(a) Bispectrum
 $B_{s}(\boldsymbol{k}_{1},\boldsymbol{k}_{2},\boldsymbol{k}_{3})$
plotted on a
 $\log _{10}$
colour scale as a function of
 $\boldsymbol{k}_{1}$
with
 $\boldsymbol{k}_{2}/(2\unicode[STIX]{x03C0})=(0.0569,0)~\text{mm}^{-1}$
(red
 $\times$
) and
 $\boldsymbol{k}_{3}/(2\unicode[STIX]{x03C0})=(0.0228,0)~\text{mm}^{-1}$
(green
 $\times$
). A stronger peak of correlation is observed around
 $\boldsymbol{k}_{1}/(2\unicode[STIX]{x03C0})=\boldsymbol{k}_{2}/(2\unicode[STIX]{x03C0})+\boldsymbol{k}_{3}/(2\unicode[STIX]{x03C0})=(0.0797,0)~\text{mm}^{-1}$
(pink ○). The corresponding frequencies are 12.58, 6.32 and 17.74 Hz; thus this three-wave interaction is reasonably close to the resonance (
 $12.58+6.32=18.9\approx 17.74~\text{Hz}$
). (b) Bispectrum
 $B_{s}(\boldsymbol{k}_{1},\boldsymbol{k}_{2},\boldsymbol{k}_{3})$
as a function of
 $\boldsymbol{k}_{1}$
with
 $\boldsymbol{k}_{2}/(2\unicode[STIX]{x03C0})=(0.1365,0)~\text{mm}^{-1}$
(red
 $\times$
) and
 $\boldsymbol{k}_{3}/(2\unicode[STIX]{x03C0})=(0.0910,0)~\text{mm}^{-1}$
(green
 $\times$
). A peak of correlation is observed around
 $\boldsymbol{k}_{3}/(2\unicode[STIX]{x03C0})=(0.2275,0)~\text{mm}^{-1}$
(pink ○). The corresponding frequencies are 34.25, 20.65 and 69.28 Hz; thus this three-wave interaction is non-resonant (
 $34.25+20.65=54.9\neq 69.28~\text{Hz}$
). (c) Bicoherence
 $B(\boldsymbol{k}_{1},\boldsymbol{k},\boldsymbol{k}_{1}-\boldsymbol{k})$
plotted on a
 $\log _{10}$
colour scale as a function of
 $\boldsymbol{k}$
with
 $\boldsymbol{k}_{1}/(2\unicode[STIX]{x03C0})=(0.0797,0)~\text{mm}^{-1}$
. The black curves are the loci of exact resonances according the linear dispersion relation. Non-resonant three-wave interactions are thus significant and mainly directed along the
 $x$
axis. (d) Bicoherence
 $B(\boldsymbol{k}_{1},\boldsymbol{k},\boldsymbol{k}_{1}-\boldsymbol{k})$
as a function of
 $\boldsymbol{k}$
with
 $\boldsymbol{k}_{1}/(2\unicode[STIX]{x03C0})=(0.2275,0)~\text{mm}^{-1}$
. The black curves are the loci of exact resonances according the linear dispersion relation. For a larger wavenumber
 $\boldsymbol{k}_{1}$
, three-wave interactions are also found to be mainly non-resonant and directed along the
 $x$
axis.

To complete our study of three-wave interactions, we perform a study of phase correlations at the third order in the spatial Fourier space. We compute first the space bispectrum to test the occurrence of three-wave interactions, then we use the spatial bicoherence to test the resonant or non-resonant character given the linear dispersion relation, as performed by Aubourg & Mordant (Reference Aubourg and Mordant2016) and by Pan & Yue (Reference Pan and Yue2017). To facilitate the comparison, we adopt their convention: wave 1 would be created by the interaction between waves 2 and 3. The bispectrum is written thus:
 $$\begin{eqnarray}B_{s}(\boldsymbol{k}_{1},\boldsymbol{k}_{2},\boldsymbol{k})={\displaystyle \frac{|\langle \tilde{\unicode[STIX]{x1D702}}(\boldsymbol{k}_{2})\tilde{\unicode[STIX]{x1D702}}(\boldsymbol{k}_{3})\tilde{\unicode[STIX]{x1D702}}^{\ast }(\boldsymbol{k}_{\mathbf{1}})\rangle |}{\langle |\tilde{\unicode[STIX]{x1D702}}(\boldsymbol{k}_{1})|\rangle \langle |\tilde{\unicode[STIX]{x1D702}}(\boldsymbol{k}_{2})|\rangle \langle |\tilde{\unicode[STIX]{x1D702}}(\boldsymbol{k}_{\mathbf{3}})|\rangle }}.\end{eqnarray}$$
Two examples are given in figure 11(a,b) for the highest-amplitude measurement by choosing the two vectors
 $\boldsymbol{k}_{2}$
and
 $\boldsymbol{k}_{3}$
. If the spatial resonant condition is verified, equation (1.2), a local maximum of correlation should be observed near
 $\boldsymbol{k}_{1}\approx \boldsymbol{k}_{2}+\boldsymbol{k}_{3}$
. The lack of resolution at small wavenumbers due to the finite size of the images limits the accuracy of the test. However, a repetition of identical experiments could improve the convergence level. Nevertheless, a clear correlation peak is observed at the sum wavenumber, showing a significant occurrence of three-wave interactions. By computing the corresponding frequencies, given the linear dispersion relation (1.1), we can also test the temporal resonant condition (1.2). In the first case (figure 11
a), the sum frequency is reasonably close to
 $f_{1}$
, and the interaction is quasi-resonant. But in the second case (figure 11
b), the sum frequency differs notably from
 $f_{1}$
, implying that the non-resonant interactions also contribute to the wave-field dynamics. To generalize this statement, knowing that the level of three-wave interaction is significant, we compute the bicoherence map defined by:
 $$\begin{eqnarray}B(\boldsymbol{k}_{1},\boldsymbol{k},\boldsymbol{k}_{1}-\boldsymbol{k})={\displaystyle \frac{|\langle \tilde{\unicode[STIX]{x1D702}}^{\ast }(\boldsymbol{k}_{1})\tilde{\unicode[STIX]{x1D702}}(\boldsymbol{k})\tilde{\unicode[STIX]{x1D702}}(\boldsymbol{k}_{1}-\boldsymbol{k})\rangle |}{\langle |\tilde{\unicode[STIX]{x1D702}}(\boldsymbol{k}_{1})|\rangle \langle |\tilde{\unicode[STIX]{x1D702}}(\boldsymbol{k})|\rangle \langle |\tilde{\unicode[STIX]{x1D702}}(\boldsymbol{k}_{1}-\boldsymbol{k})|\rangle }}.\end{eqnarray}$$
For a given
 $\boldsymbol{k}_{1}$
, the condition
 $\boldsymbol{k}_{1}=\boldsymbol{k}_{2}+\boldsymbol{k}_{3}$
is automatically satisfied by taking
 $\boldsymbol{k}_{2}=\boldsymbol{k}$
and
 $\boldsymbol{k}_{3}=\boldsymbol{k}_{1}-\boldsymbol{k}$
. Expressed as a function of
 $\boldsymbol{k}$
, this statistical tool indicates the position of wavenumbers which are participating more in the wave-field dynamics. The temporal resonance condition can also be tested under the form (
 $\unicode[STIX]{x1D714}_{1}=\unicode[STIX]{x1D714}(\boldsymbol{k})+\unicode[STIX]{x1D714}(\boldsymbol{k}_{1}-\boldsymbol{k})$
) using the linear dispersion relation. Two cases are displayed in figure 11(c,d). The loci of exact temporal resonances are given by the black curves. We observe that the three-wave interactions in our systems are mainly 1-D, directed along the forcing axis (
 $O_{x}$
) and non-resonant. A significant level of correlation is indeed observed far from the black curves. The typical width of the dispersion relation
 $\unicode[STIX]{x0394}k/(2\unicode[STIX]{x03C0})\approx 0.05~\text{mm}^{-1}$
is not sufficient to assume these interactions as quasi-resonant. The results are very similar for measurements at lower amplitude. We also note that the lack of resolution in the
 $k$
space limits the accuracy of the method compared to the temporal bicoherence analysis, which is better resolved. Assuming the linear dispersion relation, the non-resonant character of three-wave interactions is thus clearly demonstrated. The physical situation differs strongly from the work of Pan & Yue (Reference Pan and Yue2017) simulating pure capillary waves, where the bicoherence level is significant only close to the exact resonance. In our experiments, as a deviation from the linear dispersion is reported in § 3.2, a bispectral analysis simultaneously testing both resonant conditions (1.2) and (1.3) by computing a space–time bicoherence (Aubourg et al.
Reference Aubourg, Campagne, Peureux, Ardhuin, Sommeria, Viboud and Mordant2017) would also be useful to evaluate the role of non-resonant interactions and to detect a possible role of harmonics. However, a converged computation of space–time bicoherence requires a large data set, and a such study would deserve a systematic investigation.
4 Fluctuations of capillary wave turbulence
4.1 Temporal evolution of spatial spectrum
In the previous section, we have characterized statistically stationary out-of-equilibrium turbulent states of interacting waves. To better isolate the mechanisms at play, we now investigate the temporal behaviour of the wave field, by computing at each time the spatial power spectrum of the wave elevation
 $S_{\unicode[STIX]{x1D702}}(k,t)$
(averaged over the directions). As previously discussed for the wave potential energy in Berhanu & Falcon (Reference Berhanu and Falcon2013), we observe in figure 12(a) that
 $S_{\unicode[STIX]{x1D702}}(k,t)$
displays stochastic bursts transferring energy towards small spatial scales, as a consequence of the random forcing. For the displayed measurement, 196 bursts can be counted in a duration of 41 s, which is coherent with a typical forcing frequency of 5 Hz. Indeed, most of the time, the wave energy is confined near the forcing scales, but, from time to time, wave energy is quickly transferred through all spatial scales. The autocorrelation time of
 $S_{\unicode[STIX]{x1D702}}(k,t)$
is found for
 $k$
inside of the capillary range, of the order of 0.05 s and the corresponding rise time is estimated to be about 0.02 s by computing the cross-correlation of
 $S_{\unicode[STIX]{x1D702}}(k,t)$
for
 $k$
within the forcing scale and
 $k$
in the capillary range. Such a short time shows that the typical nonlinear time characterizing wave interactions has to be smaller than the wave period for frequencies below 50 Hz. The hypothesis of weak nonlinearity is thus experimentally violated, as was shown by the analysis of the width of the dispersion relation in § 3.2. Moreover, we show three instantaneous spatial spectra
 $S_{\unicode[STIX]{x1D702}}(k,t^{\ast })$
as a function of
 $\unicode[STIX]{x1D706}^{-1}$
in figure 12(b), for some typical values of
 $t^{\ast }$
. These spectra are compared with the spectrum obtained after averaging over the duration of the measurement. This latter spectrum is identical to the one obtained in figure 8(a) and is compatible with the power law
 $k^{-15/4}$
in the capillary range. When
 $t^{\ast }$
corresponds to a burst of energy, the spectrum is significantly higher in amplitude than the average spectrum, whereas it is slightly smaller in amplitude outside the bursts. The strong events seem to transfer energy directly from the forcing to the capillary scales, then the slower relaxation between bursts appears to be closer to the weak wave turbulent regime hypotheses. Similar observations have been reported for surface gravity wave turbulence (Bedard, Lukaschuk & Nazarenko Reference Bedard, Lukaschuk and Nazarenko2013). Fluctuations of the filtered spectral amplitude appear as a succession of random bursts, interpreted as wave breaking events, for which the instantaneous spatial spectrum is higher.
(a) Temporal evolution of the spatial spectrum
 $S_{\unicode[STIX]{x1D702}}(k,t)$
in the (
 $t$
,
 $\unicode[STIX]{x1D706}^{-1}$
) space for the highest wave amplitude measurement,
 $\unicode[STIX]{x1D70E}_{h}=3.6~\text{mm}$
. Colour scale in a
 $\log _{10}$
scale. Several bursts of energy are observed and affect a broad range of scales. Black dashed vertical lines mark the specific times
 $t^{\ast }$
used in (b). (b) Instantaneous spatial spectra
 $S_{\unicode[STIX]{x1D702}}(k,t^{\ast })$
for
 $t^{\ast }=16.85$
, 16.94 and 17.20 s as dotted lines for the same measurement. Continuous thick red line: spatial spectrum averaged over the duration of the measurement 41.0 s. Black line indicates the power law
 $k^{-15/4}$
. The instantaneous spectrum has a higher amplitude than the average spectrum during an energy burst and has a lower amplitude between the bursts.

(a) Probability density function (PDF) of wave energy
 $E(k_{\star },t)/\langle E(k_{\star },t)\rangle$
for
 $\unicode[STIX]{x1D706}_{\star }^{-1}=0.094~\text{mm}^{-1}$
: (*) moderate forcing (
 $\unicode[STIX]{x1D70E}_{h}=2.0~\text{mm}$
,
 $\unicode[STIX]{x1D70E}_{s}=0.19$
) and (○) high forcing (
 $\unicode[STIX]{x1D70E}_{h}=3.6~\text{mm}$
,
 $\unicode[STIX]{x1D70E}_{s}=0.34$
). Dashed line is the exponential distribution:
 $\exp (-E_{k}/\langle E_{k}\rangle )$
. (b) Deviation of the previous PDF from the exponential distribution, evaluated by computing the fourth-order moment
 $M_{4}=\langle E_{k}^{4}\rangle$
minus 6, the exact result for the exponential distribution, as a function of the wave amplitude
 $\unicode[STIX]{x1D70E}_{h}$
.

In order to quantify the intermittency of energy fluctuations
 $E_{k}(t)$
, the probability distribution function is plotted in figure 13(a) for a typical capillary wave mode,
 $\unicode[STIX]{x1D706}_{\star }^{-1}=0.094~\text{mm}^{-1}$
. The energy spectrum per density unit is first obtained from
 $S_{\unicode[STIX]{x1D702}}(k)$
, assuming that the wave energy is on average two times the potential energy and neglecting higher-order terms in the surface extension:
 $$\begin{eqnarray}\int E_{k}(k,t)\,\text{d}k=\frac{2}{\unicode[STIX]{x1D70C}}\int \left[\frac{1}{2}\unicode[STIX]{x1D70C}gS_{\unicode[STIX]{x1D702}}(k)+\frac{1}{2}\unicode[STIX]{x1D6FE}k^{2}S_{\unicode[STIX]{x1D702}}(k)\right]\,\text{d}k.\end{eqnarray}$$
In random regimes of capillary waves, a Gaussian distribution of wave amplitudes corresponds to a decreasing exponential distribution of
 $E_{k}(t)$
,
 $\exp (-E_{k}/\langle E_{k}\rangle )$
. At low forcing amplitude, the PDF of
 $E_{k}(t)$
follows the exponential distribution, whereas at high forcing amplitude the PDF departs from the exponential distribution with an increased probability of strong events. This deviation from the Gaussian statistics observation defines the intermittency in the dynamics of random waves (Choi et al.
Reference Choi, L’vov, Nazarenko and Pokorni2005). It is attributed to the presence of large-scale coherent structures caused by strongly nonlinear events (Nazarenko et al.
Reference Nazarenko, Lukaschuk, McLelland and Denissenko2010). To quantify the intermittent behaviour, we compute the fourth-order moment
 $M_{4}=\langle E_{k}^{4}\rangle$
, a higher moment being more sensitive to the contribution of extreme events. For an exponential distribution,
 $M_{4}$
is exactly equal to 6. The difference
 $M_{4}-6$
is plotted in figure 13(b) as a function of wave amplitude
 $\unicode[STIX]{x1D70E}_{h}$
. The departure from the exponential distribution increases with amplitude and saturates for the last three measurements. This criterion shows that capillary wave energy has an intermittent dynamics, due to the occurrence of strong bursts transferring energy from large scales to small scales by a fast mechanism. This fast and non-local process likely corresponds to the generation of parasitic capillary waves, as shown in the next subsection.
4.2 Evidence of parasitic capillary wave generation
In the physical space, we interpret the occurrence of strong bursting events of wave energy as the generation of parasitic capillary waves. In order to reinforce this observation, a quantitative criterion on the wave-field analysis is needed. As the theoretical works are only performed for propagating and non-decaying monochromatic gravity waves, it appears difficult to make a direct comparison with our experimental results. Nevertheless, an approximate criterion of resonance is given by the equality of the phase velocity of the gravity wave and the phase velocity of the produced parasitic capillary wave. Knowing that waves are forced in the frequency range
 $(4,6)~\text{Hz}$
, a corresponding range of parasitic wave generation can be found from the expression of the phase velocity of the gravity–capillary wave
 $v_{\unicode[STIX]{x1D719}}=\unicode[STIX]{x1D714}/k$
, using the linear dispersion relation (1.1), as schematized in figure 14(a). Expressed as the inverse of the wavelength, the forcing range reads
 $\unicode[STIX]{x1D706}^{-1}\in (10.4,20.9)~\text{m}^{-1}$
and the parasitic capillary wave generation range is found to be
 $\unicode[STIX]{x1D706}^{-1}\in (198,382)~\text{m}^{-1}$
. In their analysis of experimental parasitic wave generation, Fedorov et al. (Reference Fedorov, Melville and Rozenberg1998) claim that the interval of parasitic wave generation is extended due to nonlinear effects. Taking into account the nonlinear correction of the phase velocity of the gravity waves treated as a Stokes wave, the latter range would be multiplied by
 $(1+\unicode[STIX]{x1D70E}_{s}^{2})$
, which leads to
 $\unicode[STIX]{x1D706}^{-1}\in (221,426)~\text{m}^{-1}$
as a range of maximal excitation of capillary waves. The Doppler shift due to the orbital current induced by the large gravity wave on the capillary wave may be also taken into account. In the laboratory frame of reference, the total range of observation of parasitic capillary waves is obtained after multiplication by a factor
 $(1\pm 2\unicode[STIX]{x1D70E}_{s})$
(Fedorov et al.
Reference Fedorov, Melville and Rozenberg1998), giving
 $\unicode[STIX]{x1D706}^{-1}\in (70.8,716)~\text{m}^{-1}$
. These scales appear clearly excited for strong bursts of the spatial spectrum displayed in figure 12(a). As the instantaneous steepness can be higher than
 $\unicode[STIX]{x1D70E}_{s}$
, a clear cutoff at a maximal wavenumber is not visible with a random excitation. Moreover, a depletion of the spectrum in the intermediate range between
 $\unicode[STIX]{x1D706}^{-1}=20.9~\text{m}^{-1}$
and
 $\unicode[STIX]{x1D706}^{-1}=70.8~\text{m}^{-1}$
is not observed. To make the comparison with the work of Fedorov et al. (Reference Fedorov, Melville and Rozenberg1998), we plot in figure 14(b) the 1-D spatial spectra
 $S_{\unicode[STIX]{x1D702}}(k_{x},k_{y}=0)$
along the
 $x$
direction corresponding to the main direction of propagation of the gravity wave displayed in figure 2, at the instant of parasitic wave generation (
 $t=1.510~\text{s}$
) and after it. The interval
 $(198,382)~\text{m}^{-1}$
of parasitic wave generation from the criterion of equality of phase velocities is plotted by thick vertical dashed lines. Capillary waves are indeed excited in the parasitic capillary wave range at
 $t=1.510~\text{s}$
. Due to the finite size of the observation window, the exact wavelength of the forcing is not resolved in the spectrum. Then at
 $t=1.595~\text{s}$
the spectrum has a lower amplitude in the capillary wave range, but with a similar amplitude in the forcing range and for
 $\unicode[STIX]{x1D706}^{-1}>\unicode[STIX]{x1D706}_{d}^{-1}$
, i.e. the dissipative zone.
(a) Schematic illustration of the condition of capillary wave generation by the parasitic capillary wave mechanism. Blue (dark grey) and red (light grey), respectively the phase and group velocity of gravity–capillary waves as a function of
 $\unicode[STIX]{x1D706}^{-1}$
. The waves in the forcing range excite capillary waves having the same phase velocity. (b) Spatial 1-D spectrum
 $S_{\unicode[STIX]{x1D702}}(k_{x},k_{y}=0)$
as a function of
 $\unicode[STIX]{x1D706}_{x}^{-1}$
and multiplied by
 $\unicode[STIX]{x1D706}_{x}^{-1}$
to facilitate the comparison with
 $S_{\unicode[STIX]{x1D702}}(k)$
for two time values and
 $\unicode[STIX]{x1D70E}_{h}=3.6~\text{mm}$
. At
 $t=1.510~\text{s}$
, corresponding to the image in figure 2, where a parasitic capillary wave appears, the spectrum is populated in the range given by the condition on the phase velocity. At
 $t=1.595~\text{s}$
, the spectrum is lower in the capillary wave range.

In order to generalize this statement for more capillary wave generation events, a video animation has been made and can be found in the supplementary materials (movie 2). For a duration of 2.5 s, the wave-field gradient
 $\Vert \unicode[STIX]{x1D735}h(x,y)\Vert$
and the instantaneous spatial spectrum (1-D
 $k_{x}S_{\unicode[STIX]{x1D702}}(k_{x},k_{y}=0)$
in blue and directionally integrated
 $S_{\unicode[STIX]{x1D702}}(k)$
in green) are displayed in the same figure, showing their time evolution. At specific times, capillary wave trains are clearly visible on the crests of long steep gravity waves. Simultaneously in the spectrum, the range of parasitic wave generation experiences a sudden increase. The largest events correspond to frontal collisions of two counter-propagating gravity waves. This last parasitic capillary generation mechanism has been described experimentally for steep standing waves (Schultz et al.
Reference Schultz, Den-Broeck, Jiang and Perlin1998), but has not been the object of a theoretical study. It appears that the bursts of intermediate amplitude are more prone to follow the classical scenario of formation of parasitic capillary waves. Nevertheless, the parasitic wave generation mechanism appears to be a process relevant for the frequency range and steepness of forcing waves in our experiment. This mechanism transfers, by a strongly nonlinear interaction, wave energy from the large scale to the small scale. However, the available theoretical work does not seem applicable directly to a random field of waves in a closed tank. Moreover, after averaging over a sufficient duration, the spatial spectrum can be described as a power law in the capillary wave range. The periods between the bursts with parasitic wave generation have a significantly lower wave amplitude and steepness. A relaxation process on a longer time scale seems to populate the spectrum continuously with direct and inverse transfer, to approach the wave turbulent spectrum on average. This description is similar to the turbulent cycle of gravity wave turbulence (Nazarenko et al.
Reference Nazarenko, Lukaschuk, McLelland and Denissenko2010), where strongly nonlinear coherent structures distributing energy on a large range of scales coexist with a randomly distributed background of waves, producing on average the self-similar spectra. Thus, in this section, we have shown experimentally that the capillary spectrum is built by short time events corresponding to parasitic capillary wave train generation and corresponds to the wave turbulence spectrum. Between the bursts, the capillary spectrum is below the wave turbulent spectrum. This latter spectrum is only found after temporal averaging over a duration incorporating parasitic events and wave relaxation between the bursts. Therefore, experimentally, the power-law spectrum of capillary waves is primarily formed by parasitic capillary waves and not by local interactions of capillary waves.
5 Comparison of experimental results with the wave turbulence theory
5.1 Context
For strong enough forcing, spectra of the wave elevation have been found in § 3 to follow a power law whose exponents are in agreement with those given by the wave turbulence theory. However, these spectra appear to be built on average by a random succession of strong nonlinear events, for which parasitic capillary trains are emitted. This statement differs from the classic picture of wave turbulence, where randomly distributed weakly nonlinear three-wave interactions construct the spectra. We now propose a more thorough comparison of our experimental results with the predictions of the wave turbulence theory (Zakharov et al. Reference Zakharov, L’vov and Falkovich1992; Nazarenko Reference Nazarenko2011; Newell & Rumpf Reference Newell and Rumpf2011), which provides a statistical description of weakly nonlinear dispersive waves. We briefly provide the theoretical results, justifying the later analysis of our experimental data.
In a statistically stationary regime, power-law spectra are predicted in wave turbulence theory. They correspond to a transfer of a conserved energy flux
 $\unicode[STIX]{x1D716}$
from an injection scale to a dissipative smaller scale. For pure capillary waves, by computing the contribution of resonant three-wave interactions, wave turbulence theory predicts the wave action spectrum
 $n_{\boldsymbol{k}}$
(Zakharov & Filonenko Reference Zakharov and Filonenko1967b
; Pushkarev & Zakharov Reference Pushkarev and Zakharov2000).
 $n_{\boldsymbol{k}}$
expresses qualitatively the number of quasi-particles populating the scale defined by the wave vector
 $\boldsymbol{k}$
.
 $$\begin{eqnarray}n_{\boldsymbol{k}}=C_{KZ}(\unicode[STIX]{x1D6FE}/\unicode[STIX]{x1D70C})^{-1/4}\unicode[STIX]{x1D716}^{1/2}k^{-17/4}.\end{eqnarray}$$
Using the assumption of an isotropic system, the exact value of the dimensionless Kolmogorov–Zakharov constant
 $C_{KZ}$
can be found (Pushkarev & Zakharov Reference Pushkarev and Zakharov2000; Pan & Yue Reference Pan and Yue2017). To relate the wave action spectrum to the measured wave elevation spectrum, a few steps are needed. First, the wave action spectrum is integrated over the direction under the hypothesis of an isotropic system, which leads to:
 $n_{k}=2\unicode[STIX]{x03C0}C_{KZ}(\unicode[STIX]{x1D6FE}/\unicode[STIX]{x1D70C})^{-1/4}\unicode[STIX]{x1D716}^{1/2}k^{-13/4}$
. The wave energy spectrum per density unit is defined by
 $E_{k}=\unicode[STIX]{x1D714}(k)n_{k}$
, where
 $\unicode[STIX]{x1D714}(k)$
is given by the linear dispersion relation of pure capillary waves
 $\unicode[STIX]{x1D714}^{2}=(\unicode[STIX]{x1D6FE}/\unicode[STIX]{x1D70C})k^{3}$
. Averaging over several periods, the wave energy is written as
 $\langle E\rangle =\langle E_{c}+E_{pot}\rangle =2\langle E_{pot}\rangle$
. For pure capillary waves in the weakly nonlinear limit,
 $E_{pot}=(1/2)(\unicode[STIX]{x1D6FE}/\unicode[STIX]{x1D70C})k^{2}S_{\unicode[STIX]{x1D702}}(k)$
. The spatial spectrum of the wave elevation can be thus computed from the wave action spectrum. The temporal spectrum is obtained from the spatial spectrum by using the dispersion relation for pure capillary waves and performing a variable change in the relation:
 $$\begin{eqnarray}\langle \unicode[STIX]{x1D702}^{2}\rangle =\int S_{\unicode[STIX]{x1D702}}(k)\,\text{d}k=\int S_{\unicode[STIX]{x1D702}}(\unicode[STIX]{x1D714})\,\text{d}\unicode[STIX]{x1D714}.\end{eqnarray}$$
Finally, we find:
 $$\begin{eqnarray}S_{\unicode[STIX]{x1D702}}(k)=2\unicode[STIX]{x03C0}C_{KZ}\unicode[STIX]{x1D716}^{1/2}(\unicode[STIX]{x1D6FE}/\unicode[STIX]{x1D70C})^{-3/4}k^{-15/4},\quad S_{\unicode[STIX]{x1D702}}(\unicode[STIX]{x1D714})=4\unicode[STIX]{x03C0}/3C_{KZ}\unicode[STIX]{x1D716}^{1/2}(\unicode[STIX]{x1D6FE}/\unicode[STIX]{x1D70C})^{1/6}\unicode[STIX]{x1D714}^{-17/6}.\end{eqnarray}$$
We note that the values of dimensionless pre-factors differ in a recent theoretical work (Pan Reference Pan2017).
The spectra (5.3) can also be deduced from dimensional analysis, knowing that the scaling on
 $\unicode[STIX]{x1D716}$
is set by the order of the resonant interaction (an
 $N$
-wave process implies an energy flux scaling under the form:
 $\unicode[STIX]{x1D716}^{1/(N-1)}$
) (Connaughton, Nazarenko & Newell Reference Connaughton, Nazarenko and Newell2003), but without the values of the dimensionless constants
 $C_{KZ}$
.
Simulations of the Zakharov Hamiltonian formulation of water waves have been first presented (Pushkarev & Zakharov Reference Pushkarev and Zakharov1996, Reference Pushkarev and Zakharov2000), and recent direct numerical simulations have confirmed the validity and accuracy of the predictions given by the wave turbulence theory (Deike et al. Reference Deike, Fuster, Berhanu and Falcon2014b ; Pan & Yue Reference Pan and Yue2014) for pure capillary waves and with a low dissipation level. By adding a weak level of broad-scale dissipation, a numerical study of the decay of pure capillary wave turbulence (Pan & Yue Reference Pan and Yue2015) displays an exponential decay of amplitude and a decrease of the slope of the capillary cascade. The role of nonlinear broadening has also been investigated (Pan & Yue Reference Pan and Yue2017) for numerical simulations performed in finite domains.
To approach the natural situation, a direct numerical simulation of turbulence of surface waves, when capillary waves are excited by gravity waves, is of interest. Recently, in a numerical study of air–water sheared flow, Zonta, Soldati & Onorato (Reference Zonta, Soldati and Onorato2015), Zonta, Onorato & Soldati (Reference Zonta, Onorato and Soldati2016) observed that the spatial spectrum of the surface deformation presents a power law whose exponent is compatible with the value given by wave turbulence theory for capillary waves. In contrast with the previous numerical studies, the complete dispersion relation of gravity–capillary waves is implemented, but due to the shear forcing, the resulting wave field is anisotropic. For the case with the strongest capillary effects, the conversion of gravity waves into capillary ripples is supposed to occur through the parasitic capillary wave mechanism (Zonta et al.
Reference Zonta, Onorato and Soldati2016). These latter numerical results present some similarities with our measurements. However, to determine quantitatively if wave turbulence theory is relevant in these situations, a measurement of energy flux
 $\unicode[STIX]{x1D716}$
is necessary.
5.2 Dissipation spectrum and estimation of energy flux
In order to estimate the energy flux, we follow the approach proposed by Deike et al. (Reference Deike, Berhanu and Falcon2014a
) in a previous study of capillary wave turbulence using a local capacitive probe, and compute the dissipation spectrum within the capillary wave spectrum. A similar approach has been performed in the context of elastic wave turbulence experimentally (Humbert et al.
Reference Humbert, Cadot, Düring, Josserand, Rica and Touzé2013) and numerically (Miquel, Alexakis & Mordant Reference Miquel, Alexakis and Mordant2014). First, on average over a large number of wave periods the kinetic energy
 $E_{c}$
is equal to the potential energy
 $E_{pot}$
. Assuming
 $\langle E\rangle =\langle E_{c}+E_{pot}\rangle =2\langle E_{pot}\rangle$
, the spectrum of energy per density unit
 $E_{k}(k)$
is written as:
 $$\begin{eqnarray}\int E_{k}(k)\,\text{d}k=\frac{2}{\unicode[STIX]{x1D70C}}\int \left[\frac{1}{2}\unicode[STIX]{x1D70C}gS_{\unicode[STIX]{x1D702}}(k)+\frac{1}{2}\unicode[STIX]{x1D6FE}k^{2}S_{\unicode[STIX]{x1D702}}(k)\right]\,\text{d}k.\end{eqnarray}$$
Here the analysis is carried out by using spatial spectrum
 $S_{\unicode[STIX]{x1D702}}(k)$
averaged over time, but to facilitate the comparison with previous works using local probes, the results are then expressed as a function of the frequency using the linear dispersion relation, as was shown in figure 8(b). The dissipation spectrum is obtained by computing the total dissipated power
 $D$
from the dissipation rate of energy
 $\unicode[STIX]{x1D6E4}$
at the frequency
 $f$
:
 $$\begin{eqnarray}D=\int D_{\unicode[STIX]{x1D702}}(f)\,\text{d}f=\int E_{f}(f)\unicode[STIX]{x1D6E4}(f)\,\text{d}f.\end{eqnarray}$$
For gravity–capillary waves at a frequency above 4 Hz, we assume that most of the dissipation can be described by the linear inextensible film model (Lamb Reference Lamb1932; van Dorn Reference van Dorn1966; Deike et al.
Reference Deike, Berhanu and Falcon2012; Henderson & Segur Reference Henderson and Segur2013). In the capillary range the experimental dissipation rate
 $\unicode[STIX]{x1D6FF}$
is indeed well described by this model (Deike et al.
Reference Deike, Berhanu and Falcon2012; Haudin et al.
Reference Haudin, Cazaubiel, Deike, Jamin, Falcon and Berhanu2016). The energy dissipation is written as
 $\unicode[STIX]{x1D6E4}(f)=\sqrt{2}\sqrt{\unicode[STIX]{x1D708}\unicode[STIX]{x1D714}}k(f)/2$
. It can be shown (Deike et al.
Reference Deike, Berhanu and Falcon2012, Reference Deike, Berhanu and Falcon2014a
) that the contributions of the tank walls and bottom are negligible in the total dissipation for gravity waves of frequency above 4 Hz, and even more for capillary waves. The dissipation spectrum is plotted in figure 15(a). As stated previously (Deike et al.
Reference Deike, Berhanu and Falcon2014a
), most of the dissipation occurs in the gravity wave range. Then the energy budget in the frequency space can be written as:
 $$\begin{eqnarray}\frac{\unicode[STIX]{x2202}E_{f}}{\unicode[STIX]{x2202}t}+\frac{\unicode[STIX]{x2202}\unicode[STIX]{x1D716}}{\unicode[STIX]{x2202}f}=-D_{\unicode[STIX]{x1D702}}(f).\end{eqnarray}$$
This relation is adapted from a similar equation in the
 $k$
space (Nazarenko Reference Nazarenko2011). Consequently, after a temporal averaging suppressing the temporal dependency, the energy flux at a given frequency
 $\unicode[STIX]{x1D716}(f)$
reads:
 $$\begin{eqnarray}\unicode[STIX]{x1D716}(f^{\ast })=\int _{f^{\ast }}^{f_{m}}D_{\unicode[STIX]{x1D702}}(f)\,\text{d}f.\end{eqnarray}$$
Here
 $f_{m}\approx 1800~\text{Hz}$
is the maximal frequency corresponding to the highest value of
 $k$
scanned in the spatial Fourier analysis. By convention, we impose
 $\unicode[STIX]{x1D716}(f^{\ast }=f_{m})$
to be zero. As the analysis is performed after temporal averaging for a statistically stationary regime, it is not necessary to consider unsteady energy transfer as in Pan & Yue (Reference Pan and Yue2015). This estimation of energy flux
 $\unicode[STIX]{x1D716}(f^{\ast })$
obtained by integration of the dissipation spectrum is shown in figure 15(b). As stated in previous studies of wave turbulence, in the presence of dissipation, the energy flux
 $\unicode[STIX]{x1D716}(f^{\ast })$
decreases with frequency and thus is not conserved inside the power-law capillary spectrum. In numerical simulations of capillary wave turbulence with broad-scale dissipation, the varying nonlinearity level leads to smaller spectral slopes than the theoretical values (Pan & Yue Reference Pan and Yue2015). For elastic plate turbulence, experimentally (Humbert et al.
Reference Humbert, Cadot, Düring, Josserand, Rica and Touzé2013) and numerically (Miquel et al.
Reference Miquel, Alexakis and Mordant2014), non-conservation of energy flux due to dissipation leads to a steepening of the spectra slope. A similar observation is reported experimentally for gravity wave turbulence (Campagne et al.
Reference Campagne, Hassaini, Redor, Sommeria, Viboud and Mordant2018). In contrast here, and in a similar experiment (Deike et al.
Reference Deike, Berhanu and Falcon2014a
) for low enough viscous fluids, the spectral slope remains close to the wave turbulence theory value (
 $-17/6$
for the temporal spectrum). Due to the smaller container size and the higher excitation level, the values of
 $\unicode[STIX]{x1D716}(f^{\ast })$
are found here to be two orders of magnitude larger than in Deike et al. (Reference Deike, Berhanu and Falcon2014a
,Reference Deike, Fuster, Berhanu and Falcon
b
). We note that this estimation of the energy flux is valid only for a statistically stationary measurement, as the formula providing the dissipation
 $\unicode[STIX]{x1D6E4}(f)$
is obtained after averaging over several wave periods (Henderson & Segur Reference Henderson and Segur2013).
(a) Wave dissipation spectrum
 $D_{\unicode[STIX]{x1D702}}(f)$
(see text for definition) for different forcing amplitudes. From bottom to top:
 $\unicode[STIX]{x1D70E}_{h}=1.3$
, 2.1, 2.7, 3.1, 3.4 and 3.6 mm, and
 $\unicode[STIX]{x1D70E}_{s}=0.15$
, 0.19, 0.24, 0.27, 0.29 and 0.34. (b) Estimation of the energy flux
 $\unicode[STIX]{x1D716}(f^{\ast })$
as a function of the frequency
 $f^{\ast }$
obtained by integration of the dissipation spectrum for the same measurements. The energy flux is not constant, showing that dissipation occurs at all scales, even over the range of frequencies where a power-law spectrum is observed.

(a) Spatial spectra
 $S_{\unicode[STIX]{x1D702}}(k)$
, compensated by the theoretical expression (5.3) for varying wave amplitude (see figure 8), using
 $\unicode[STIX]{x1D716}=\unicode[STIX]{x1D716}^{\ast }$
. (b) Temporal spectra
 $S_{\unicode[STIX]{x1D702}}(\unicode[STIX]{x1D714})$
, compensated by the theoretical expression (5.3) for varying wave amplitude, using
 $\unicode[STIX]{x1D716}=\unicode[STIX]{x1D716}^{\ast }$
. The non-dimensional pre-factor,
 $K$
, of the rescaled spectra can be evaluated between the crossover scale (
 $\unicode[STIX]{x1D706}_{c}^{-1}$
or
 $f_{c}$
) and the dissipative scale (
 $\unicode[STIX]{x1D706}_{c}^{-1}$
or
 $f_{c}$
), see (5.10) (c) Same plot as in (a) with
 $\unicode[STIX]{x1D716}=\unicode[STIX]{x1D716}_{E}$
. (d) Same plot as in (b) with
 $\unicode[STIX]{x1D716}=\unicode[STIX]{x1D716}_{E}$
. (e) Effective energy fluxes in the capillary range
 $\unicode[STIX]{x1D716}^{\ast }$
(defined in § 5.2, blue
 $\ast$
) and
 $\unicode[STIX]{x1D716}_{E}$
(defined in § 5.3, red
 $\times$
) for varying wave amplitudes
 $\unicode[STIX]{x1D70E}_{h}$
. Dashed and dotted lines show the expected scaling law
 $\unicode[STIX]{x1D716}\propto \unicode[STIX]{x1D70E}_{h}^{2}$
. (f) Non-dimensional pre-factor
 $K$
(see (5.10)) obtained experimentally from compensated spectra as a function of
 $\unicode[STIX]{x1D70E}_{h}$
.
 $\ast$
:
 $K$
using
 $\unicode[STIX]{x1D716}=\unicode[STIX]{x1D716}^{\ast }$
(energy flux from the dissipation spectrum).
 $\times$
:
 $K$
using
 $\unicode[STIX]{x1D716}=\unicode[STIX]{x1D716}^{\ast }$
(energy flux from energy fluctuations). The non-dimensional pre-factor
 $K$
varies with the forcing strength, in disagreement with the capillary wave turbulence theory.

To compare in more detail the experiments with the theoretical framework, we estimate for each measurement an effective energy flux
 $\unicode[STIX]{x1D716}^{\ast }$
for turbulence of capillary waves by taking the average of
 $\unicode[STIX]{x1D716}(f^{\ast })$
between
 $f_{c}$
and
 $f_{d}$
.
 $\unicode[STIX]{x1D716}(f^{\ast })$
is nearly linear with the total dissipated power
 $D$
in the capillary range. In figure 16(e),
 $\unicode[STIX]{x1D716}^{\ast }$
(blue stars) is found to grow with the wave amplitude
 $\unicode[STIX]{x1D70E}_{h}$
, as this quantity is an indirect measurement of forcing amplitude.
 $\unicode[STIX]{x1D716}^{\ast }$
is defined from the energy balance (5.6) and
 $E_{f}$
is a quadratic function of the wave amplitude, thus
 $\unicode[STIX]{x1D716}^{\ast }$
should behave as
 $\unicode[STIX]{x1D70E}_{h}^{2}$
. For the range of measurements,
 $\unicode[STIX]{x1D716}^{\ast }$
follows experimentally a scaling as
 $\unicode[STIX]{x1D70E}_{h}^{2.1}$
, except for the final point corresponding to the highest forcing amplitude.
Following the expressions of capillary wave turbulence spectra (5.3), compensated spatial and temporal spectra can be computed. For neither the spatial and temporal compensated spectra in figure 16(a,b) do we observe a satisfying collapse of the different measurements. Even if we exclude the lowest amplitude measurement, there is roughly a factor two between the spectrum for
 $\unicode[STIX]{x1D70E}_{h}=3.6~\text{mm}$
and the one for
 $\unicode[STIX]{x1D70E}_{h}=2.1~\text{mm}$
. We note also that the estimation of energy flux
 $\unicode[STIX]{x1D716}^{\ast }$
is indirect, and relies on strong hypotheses concerning the dissipative processes, and thus remains approximate in the experiments.
5.3 Estimation of energy flux from energy fluctuations
To consolidate the estimation of the energy flux, we propose here another method to evaluate experimentally the energy flux, relying on the temporal fluctuations of the energy spatial spectrum
 $E_{k}(t)$
deduced from
 $S_{\unicode[STIX]{x1D702}}(k,t)$
(see § 4.1). The energy budget of the capillary wave cascade written in the wavenumber space provides an alternative theoretical method to compute the energy flux (Nazarenko Reference Nazarenko2011; Miquel et al.
Reference Miquel, Alexakis and Mordant2014; Pan & Yue Reference Pan and Yue2015):
 $$\begin{eqnarray}{\displaystyle \frac{\unicode[STIX]{x2202}E_{k}}{\unicode[STIX]{x2202}t}}+{\displaystyle \frac{\unicode[STIX]{x2202}\unicode[STIX]{x1D716}}{\unicode[STIX]{x2202}k}}=-D_{\unicode[STIX]{x1D702}}(k),\end{eqnarray}$$
with
 $E_{k}$
the spatial spectrum of energy per density unit (5.4),
 $\unicode[STIX]{x1D716}$
the energy flux and
 $D_{\unicode[STIX]{x1D702}}(k)$
the spatial dissipation spectrum.
 $\unicode[STIX]{x2202}E_{k}(k,t)/\unicode[STIX]{x2202}t$
can be obtained from the instantaneous spatial spectrum
 $S_{\unicode[STIX]{x1D702}}(k,t)$
(plotted in figure 12), and it would thus be interesting to gain access to the fluctuations of the energy flux
 $\unicode[STIX]{x1D716}$
. However, experimentally the dissipation rate
 $\unicode[STIX]{x1D6E4}(k)$
at the scale
 $k$
is estimated through the inextensible film model, valid only after averaging over several periods. The dissipation spectrum
 $D_{\unicode[STIX]{x1D702}}(k)=E_{k}(k)\unicode[STIX]{x1D6E4}(k)$
is thus not resolved in time (with
 $\unicode[STIX]{x1D6E4}(k)$
the dissipation rate at the wavenumber
 $k$
). However, the energy fluctuations could provide a complementary estimation of the energy flux. We find experimentally that the temporal r.m.s. value of energy fluctuations integrated over the wavenumbers has the same order of magnitude as
 $\unicode[STIX]{x1D716}^{\ast }$
. This quantity is written as:
 $$\begin{eqnarray}\unicode[STIX]{x1D716}_{E}=\sqrt{\left\langle \left(\int _{k_{c}}^{k_{d}}{\displaystyle \frac{\unicode[STIX]{x2202}E_{k}}{\unicode[STIX]{x2202}t}}\,\text{d}k\right)^{2}\right\rangle },\end{eqnarray}$$
with
 $k_{c}$
the wavenumber corresponding to the gravity–capillary crossover,
 $k_{d}$
the dissipative scale and
 $\langle \,\rangle$
denotes a temporal average.
 $\unicode[STIX]{x1D716}_{E}$
is plotted as a function of
 $\unicode[STIX]{x1D70E}_{h}$
in figure 16(e) (red crosses) and compared with
 $\unicode[STIX]{x1D716}^{\ast }$
. We observe that
 $\unicode[STIX]{x1D716}_{E}$
has the same order of magnitude as
 $\unicode[STIX]{x1D716}^{\ast }$
, but is systematically smaller.
 $\unicode[STIX]{x1D716}_{E}$
also roughly follows the scaling in
 $\unicode[STIX]{x1D70E}_{h}^{2}$
.
Then, replacing
 $\unicode[STIX]{x1D716}^{\ast }$
by
 $\unicode[STIX]{x1D716}_{E}$
, we plot the corresponding compensated spectra in figure 16(c,d). The compensated spectra are slightly better clustered than in figure 16, but the ratio between the top and bottom curves is also of order two. This method of estimating
 $\unicode[STIX]{x1D716}$
from the energy fluctuations is not completely justified theoretically, because a rigorous estimation of the effective energy flux
 $\unicode[STIX]{x1D716}$
should balance dissipation and energy fluctuations. However, these results suggest than on average these two quantities have the same order of magnitude.
We note also that
 $\unicode[STIX]{x1D716}$
could be directly computed from the nonlinear interaction kernel (Nazarenko Reference Nazarenko2011). This can be achieved in numerical simulations when having access both to the time-dependent Fourier modes of the wave amplitude and the wave potential. This is not available experimentally so far. In numerical simulation, such a budget has been computed by Yokoyama & Takaoka (Reference Yokoyama and Takaoka2014) in the context of elastic plates.
5.4 Test of the scaling of spectra according wave turbulence theory
Using the two estimations of effective energy flux,
 $\unicode[STIX]{x1D716}^{\ast }$
and
 $\unicode[STIX]{x1D716}_{E}$
, for turbulent capillary waves, we plotted the compensated spectra in figure 16 according the theoretical expressions given by the wave turbulence theory. From these energy flux estimations, a good rescaling is not observed. Moreover, experimentally the hypotheses of the wave turbulence theory (isotropy, weak nonlinearity, conserved energy flux and so on) are not met. Therefore, we emphasize that we cannot evaluate the numerical values of the Kolmogorov–Zakharov constant
 $C_{KZ}$
in our experiment from the compensated spectra. Nevertheless to summarize our results, we can estimate the non-dimensional pre-factor of the wave elevation spectra using the wave action spectrum (5.1):
 $$\begin{eqnarray}S_{\unicode[STIX]{x1D702}}(k)=2\unicode[STIX]{x03C0}K\unicode[STIX]{x1D716}^{1/2}(\unicode[STIX]{x1D6FE}/\unicode[STIX]{x1D70C})^{-3/4}k^{-15/4},\quad S_{\unicode[STIX]{x1D702}}(\unicode[STIX]{x1D714})=4\unicode[STIX]{x03C0}/3K\unicode[STIX]{x1D716}^{1/2}(\unicode[STIX]{x1D6FE}/\unicode[STIX]{x1D70C})^{1/6}\unicode[STIX]{x1D714}^{-17/6}.\end{eqnarray}$$
We obtain
 $K$
by taking the average of the spatial compensated spectrum (with
 $\unicode[STIX]{x1D706}^{-1}\in (94,312)~\text{m}^{-1}$
to take into account the increase of
 $\unicode[STIX]{x1D706}_{d}^{-1}$
with
 $\unicode[STIX]{x1D70E}_{h}$
) of the temporal spectrum (average between
 $f\in (15,100)~\text{Hz}$
) and of the temporal spectrum derived from spatial measurements. Due to the approximate rescaling in frequency or wavenumbers, the value of
 $K$
for each spectrum is evaluated up to a factor two. We plot in figure 16(f) the average value between these three rescaled spectra as a function of
 $\unicode[STIX]{x1D70E}_{h}$
, in the case where the flux is given by the dissipation spectrum
 $\unicode[STIX]{x1D716}=\unicode[STIX]{x1D716}^{\ast }$
(blue stars) and in the case where the flux is given by the energy fluctuations
 $\unicode[STIX]{x1D716}=\unicode[STIX]{x1D716}_{E}$
(red crosses). In the case
 $\unicode[STIX]{x1D716}=\unicode[STIX]{x1D716}^{\ast }$
,
 $K$
is found to increase with
 $\unicode[STIX]{x1D70E}_{h}$
. In the case
 $\unicode[STIX]{x1D716}=\unicode[STIX]{x1D716}_{E}$
, the values of
 $K$
are systematically larger and more scattered. According to the wave turbulence theory, the pre-factor
 $K$
should not depend on the wave amplitude (which is contained in
 $\unicode[STIX]{x1D716}$
) and the values of
 $K$
should all collapse towards a constant. Our experimental results demonstrate that at high levels of nonlinearity, with parasitic capillary wave formation and with an important broad-scale dissipation, the spectra are not quantitatively in agreement with the wave turbulence theory predictions, although the experimental spectral slopes have the values given by the theory.
5.5 Applicability of wave turbulence theory in capillary wave experiments
Given the presented results, we discuss now the applicability of Zakharov’s theory in capillary wave experiments. Several independent experiments have reported observation of the spectra exponents given by the wave turbulence theory (Wright et al.
Reference Wright, Budakian and Putterman1996; Henry, Alstrom & Levinsen Reference Henry, Alstrom and Levinsen2000; Brazhnikov et al.
Reference Brazhnikov, Kolmakov, Levchenko and Mezhov-Deglin2002; Falcon et al.
Reference Falcon, Laroche and Fauve2007; Falcón et al.
Reference Falcón, Falcon, Bortolozzo and Fauve2009; Xia, Shats & Punzmann Reference Xia, Shats and Punzmann2010). Nevertheless, tests of the energy flux scaling
 $\unicode[STIX]{x1D716}^{1/2}$
have been performed in only one experimental study (Deike et al.
Reference Deike, Berhanu and Falcon2014a
) for a very low viscosity liquid (mercury). Most previous laboratory works have tried to isolate capillary wave turbulence from the gravity wave regime by using a parametric forcing (Wright et al.
Reference Wright, Budakian and Putterman1996, Reference Wright, Budakian, Pine and Putterman1997; Henry et al.
Reference Henry, Alstrom and Levinsen2000; Brazhnikov et al.
Reference Brazhnikov, Kolmakov, Levchenko and Mezhov-Deglin2002; Snouck, Westra & van de Water Reference Snouck, Westra and van de Water2009; Xia et al.
Reference Xia, Shats and Punzmann2010), by operating under microgravity (Falcón et al.
Reference Falcón, Falcon, Bortolozzo and Fauve2009) or by studying waves at the interface between two fluids (Düring & Falcón Reference Düring and Falcón2009; Issenmann, Laroche & Falcon Reference Issenmann, Laroche and Falcon2016). In experiments where capillary waves are forced by random gravity waves, the situation is puzzling. Spectra of capillary waves measured with local capacitive probes verify the power law
 $f^{-17/6}$
(Falcon et al.
Reference Falcon, Laroche and Fauve2007; Deike et al.
Reference Deike, Berhanu and Falcon2012, Reference Deike, Berhanu and Falcon2014a
). However, study of the decay of turbulence has shown that the decline of the capillaries follows the viscous damping of the largest container eigenmode (Deike et al.
Reference Deike, Berhanu and Falcon2012). A similar observation was also reported for a parametric excitation with a cryogenic liquid of low viscosity (Brazhnikov et al.
Reference Brazhnikov, Kolmakov, Levchenko and Mezhov-Deglin2002). Consequently, dissipation occurs at all scales of the turbulent cascade leading to a non-conserved energy flux (Deike et al.
Reference Deike, Berhanu and Falcon2014a
). This latter point constitutes a severe drawback of the applicability of wave turbulence theory for capillary wave experiments, as the formalism of the theory relies on a Hamiltonian description of the wave-field dynamics.
Here, our spatio-temporal measurements of free-surface deformation complete these previous observations. Capillary waves are generated by nonlinear wave interactions from the randomly excited gravity waves produced by the wavemaker. At a high enough forcing amplitude, for the scales belonging to the capillary wave range, spectra of wave elevation behave as power laws, defining the turbulence of capillary waves. The exponents of spectra are in agreement with the wave turbulence theory (
 $-15/4$
in
 $k$
-space and
 $-17/6$
in
 $\unicode[STIX]{x1D714}$
-space). However, the level of nonlinearity given by the wave steepness and the significant broad-scale dissipation suggests that the experimental capillary wave turbulence probably does not follow the weakly nonlinear mechanisms described in the theory. Due to the large viscous dissipation in capillary scales, the level of forcing corresponding to a randomization of the initial conditions corresponds to a high level of nonlinearity. Using two different methods, we show that the time-scale separation is broken. First, the nonlinear times have similar values to the linear time, i.e. the wave period. Then, by analysing the temporal fluctuations of the spectra, we demonstrate that the wave energy transfers occur through successive bursts, distributing energy quasi-instantaneously from forcing scales to a large range of smaller scales. Between bursts, a relaxation process takes place which could be closer to the weakly nonlinear theory. We interpret those strong nonlinear events in the physical space as a manifestation of parasitic capillary wave generation. This non-local wave interaction mechanism produces capillary waves from gravity waves commonly observed at the surface of the oceans. Evidence of parasitic capillary wave trains are found in the experimental reconstructions of the wave field and, due to the random forcing, capillary waves are excited on a broad range of scales. The process generating the capillaries is strongly nonlinear and explains the short correlation time scale observed in the capillary turbulent spectra.
Then, by estimating the dissipated power through the viscous wave damping, we estimate the energy flux
 $\unicode[STIX]{x1D716}(f^{\ast })$
in the capillary wave range. This energy flux is not conserved through the scales, again displaying the importance of viscous dissipation and a strong disagreement with the hypothesis of wave turbulence theory which supposes that dissipation is negligible in the inertial range, where power-law spectra are expected (and observed). The rescaling of the wave spectra by the mean energy flux for different excitation amplitudes is approximate both when considering the spatial spectra (in figure 16
a) and the temporal spectra (in figure 16
b). These observations confirm that the capillary wave turbulence experimentally obtained in the strongly nonlinear regime is not described by the weakly nonlinear theory.
However, we have evidence of the presence of three-wave interactions in the temporal and spatial Fourier spaces and the exponents of power-law spectra are close to those given by the wave turbulence theory. How can we explain these statements? We assumed that wave energy transfer occurs mainly through strong and fast nonlinear events, which are interpreted as parasitic capillary wave generation, when the forcing gravity waves are sufficiently steep. In fact, parasitic wave generation can be described at leading order as a non-resonant three-wave process (Watson & Buchsbaum Reference Watson and Buchsbaum1996; Watson Reference Watson1999). Moreover, it was found that the energy decay of parasitic waves follows the law
 $E(t)/E(t=0)=[1+t/\unicode[STIX]{x1D70F}]^{-1}$
(Deike et al.
Reference Deike, Popinet and Melville2015b
), with
 $\unicode[STIX]{x1D70F}$
a characteristic nonlinear time. This temporal evolution in the decaying regime is a direct consequence of the quadratic nonlinearity of the equations governing free-surface waves. Then, the bispectral analysis shows clear evidence of three-wave interactions in frequency space. Therefore, at the leading order, the wave energy transfer occurs through three-wave interactions, which may be resonant or not. This statement implies a energy flux scaling in
 $\unicode[STIX]{x1D716}^{1/2}$
, which is only approximately verified by plotting the compensated spectra (figure 16
a–d) with
 $\unicode[STIX]{x1D716}$
estimated from the dissipation spectrum or from the fluctuations of the energy spectrum. Consequently, from dimensional analysis and the linear dispersion relation, the exponents of the power-law spectra for capillary waves in the turbulent regime are
 $-15/4$
in
 $k$
-space and
 $-17/6$
in
 $\unicode[STIX]{x1D714}$
-space, like in wave turbulence theory (Connaughton et al.
Reference Connaughton, Nazarenko and Newell2003), under the condition that nonlinearity is high enough to develop a self-similar regime on a sufficiently large range, defining clear power-law spectra. Incorporation of higher-order nonlinear interactions (four-wave, five-wave and higher processes), could improve the description, especially in the rescaling of spectra by the estimated average energy flux
 $\unicode[STIX]{x1D716}^{\ast }$
. This experiment with nonlinear random regimes of capillary waves demonstrates that the verification of spectral slopes is not sufficient to test accurately wave turbulence theory in experiments. Although difficult and approximate in experiments, estimation of the energy flux appears necessary.
6 Experimental constraints on capillary wave turbulence observation
Wave turbulence theory fails to describe quantitatively random regimes of capillary waves in our experiments. We argue that this statement can be generalized to other experimental or natural situations, where random capillary waves on Earth are generated in water from gravity waves by nonlinear interactions, due to two main reasons: significant viscous dissipation and the gravity–capillary wave crossover.
6.1 Effect of viscous dissipation
First, viscous dissipation is important for capillary waves and cannot be neglected. The inextensible film model (van Dorn Reference van Dorn1966; Henderson & Segur Reference Henderson and Segur2013) provides the wave decay rate
 $\unicode[STIX]{x1D6FF}=\sqrt{2}\sqrt{\unicode[STIX]{x1D708}\unicode[STIX]{x1D714}}k/4$
in deep-water conditions and is verified for capillary waves. The transition between gravity and capillary waves occurs for a critical wavenumber
 $k_{c}=\sqrt{\unicode[STIX]{x1D70C}g/\unicode[STIX]{x1D6FE}}$
, which corresponds to a critical frequency
 $f_{c}\approx 14~\text{Hz}$
. For this frequency
 $f_{c}$
, from which the capillary wave range starts, the dissipative time
 $1/\unicode[STIX]{x1D6FF}_{c}\approx 0.69~\text{s}$
. This time can be interpreted spatially by computing the corresponding dissipative length
 $l_{att}=v_{g}/\unicode[STIX]{x1D6FF}$
, with
 $v_{g}=\unicode[STIX]{x2202}\unicode[STIX]{x1D714}/\unicode[STIX]{x2202}k$
, which for
 $f_{c}$
gives
 $l_{att\,c}\approx 0.15~\text{m}$
. This length constitutes the typical distance travelled by a wave produced by the wavemaker or a nonlinear interaction. If we consider the highest frequency of the capillary power-law spectrum,
 $f_{d}=200~\text{Hz}$
, then
 $1/\unicode[STIX]{x1D6FF}_{m}\approx 0.024~\text{s}$
and
 $l_{att\,d}\approx 0.015~\text{m}$
. The size of the tank being 0.165 m, it consequently appears impossible to obtain a homogeneous wave field by exciting the waves in the capillary range, except when the forcing is homogeneous, like when capillary waves are forced through the Faraday instability. Finite-size effects are also often discussed as a quantization of the wavenumbers in the tank, but we emphasize that this quantization occurs by multiple reflections on the boundaries of the tank, like an
 $N$
-wave interference process (see appendix A). Moreover, the reflection coefficient in the presence of a contact line in the capillary regime is not well documented, but a recent study (Michel, Petrelis & Fauve Reference Michel, Petrelis and Fauve2016) shows that is lower than one. Damping by the meniscus and the strong surface dissipation by viscosity thus explain why no quantization in wavenumbers is observed in capillary wave experiments, as can been seen in figure 6(a), because a capillary wave disappears after travelling a distance of the order of
 $2l_{att\,c}\approx 0.3~\text{m}$
. A small-sized experiment helps in obtaining a sufficient energy flux per surface unit
 $\unicode[STIX]{x1D716}$
to observe power-law spectra, but for capillary waves the boundaries are almost not felt. However this is difficult to quantify, the strong dissipation likely implies a strong forcing amplitude to fill the spectrum in the capillary wave range, which explains why, to obtain the self-similar wave turbulent regime, a steepness of the order of 0.2 is needed. Moreover, it is not efficient to produce capillary waves directly through the wavemaker, because they would be observable only in the vicinity of the wavemaker due to the viscous damping. The capillary waves are then produced from gravity waves by nonlinear wave interactions.
The substantial viscous dissipation thus occurs at all scales and implies that energy flux is not conserved through the scales. Consequently, the constant-flux solutions of wave turbulence theory cannot be applied directly to the experimental field of random capillary waves. To take into account the decay of energy flux through the capillary scales, an average energy flux
 $\unicode[STIX]{x1D716}^{\ast }$
(or
 $\unicode[STIX]{x1D716}_{E}$
) can be used to rescale the spectra. When a low-viscosity liquid like mercury is used the rescaling is acceptable (Deike et al.
Reference Deike, Berhanu and Falcon2014a
), but here with water, using the same method, the rescaling is less convincing.
6.2 Effects of gravity–capillary wave crossover
The nonlinear conversion of gravity waves into capillary waves is also problematic in applying wave turbulence theory to experimental capillary waves. The power-law spectra are indeed obtained for self-similar dispersion relations expressed also as power laws. The analytically predicted spectra are thus expected either for pure gravity wave or pure capillary wave turbulence, thus far from the crossover wavenumber
 $k_{c}$
. Several experiments (Falcon et al.
Reference Falcon, Laroche and Fauve2007; Deike et al.
Reference Deike, Berhanu and Falcon2012, Reference Deike, Miquel, Gutiérrez, Jamin, Semin, Berhanu, Falcon and Bonnefoy2015a
) in water or mercury have shown an abrupt transition around
 $f_{c}$
between a gravity wave power-law spectrum and a capillary wave power-law spectrum. However, for a given energy flux
 $\unicode[STIX]{x1D716}$
, both spectra are incompatible as the values of the Kolmogorov–Zakharov constants are fixed by the theory. For gravity wave turbulence, according wave turbulence theory, the power spectrum of the wave elevation
 $\unicode[STIX]{x1D702}(\boldsymbol{x},t)$
is written in time as (Zakharov & Filonenko Reference Zakharov and Filonenko1967a
):
 $S_{\unicode[STIX]{x1D702}}(\unicode[STIX]{x1D714})=C_{KZ}^{(g\unicode[STIX]{x1D714})}\unicode[STIX]{x1D716}^{1/3}\unicode[STIX]{x1D714}^{-4}$
. The value of
 $C_{KZ}^{(g\,\unicode[STIX]{x1D714})}$
was analytically found approximately equal to 2.75 (Zakharov Reference Zakharov2010). If we assume that, at the gravity–capillary crossover
 $f_{c}$
, the gravity wave spectrum equals the capillary wave spectrum,
 $S_{\unicode[STIX]{x1D702}}(\unicode[STIX]{x1D714})=4\unicode[STIX]{x03C0}/3C_{KZ}\unicode[STIX]{x1D716}^{1/2}(\unicode[STIX]{x1D6FE}/\unicode[STIX]{x1D70C})^{1/6}\unicode[STIX]{x1D714}^{-17/6}$
, with
 $4\unicode[STIX]{x03C0}/3C_{KZ}\approx 41$
(Pushkarev & Zakharov Reference Pushkarev and Zakharov2000), then the same energy flux cannot be transferred from gravity scales to capillary scales. A simple order of magnitude illustrates this statement. For example, in gravity wave turbulence experiments, the energy flux was found to be equal to
 $\unicode[STIX]{x1D716}=1\times 10^{-4}~\text{m}^{-3}~\text{s}^{-3}$
for the gravity wave cascade (Deike et al.
Reference Deike, Miquel, Gutiérrez, Jamin, Semin, Berhanu, Falcon and Bonnefoy2015a
). Continuity of the temporal spectrum
 $S_{\unicode[STIX]{x1D702}}(\unicode[STIX]{x1D714})$
for
 $\unicode[STIX]{x1D714}_{c}=2\unicode[STIX]{x03C0}f_{c}$
implies that
 $\unicode[STIX]{x1D716}$
becomes equal to
 $6.9\times 10^{-7}~\text{m}^{-3}~\text{s}^{-3}$
in the capillary wave regime, a value significantly lower. This result holds for other values of the energy flux. If we assume that
 $f_{c}$
is a free parameter, continuity of gravity and capillary wave turbulent spectra gives a gravity–capillary crossover at
 $f=1.65~\text{Hz}$
for
 $\unicode[STIX]{x1D716}=1\times 10^{-4}~\text{m}^{-3}~\text{s}^{-3}$
, which appears too small. The order of magnitude of
 $f_{c}$
would be found only for an energy flux of order
 $\unicode[STIX]{x1D716}=1\times 10^{-10}~\text{m}^{-3}~\text{s}^{-3}$
. Therefore, only a small amount of the energy in the wave system could be transferred to the capillary waves by a wave turbulence mechanism assuming local interactions in
 $k$
space. An estimation of the injected power at large scales will thus fail to estimate the energy flux of the capillary wave turbulence. Whereas it was proposed that, for small enough energy flux (
 $\unicode[STIX]{x1D716}<(\unicode[STIX]{x1D6FE}g/\unicode[STIX]{x1D70C})^{3/4}\approx 4.3\times 10^{-3}~\text{m}^{-3}~\text{s}^{-3}$
), gravity and capillary spectra could be connected (Connaughton et al.
Reference Connaughton, Nazarenko and Newell2003), it appears thus that, for given values of the Kolmogorov–Zakharov constants, either energy accumulation is expected around
 $f_{c}$
or energy transfer to the small scales occurs by non-local interactions, i.e. the involved scales are significantly separated in frequency or wavenumber space. Our experiments illustrate the latter case. Steep gravity waves produce short capillary wave trains by a fast and direct mechanism at small scale, like the parasitic capillary wave generation mechanism. As illustrated in figure 12(a), energy bursts quasi-instantaneously populate a large range of capillary scales. For a sufficient steepness we thus expect that gravity waves nonlinearly generate capillary waves by direct non-local interactions, whereas wave turbulence theory assumes local interactions in wavenumber space (Nazarenko Reference Nazarenko2011). There have been a few statistical studies of gravity–capillary waves, using a kinetic equation including three-wave interactions numerically (Watson & McBride Reference Watson and McBride1993; Watson & Buchsbaum Reference Watson and Buchsbaum1996; Watson Reference Watson1999; Dulov & Kosnik Reference Dulov and Kosnik2009; Kosnik et al.
Reference Kosnik, Dulov and Kudryavtsev2010) and analytically (Stiassnie Reference Stiassnie1996). However, the resulting spectra are consequently not expressed as power laws and so are more difficult to test experimentally.
7 Conclusion
An experimental study of the turbulent regimes of capillary waves forced by steep gravity waves is presented here, using a spatio-temporal measurement of free-surface deformation. Gravity waves are generated by a wavemaker with a random forcing in a small tank. Capillary waves are generated by nonlinear wave interactions, principally by the transient generation of capillary trains in a way similar to the parasitic capillary wave generation mechanism. In spatial Fourier space, capillary wave generation is associated with intermittent bursts of energy quasi-instantaneously transferring energy from the large to the small scales. After a temporal average, capillary waves appear on average uncorrelated, justifying a statistical analysis based on the spatial and temporal spectra of the wave elevation. At a high enough amplitude of excitation, for the scales belonging to the capillary wave range, spectra of the wave elevation behave as power laws, whose exponents are in agreement with the wave turbulence theory (
 $-15/4$
in
 $k$
-space and
 $-17/6$
in
 $\unicode[STIX]{x1D714}$
-space). However, due principally to the substantial viscous dissipation and the significant level of nonlinearity, the wave turbulence theory fails to describe these experimental measurements. The observed power laws may thus be explained by dimensional analysis in the presence of a quadratic nonlinearity.
In this work, we experimentally characterize an example of strong wave turbulence, which differs in the mechanisms at play from the weakly nonlinear wave turbulence theory. In particular, capillary waves are mainly produced by the parasitic capillary wave generation mechanism, which can be interpreted in a first approximation as a strongly non-local and non-resonant three-wave interaction (Watson & Buchsbaum Reference Watson and Buchsbaum1996). Taking into account higher-order nonlinear interactions could be necessary to describe quantitatively parasitic wave generation. Moreover, non-resonant interactions are often not considered in the study of random waves interacting nonlinearly, because the contributions of non-resonant interactions in wave energy vanish for a sufficiently large system or long observation times. Nevertheless, for capillary waves, due to viscous dissipation, the lifetime of the wave packets is short and the tank size is limited – therefore, the contribution of non-resonant interactions has no reason to be negligible. The determination of the relative contribution between resonant and non-resonant interactions could constitute a new direction in wave turbulence study, beyond the weakly nonlinear limit. Such a study is indeed relevant in most experimental systems with interacting waves. A similar statement could be drawn in nature, for the small-scale spectrum of random sea, when capillary waves are generated by the parasitic capillary wave generation mechanism.
Acknowledgements
We thank N. Mordant for discussions and help in data processing. We also acknowledge S. Nazarenko, F. Pétrélis and S. Fauve for discussions, L. Gordillo for help in PIV measurements and A. Lantheaume for technical assistance. We thank the referees for insightful comments which greatly improved the quality of this article. This work was funded by ANR-12-BS04-0005 Turbulon.
Supplementary movies
Supplementary movies are available at https://doi.org/10.1017/jfm.2018.467.
Appendix A. Effect of wave dissipation on finite size effects
Using a simplified model we study in this appendix the effect of viscous wave dissipation on the wave quantization phenomenon, which is expected when the wave field is confined in a finite-sized container. We consider a 1-D domain along
 $O_{x}$
between
 $x=0$
and
 $x=L$
, limited by rigid walls. An initial monochromatic surface wave of wavenumber
 $k$
and angular frequency
 $\unicode[STIX]{x1D714}$
is continuously injected at
 $x=0$
with an amplitude
 $A_{0}$
. The motion of the wall creating the wave is supposed to be sufficiently small as to be neglected. Due to linear viscous dissipation the wave decays spatially at a rate
 $\unicode[STIX]{x1D6FD}$
. The wavelength is supposed small compared to the typical dissipation length
 $1/\unicode[STIX]{x1D6FD}$
and the system length. The initial free-surface deformation is written using complex formalism
 $\text{}\underline{\unicode[STIX]{x1D702}_{0}}(x,t)=A_{0}\text{e}^{-\unicode[STIX]{x1D6FD}\,x}\text{e}^{\text{i}(\unicode[STIX]{x1D714}t-kx)}$
. When the wave reaches the position
 $x=L$
, to zero the horizontal velocity at any time, it can be shown that a reflected wave labelled 1 is created, propagating backwards with the same amplitude as the incident wave. The wave 1 is then reflected at
 $x=0$
to create the forward wave 2 and so on. The total free-surface deformation can be expressed in the stationary regime by the sum:
 $$\begin{eqnarray}\text{}\underline{\unicode[STIX]{x1D702}}(x,t)=A_{0}\text{e}^{-\unicode[STIX]{x1D6FD}x}\text{e}^{\text{i}(\unicode[STIX]{x1D714}t-kx)}+A_{1}\text{e}^{\unicode[STIX]{x1D6FD}(L-x)}\text{e}^{\text{i}(\unicode[STIX]{x1D714}t+kx)}+A_{2}\text{e}^{-\unicode[STIX]{x1D6FD}x}\text{e}^{\text{i}(\unicode[STIX]{x1D714}t-kx)}+A_{3}\text{e}^{\unicode[STIX]{x1D6FD}(L-x)}\text{e}^{\text{i}(\unicode[STIX]{x1D714}t+kx)}\ldots\end{eqnarray}$$
with the following relations between the wave amplitudes,
 $$\begin{eqnarray}\displaystyle \left.\begin{array}{@{}rcl@{}}A_{0}\text{e}^{-\unicode[STIX]{x1D6FD}L}\text{e}^{-\text{i}kL}\, & =\, & A_{1}\text{e}^{\text{i}kL}\\ A_{1}\text{e}^{-\unicode[STIX]{x1D6FD}L}\, & =\, & A_{2}\\ A_{2}\text{e}^{-\unicode[STIX]{x1D6FD}L}\text{e}^{-\text{i}kL}\, & =\, & A_{3}\text{e}^{\text{i}kL}\\ \, & \ldots \, & \end{array}\right\}. & & \displaystyle\end{eqnarray}$$
Then the amplitudes of the forward and backward waves are written, respectively, as:
 $$\begin{eqnarray}A_{2p}=A_{0}(\text{e}^{-2\unicode[STIX]{x1D6FD}L}\text{e}^{-2\text{i}kL})^{p},\quad A_{2p+1}=A_{1}(\text{e}^{-2\unicode[STIX]{x1D6FD}L}\text{e}^{-2\text{i}kL})^{p}.\end{eqnarray}$$
Consequently,
 $\text{}\underline{\unicode[STIX]{x1D702}}$
can be seen as the sum of two geometric sequences with the same ratio
 $\text{e}^{-2\unicode[STIX]{x1D6FD}L}\text{e}^{-2\text{i}kL}$
. By taking the infinite limit in the sum, like in a
 $N$
-wave interference problem, we obtain:
 $$\begin{eqnarray}\text{}\underline{\unicode[STIX]{x1D702}}(x,t)={\displaystyle \frac{A_{0}}{1-\text{e}^{-2\unicode[STIX]{x1D6FD}L}\text{e}^{-2\text{i}kL}}}(\text{e}^{\text{i}(\unicode[STIX]{x1D714}t-kx)}+\text{e}^{-\unicode[STIX]{x1D6FD}L}\text{e}^{-2\text{i}kL}\text{e}^{\text{i}(\unicode[STIX]{x1D714}t+kx)}).\end{eqnarray}$$
The space and time average amplitude is obtained by taking the square root of the product of
 $\text{}\underline{\unicode[STIX]{x1D702}}$
with its complex conjugate. After some algebra, we obtain:
 $$\begin{eqnarray}\langle \unicode[STIX]{x1D702}\rangle =\sqrt{\text{}\underline{\unicode[STIX]{x1D702}}\text{}\underline{\unicode[STIX]{x1D702}}^{\ast }}=\left({\displaystyle \frac{A_{0}^{2}{\displaystyle \frac{1+\text{e}^{-\unicode[STIX]{x1D6FD}L}}{1-\text{e}^{-\unicode[STIX]{x1D6FD}L}}}}{1+4{\displaystyle \frac{\text{e}^{-\unicode[STIX]{x1D6FD}L}}{(1-\text{e}^{-\unicode[STIX]{x1D6FD}L})^{2}}}\sin ^{2}(kL)}}\right)^{1/2}.\end{eqnarray}$$
(a)
 $\langle \unicode[STIX]{x1D702}\rangle /A_{0}$
as a function of
 $kL/\unicode[STIX]{x03C0}$
for different levels of wave dissipation quantified by the attenuation length
 $l_{att}=0.2L$
(blue dashed line),
 $l_{att}=2L$
(cyan dotted line),
 $l_{att}=20L$
(green dash–dotted line) and
 $l_{att}=200L$
(red plain line). For small enough dissipation, wavenumber quantization for
 $k$
multiples of
 $\unicode[STIX]{x03C0}/L$
is found. (b) Half-width at half-maximum of the resonant peak as a function of
 $l_{att}$
. (c)
 $\langle \unicode[STIX]{x1D702}\rangle /A_{0}$
as function of the wave frequency using the experimental parameters: container size, dispersion relation and increasing dissipation rate with frequency. Wave-mode quantization disappears above
 $f>10~\text{Hz}$
.

The dependency of
 $\langle \unicode[STIX]{x1D702}\rangle$
with the wavenumber
 $k$
is plotted in figure 17(a) for varying dissipation level. The attenuation length
 $l_{att}=1/\unicode[STIX]{x1D6FD}$
is used to facilitate the comparison with the system size. The solution is analogous to the resonance of a cavity in which a wave is injected. When dissipation is small or
 $l_{att}$
large, resonance occurs for the eigenmode of the system given by the condition
 $k=p\unicode[STIX]{x03C0}/L$
, with
 $p$
a positive integer. The peak amplitudes saturate due to the non-zero dissipation. If dissipation is increased, the attenuation length decreases and the width of the peaks increases, as can be seen in figure 17(b). For
 $l_{att}\lesssim 0.4L$
the width become comparable to the distance between peaks and they become indistinguishable.
 $\langle \unicode[STIX]{x1D702}\rangle$
is thus nearly flat for
 $l_{att}=0.2L$
in figure 17(a). These results can be applied to the experimental situation, by taking
 $L=0.165~\text{m}$
, using the dispersion relation (1.1) and expressing
 $l_{att}=v_{g}/\unicode[STIX]{x1D6FF}$
, with
 $\unicode[STIX]{x1D6FF}=\sqrt{2}\sqrt{\unicode[STIX]{x1D708}\unicode[STIX]{x1D714}}k/4$
the decay rate in deep water according to the inextensible film model (see § 6.1). The average wave amplitude
 $\langle \unicode[STIX]{x1D702}\rangle$
is displayed as a function of the frequency of the injected wave in figure 17(b). Resonance due to the finite size of the tank becomes insignificant for
 $f>10~\text{Hz}$
, thus in the capillary regime. This simple model shows that the quantization of the wavenumbers in a finite-sized domain is a limit result for vanishing viscous dissipation in the presence of forcing. The eigenmodes are indeed stationary wave solutions in the free regime (without forcing by a wavemaker) and obtained by applying a Helmholtz equation on the domain. With forcing and small dissipation, these modes are created physically by an interference process due to multiple reflections of the waves on the domain boundaries. In the presence of significant dissipation, the container modes are less defined or even disappear completely when the waves are damped too much during their propagation to feel the boundaries. Experimentally, energy dissipation at the reflection in capillary wave regime, due to the motion of the contact line, increases still further the total amount of dissipation, and the wave-mode quantization becomes even less observable.